SemEval-2007 Task 04:
Classification of Semantic Relations between Nominals
Roxana Girju Univ. of Illinois at Urbana-Champaign
Urbana, IL 61801 [email protected]
Preslav Nakov
Univ. of California at Berkeley Berkeley, CA 94720 [email protected]
Vivi Nastase EML Research gGmbH Heidelberg, Germany 69118
Stan Szpakowicz University of Ottawa Ottawa, ON K1N 6N5 [email protected]
Peter Turney
National Research Council of Canada Ottawa, ON K1A 0R6
Deniz Yuret Koc¸ University Istanbul, Turkey 34450
Abstract
The NLP community has shown a renewed interest in deeper semantic analyses, among them automatic recognition of relations be-tween pairs of words in a text. We present an evaluation task designed to provide a frame-work for comparing different approaches to classifying semantic relations between nom-inals in a sentence. This is part of SemEval, the 4th
edition of the semantic evaluation event previously known as SensEval. We de-fine the task, describe the training/test data and their creation, list the participating sys-tems and discuss their results. There were 14 teams who submitted 15 systems.
1 Task Description and Related Work
The theme of Task 4 is the classification of semantic relations between simple nominals (nouns or base noun phrases) other than named entities – honey
bee, for example, shows an instance of the
Product-Producer relation. The classification occurs in the context of a sentence in a written English text. Al-gorithms for classifying semantic relations can be applied in information retrieval, information extrac-tion, text summarizaextrac-tion, question answering and so on. The recognition of textual entailment (Tatu and Moldovan, 2005) is an example of successful use of this type of deeper analysis in high-end NLP appli-cations.
The literature shows a wide variety of methods of nominal relation classification. They depend as much on the training data as on the domain of ap-plication and the available resources. Rosario and
Hearst (2001) classify noun compounds from the domain of medicine, using 13 classes that describe the semantic relation between the head noun and the modifier in a given noun compound. Rosario et al. (2002) classify noun compounds using the MeSH hierarchy and a multi-level hierarchy of se-mantic relations, with 15 classes at the top level. Nastase and Szpakowicz (2003) present a two-level hierarchy for classifying noun-modifier relations in base noun phrases from general text, with 5 classes at the top and 30 classes at the bottom; other re-searchers (Turney and Littman, 2005; Turney, 2005; Nastase et al., 2006) have used their class scheme and data set. Moldovan et al. (2004) propose a 35-class scheme to 35-classify relations in various phrases; the same scheme has been applied to noun com-pounds and other noun phrases (Girju et al., 2005). Chklovski and Pantel (2004) introduce a 5-class set, designed specifically for characterizing verb-verb semantic relations. Stephens et al. (2001) propose 17 classes targeted to relations between genes. La-pata (2002) presents a binary classification of rela-tions in nominalizarela-tions.
There is little consensus on the relation sets and algorithms for analyzing semantic relations, and it seems unlikely that any single scheme could work for all applications. For example, the gene-gene re-lation scheme of Stephens et al. (2001), with rela-tions like X phosphorylates Y, is unlikely to be trans-ferred easily to general text.
Relation Training data Test data Agreement Example
positive set size positive set size (independent tagging)
Cause-Effect 52.1% 140 51.3% 80 86.1% laugh (cause) wrinkles (effect) Instrument-Agency 50.7% 140 48.7% 78 69.6% laser (instrument) printer (agency) Product-Producer 60.7% 140 66.7% 93 68.5% honey (product) bee (producer)
Origin-Entity 38.6% 140 44.4% 81 77.8% message (entity) from outer-space (origin) Theme-Tool 41.4% 140 40.8% 71 47.8% news (theme) conference(tool)
Part-Whole 46.4% 140 36.1% 72 73.2% the door (part) of the car (whole)
Content-Container 46.4% 140 51.4% 74 69.1% the apples (content) in the basket (container)
Table 1: Data set statistics
be to try to design a unified standard – it would be likely to have shortcomings just as any of the others we have just reviewed. Instead, we have decided to focus on separate semantic relations that many re-searchers list in their relation sets. We have built an-notated data sets for seven such relations. Every data set supports a separate binary classification task.
2 Building the Annotated Data Sets
Ours is a new evaluation task, so we began with data set creation and annotation guidelines. The data set that Nastase and Szpakowicz (2003) created had re-lation labels and part-of-speech and WordNet sense annotations, to facilitate classification. (Moldovan et al., 2004; Girju et al., 2005) gave the annotators an example of each phrase in a sentence along with WordNet senses and position of arguments. Our annotations include all these, to support a variety of methods (since we work with relations between nominals, the part of speech is always noun). We have used WordNet 3.0 on the Web and sense index tags.
We chose the following semantic relations: Cause-Effect, Content-Container, Instrument-Agency, Origin-Entity, Part-Whole, Product-Producer and Theme-Tool. We wrote seven detailed definitions, including restrictions and conventions, plus prototypical positive and near-miss negative examples. For each relation separately, we based data collection on wild-card search patterns that Google allows. We built the patterns manually, following Hearst (1992) and Nakov and Hearst (2006). Instances of the relation Content-Container, for example, come up in response to queries such as “* contains *”, “* holds *”, “the * in the *”. Fol-lowing the model of the Senseval-3 English Lexical Sample Task, we set out to collect 140 training and at least 70 test examples per relation, so we had a number of different patterns to ensure variety. We also aimed to collect a balanced number of positive and negative examples. The use of heuristic patterns to search for both positive and negative examples
should naturally result in negative examples that are near misses. We believe that near misses are more useful for supervised learning than negative examples that are generated randomly.
“Among the contents of the <e1>vessel</e1>
were a set of carpenter’s <e2>tools</e2>,
sev-eral large storage jars, ceramic utensils, ropes and remnants of food, as well as a heavy load of ballast stones.”
WordNet(e1) = “vessel%1:06:00::”, WordNet(e2) = “tool%1:06:00::”, Content-Container(e2, e1) = “true”, Query = “contents of the * were a”
Figure 1: Annotations illustrated
Figure 1 illustrates the annotations. We tag the nominals, so parsing or chunking is not necessary. For Task 4, we define a nominal as a noun or base noun phrase, excluding names entities. A base noun phrase, e.g., lawn or lawn mower, is a noun with pre-modifiers. We also exclude complex noun phrases (e.g., with attached prepositional phrases – the
en-gine of the lawn mower).
ex-amples for each relation.1
The average inter-annotator agreement on rela-tions (true/false) after the independent annotation step was 70.3%, and the average agreement on WordNet sense labels was 71.9%. In the process of arriving at a consensus between annotators, the def-inition of each relation was revised to cover explic-itly cases where there had been disagreement. We expect that these revised definitions would lead to much higher levels of agreement than the original definitions did.
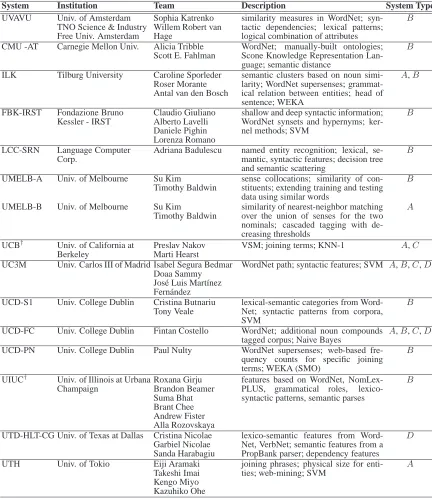
3 The Participants
The task of classifying semantic relations between nominals has attracted the participation of 14 teams who submitted 15 systems. Table 4 lists the sys-tems, the authors and their affiliations, and brief de-scriptions. The systems’ performance information in terms of precision, recall, F-measure and
accu-racy, macroaveraged over all relations, appears in Table 3. We computed these measures as described in Lewis (1991).
We distinguish four categories of systems based on the type of information used – WordNet senses and/or Google queries:
A – WordNet =NO& Query =NO; B – WordNet =YES& Query =NO; C – WordNet =NO& Query =YES; D – WordNet =YES& Query =YES.
WordNet = “YES” or WordNet = “NO” tells us only whether a system uses the WordNet sense la-bels in the data sets. A system may use WordNet internally for varied purposes, but ignore our sense labels; such a system would be in categoryAorC.
Based on the input variation, each submitted system may have up to 4 variations – A,B,C,D.
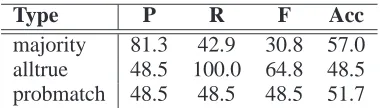
Table 2 presents three baselines for a relation.
Majority always guesses either “true” or “false”,
whichever is the majority in the test set (maximizes accuracy). Alltrue always guesses “true”
(maxi-mizes recall). Probmatch randomly guesses “true” (“false”) with the probability matching the distribu-tion of “true” (“false”) in the test dataset (balances precision and recall).
We present the results in Table 3 grouped by cat-egory, to facilitate system comparison.
1
As this paper serves also as a documentation of the data set, the order of relations in the table is the same as in the data set.
Type P R F Acc
[image:3.612.332.522.53.107.2]majority 81.3 42.9 30.8 57.0 alltrue 48.5 100.0 64.8 48.5 probmatch 48.5 48.5 48.5 51.7
Table 2: Baselines: precision, recall,F-measure and
accuracy averaged over the 7 binary classifications.
Team P R F Acc
A – WordNet = NO & Query = NO
UCD-FC 66.1 66.7 64.8 66.0 ILK 60.5 69.5 63.8 63.5 UCB† 62.7 63.0 62.7 65.4 UMELB-B 61.5 55.7 57.8 62.7 UTH 56.1 57.1 55.9 58.8 UC3M 48.2 40.3 43.1 49.9 avg±stdev 59.2±6.3 58.7±10.5 58.0±8.1 61.1±6.0
B – WordNet = YES & Query = NO
UIUC† 79.7 69.8 72.4 76.3 FBK-IRST 70.9 73.4 71.8 72.9 ILK 72.8 70.6 71.5 73.2 UCD-S1 69.9 64.6 66.8 71.4 UCD-PN 62.0 71.7 65.4 67.0 UC3M 66.7 62.8 64.3 67.2 CMU-AT 55.7 66.7 60.4 59.1 UCD-FC 66.4 58.1 60.3 63.6 UMELB-A 61.7 56.8 58.7 62.5 UVAVU 56.8 56.3 56.1 57.7 LCC-SRN 55.9 57.8 51.4 53.7 avg±stdev 65.3±7.7 64.4±6.5 63.6±6.9 65.9±7.2
C – WordNet = NO & Query = YES
UCB† 64.2 66.5 65.1 67.0 UCD-FC 66.1 66.7 64.8 66.0 UC3M 49.4 43.9 45.3 50.1 avg±stdev 59.9±9.1 59.0±13.1 58.4±11.3 61.0±9.5
D – WordNet = YES & Query = YES
UTD-HLT-CG 67.3 65.3 62.6 67.2 UCD-FC 66.4 58.1 60.3 63.6 UC3M 60.9 57.8 58.8 62.3 avg±stdev 64.9±3.5 60.4±4.2 60.6±1.9 64.4±2.5
[image:3.612.313.555.153.494.2]Systems tagged with†have a Task 4 organizer as part of the team.
Table 3: System performance grouped by category. Precision, recall, F-measure and accuracy
macro-averaged over each system’s performance on all 7 relations.
4 Discussion
System Institution Team Description System Type
UVAVU Univ. of Amsterdam TNO Science & Industry Free Univ. Amsterdam
Sophia Katrenko Willem Robert van Hage
similarity measures in WordNet; syn-tactic dependencies; lexical patterns; logical combination of attributes
B
CMU -AT Carnegie Mellon Univ. Alicia Tribble Scott E. Fahlman
WordNet; manually-built ontologies; Scone Knowledge Representation Lan-guage; semantic distance
B
ILK Tilburg University Caroline Sporleder Roser Morante Antal van den Bosch
semantic clusters based on noun simi-larity; WordNet supersenses; grammat-ical relation between entities; head of sentence; WEKA
A,B
FBK-IRST Fondazione Bruno Kessler - IRST
Claudio Giuliano Alberto Lavelli Daniele Pighin Lorenza Romano
shallow and deep syntactic information; WordNet synsets and hypernyms; ker-nel methods; SVM
B
LCC-SRN Language Computer Corp.
Adriana Badulescu named entity recognition; lexical, se-mantic, syntactic features; decision tree and semantic scattering
B
UMELB-A Univ. of Melbourne Su Kim
Timothy Baldwin
sense collocations; similarity of con-stituents; extending training and testing data using similar words
B
UMELB-B Univ. of Melbourne Su Kim
Timothy Baldwin
similarity of nearest-neighbor matching over the union of senses for the two nominals; cascaded tagging with de-creasing thresholds
A
UCB† Univ. of California at Berkeley
Preslav Nakov Marti Hearst
VSM; joining terms; KNN-1 A,C
UC3M Univ. Carlos III of Madrid Isabel Segura Bedmar Doaa Sammy Jos´e Luis Mart´ınez Fern´andez
WordNet path; syntactic features; SVM A,B,C,D
UCD-S1 Univ. College Dublin Cristina Butnariu Tony Veale
lexical-semantic categories from Word-Net; syntactic patterns from corpora, SVM
B
UCD-FC Univ. College Dublin Fintan Costello WordNet; additional noun compounds tagged corpus; Naive Bayes
A,B,C,D
UCD-PN Univ. College Dublin Paul Nulty WordNet supersenses; web-based fre-quency counts for specific joining terms; WEKA (SMO)
B
UIUC† Univ. of Illinois at Urbana Champaign
Roxana Girju Brandon Beamer Suma Bhat Brant Chee Andrew Fister Alla Rozovskaya
features based on WordNet, NomLex-PLUS, grammatical roles, lexico-syntactic patterns, semantic parses
B
UTD-HLT-CG Univ. of Texas at Dallas Cristina Nicolae Garbiel Nicolae Sanda Harabagiu
lexico-semantic features from Word-Net, VerbNet; semantic features from a PropBank parser; dependency features
D
UTH Univ. of Tokio Eiji Aramaki Takeshi Imai Kengo Miyo Kazuhiko Ohe
joining phrases; physical size for enti-ties; web-mining; SVM
A
[image:4.612.88.520.109.607.2]Systems tagged with†have a Task 4 organizer as part of the team.
Relation Team Type P R F Acc Test size Base-F Base-Acc Avg. rank
Cause-Effect UIUC B4 69.5 100.0 82.0 77.5 80 67.8 51.2 3.4
Instrument-Agency FBK-IRST B4 76.9 78.9 77.9 78.2 78 65.5 51.3 3.4
Product-Producer UCD-S1 B4 80.6 87.1 83.7 77.4 93 80.0 66.7 1.7
Origin-Entity ILK B3 70.6 66.7 68.6 72.8 81 61.5 55.6 6.0
Theme-Tool ILK B4 69.0 69.0 69.0 74.6 71 58.0 59.2 6.0
Part-Whole UC3M B4 72.4 80.8 76.4 81.9 72 53.1 63.9 4.5
[image:5.612.74.538.53.132.2]Content-Container UIUC B4 93.1 71.1 80.6 82.4 74 67.9 51.4 3.1
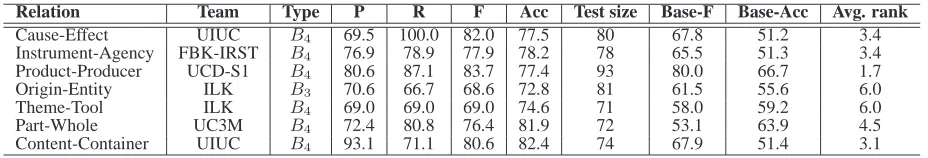
Table 5: The best results per relation. Precision, recall,F-measure and accuracy macro-averaged over each
system’s performance on all 7 relations. Base-F shows the baseline F-measure (alltrue), Base-Acc – the
baseline accuracy score (majority). The last column shows the average rank for each relation.
of 0.15 between the Acc column in Table 5 and the Agreement column in Table 1.
We performed various analyses of the results, which we summarize here in four questions. We writeXi to refer to four possible system categories
(Ai,Bi, Ci, andDi) with four possible amounts of
training data (X1 for training examples 1 to 35,X2
for 1 to 70,X3 for 1 to 105, andX4for 1 to 140).
Does more training data help?
Overall, the results suggest that more training data improves the performance. There were 17 cases in which we had results for all four possible amounts of training data. All averageF-measure differences, F(X4)–F(Xi)whereX =A toD,i =1 to 3, for
these 17 sets of results are statistically significant:
F(X4)–F(X1):N = 17, avg = 8.3, std = 5.8, min =
1.1, max = 19.6, t-value =−5.9, p-value = 0.00001.
F(X4)–F(X2):N = 17, avg = 4.0, std = 3.7, min = −3.5, max = 10.5, t-value = 4.5, p-value = 0.0002.
F(X4)–F(X3):N = 17, avg = 0.9, std = 1.7, min = −2.6, max = 4.7, t-value = 2.1, p-value = 0.03.
Does WordNet help?
The statistics show that WordNet is important, al-though the contribution varies across systems. Three teams submitted altogether 12 results both for A1– A4 andB1–B4. The averageF-measure difference,
F(Bi)–F(Ai),i=1 to 4, is significant:
F(Bi)–F(Ai): N = 12, avg = 6.1, std = 8.4, min =
−4.5, max = 21.2, t-value =−2.5, p-value = 0.01.
The results of the UCD-FC system actually went down when WordNet was used. The statistics for the remaining two teams, however, are a bit better:
F(Bi)–F(Ai): N = 8, avg = 10.4, std = 6.7, min =
−1.0, max = 21.2, t-value =−4.4, p-value = 0.002.
Does knowing the query help?
Overall, knowing the query did not seem to improve the results. Three teams submitted 12 results both
forA1–A4 andC1–C4. The averageF-measure
dif-ference,F(Ci)–F(Ai),i=1 to 4, is not significant: F(Ci)–F(Ai): N = 12, avg = 0.9, std = 1.8, min =
−2.0, max = 5.0, t-value =−1.6, p-value = 0.06.
Again, the UCD-FC system differed from the other systems in that theAandCscores were
iden-tical, but even averaging over the remaining two sys-tems and 8 cases does not show a statistically signif-icant advantage:
F(Ci)–F(Ai): N = 8, avg = 1.3, std = 2.2, min =
−2.0, max = 5.0, t-value =−1.7, p-value = 0.07.
Are some relations harder to classify?
Table 5 shows the best results for each relation in terms of precision, recall, andF-measure, per team
and system category. Column Base-F presents the baseline F-measure (alltrue), while Base-Acc the
baseline accuracy score (majority). For all seven re-lations, the best team significantly outperforms the baseline. The category of the best-scoring system in almost every case isB4(only the ILKB4system
scored second on the Origin-Entity relation). Table 5 suggests that some relations are more dif-ficult to classify than others. The best F-measure
ranges from 83.7 for Product–Producer to 68.6 for
Origin–Entity. The difference between the best F
-measure and the baseline F-measure ranges from
23.3 for Part-Whole to 3.7 for Product-Producer. The difference between the best accuracy and the baseline accuracy ranges from 31.0 for
Content-Container to 10.7 for Product-Producer.
The F column shows the best result for each rela-tion, but similar differences among the relations may be observed when all results are pooled. The Avg.
rank column computes the average rank of each
relations to classify (with average ranks of 6.0).
5 Conclusion
This paper describes a new semantic evaluation task,
Classification of Semantic Relations between Nom-inals. We have accomplished our goal of providing
a framework and a benchmark data set to allow for comparisons of methods for this task. The data in-cluded different types of information – lexical se-mantic information, context, query used – meant to facilitate the analysis of useful sources of informa-tion for determining the semantic relainforma-tion between nominals. The results that the participating systems have reported show successful approaches to this difficult task, and the advantages of using lexical se-mantic information.
The success of the task – measured in the inter-est of the community and the results of the partici-pating systems – shows that the framework and the data are useful resources. By making this collection freely accessible, we encourage further research into this domain and integration of semantic relation al-gorithms in high-end applications.
Acknowledgments
We thank Eneko Agirre, Llu´ıs M`arquez and Richard Wicentowski, the organizers of SemEval 2007, for their guidance and prompt support in all organiza-tional matters. We thank Marti Hearst for valu-able advice throughout the task description and de-bates on semantic relation definitions. We thank the anonymous reviewers for their helpful comments.
References
T. Chklovski and P. Pantel. 2004. Verbocean: Mining the web for fine-grained semantic verb relations. In Proc. Conf. on Empirical Methods in Natural Language Pro-cessing, EMNLP-04, pages 33–40, Barcelona, Spain.
R. Girju, D. Moldovan, M. Tatu, and D. Antohe. 2005. On the semantics of noun compounds. Computer Speech and Language, 19:479–496.
M. Hearst. 1992. Automatic acquisition of hyponyms from large text corpora. In Proc. 14th International Conf. on Computational Linguistics (COLING-92), pages 539–545.
M. Lapata. 2002. The disambiguation of nominaliza-tions. Computational Linguistics, 28(3):357–388.
D.D. Lewis. 1991. Evaluating text categorization. In Proceedings of the Speech and Natural Language Workshop, pages 312–318, Asilomar.
D. Moldovan, A. Badulescu, M. Tatu, D. Antohe, and R. Girju. 2004. Models for the semantic classification of noun phrases. In Proc. Computational Lexical Se-mantics Workshop at HLT-NAACL 2004, pages 60–67, Boston, MA.
P. Nakov and M. Hearst. 2006. Using verbs to char-acterize noun-noun relations. In Proc. Twelfth Inter-national Conf. in Artificial Intelligence (AIMSA-06), pages 233–244, Varna,Bulgaria.
V. Nastase and S. Szpakowicz. 2003. Exploring noun-modifier semantic relations. In Fifth Interna-tional Workshop on ComputaInterna-tional Semantics (IWCS-5), pages 285–301, Tilburg, The Netherlands.
V. Nastase, J. Sayyad-Shirabad, M. Sokolova, and S. Sz-pakowicz. 2006. Learning noun-modifier semantic relations with corpus-based and WordNet-based fea-tures. In Proc. 21st National Conf. on Artificial Intel-ligence (AAAI 2006), pages 781–787, Boston, MA.
B. Rosario and M. Hearst. 2001. Classifying the seman-tic relations in noun-compounds via domain-specific lexical hierarchy. In Proc. 2001 Conf. on Empirical Methods in Natural Language Processing (EMNLP-01), pages 82–90.
B. Rosario, M. Hearst, and C. Fillmore. 2002. The de-scent of hierarchy, and selection in relational seman-tics. In Proc. 40th Annual Meeting of the Association for Computational Linguistics (ACL-02), pages 417– 424, Philadelphia, PA.
M. Stephens, M. Palakal, S. Mukhopadhyay, and R. Raje. 2001. Detecting gene relations from MEDLINE ab-stracts. In Proc. Sixth Annual Pacific Symposium on Biocomputing, pages 483–496.
M. Tatu and D. Moldovan. 2005. A semantic approach to recognizing textual entailment. In Proc. Human Lan-guage Technology Conf. and Conf. on Empirical Meth-ods in Natural Language Processing (HLT/EMNLP 2005), pages 371–378, Vancouver, Canada.
P.D. Turney and M.L. Littman. 2005. Corpus-based learning of analogies and semantic relations. Machine Learning, 60(1-3):251–278.