1
Master thesis
‘Less is more?’: A video-based field study about patterned behavioral
interaction and team effectiveness
Matthijs Brunink
[email protected]
Master of Science Business Administration
University of Twente
Faculty of Behavioral, Management and Social Sciences
Department Change Management and Organizational Behavior
Supervisors
Prof. Dr. Celeste Wilderom
Drs. Marcella Hoogeboom
2
Abstract
This present study investigates the effect of behavioral interaction patterns of team leaders and followers on team effectiveness. At first, the focus is on the number of interaction patterns and its complexity. Secondly, the focus is on the specific behaviors displayed within the detected interaction patterns. This cross-sectional field study includes three methods: 1) inter-reliable coding of leader and follower behaviors during staff meetings; 2) surveys of 111 these same leaders and 1445 followers; 3) expert scores of each team’s level of effectiveness.
Multiple hierarchical regression analyses showed that effective teams exhibit fewer and more simple interaction patterns. The predicted moderation effect of the degree of
knowledge-intensive work was found in part. Focus on the specific nineteen behaviors within the detected interaction patterns led to the finding that transformational and transactional behavior were not significantly related with team effectiveness. However, counter-effective behavior of the leader was found significantly negative. It is concluded that the role of the follower in team performances must not be underestimated because its occurrence within interaction patterns is associated with team effectiveness. The findings of this study indicate that within patterned interaction, less is more. Practical implications, and strengths and limitations of this current study are discussed. Moreover, future research directions are proposed.
3
Table of content
Abstract ... 2
Introduction ... 5
Theoretical foundation ... 9
From social interaction to patterned interaction ... 9
Team effectiveness & team interaction ... 11
Patterned interaction ... 14
Quantity of interaction patterns ... 15
Complexity of interaction patterns ... 17
Qualitative analysis of interaction patterns ... 19
Hypothetical model ... 24
Methodology ... 26
Research design ... 26
Methods of data collection ... 26
Data analysis ... 28
Measures ... 32
Team effectiveness ... 32
Transformational, transactional and other behavioral patterns ... 32
Quantitative interaction patterns ... 32
Moderation effect ... 33
Control variables ... 33
Results ... 35
Discussion ... 38
Strengths, weaknesses and future research ... 41
Practical implications ... 43
Conclusion ... 45
4
References ... 46
Appendixes ... 59
Appendix I ... 60
Appendix II ... 64
Appendix III ... 65
Appendix IV ... 66
Appendix V ... 69
Appendix VI ... 70
Appendix VII ... 71
Appendix VIII ... 72
Appendix IX ... 73
5
Introduction
Nowadays effective performances of teams within day-to-day work can be described as pivotal to organizational performances (Zaccaro & Bader, 2003). A work team is a group of members with mutually shared responsibilities and interdependent interaction for achieving certain organizational outcomes (Cohen & Bailey, 1997). The use of work teams within organizations has increased for multiple reasons (Mohrman, Cohen, & Mohrman, 1995; Wageman, 1995; Zaccaro & Bader, 2003).
Based on previous research, social interaction and team dynamics must be considered as key in effective team functioning (DeRue & Ashford, 2010; Kozlowski & Ilgen, 2006; Stachowski, Kaplan, & Waller, 2009). Social interaction is also considered to be crucial in the leadership process (DeRue & Ashford, 2010). In addition, Fairhurst and Uhl-Bien (2012) defined leadership as “a relational process co-created by leaders and followers in context” (p.
1044). Besides the formal and hierarchical power of the leader, followers also have power in social interaction (DeRue & Ashford, 2010). Adopting the definition of Fairhurst and Uhl-Bien (2012), the traditional leadership approach, which is characterized by the focus on the persona of the leader and ignores the belief that followers could contribute in an active way, is rejected (Fairhurst & Uhl-Bien, 2012; Oc & Bashshur, 2013). Because of the informal power of team interaction, individual leader and follower behaviors are pivotal for effective team performances (Oc & Bashshur, 2013). An important aim of future research should be to get insights in these team-based behavioral dynamics.
Because it has widely been accepted that human interaction is more patterned than can be detected with the naked eye, Magnusson (1996) developed an algorithm that detects patterns of behaviors. These algorithms are called T-patterns and can be detected using
6 patterns (in this study called interaction patterns), defined as a repeating sequence of events sharing statistically significant inter-relationships within a certain critical interval
(Magnusson, 1996). Research using Magnusson’s Theme-software has successfully been applied in the study of various settings. In particular animal and sport behaviors were topic of such previous research (Casarrubea et al., 2014; Jonsson et al., 2006). Starting in the late ninety’s, Theme was also introduced in business research.
In previous business studies using Theme, the focus was on swift-starting teams in the airline industry (Zijlstra, Waller, & Phillips, 2012), or tasks that can be observed as non-routinely (e.g., crises, Stachowski et al., 2009). This research will perform a T-pattern
analysis within a routine setting in the field of management but without any simulated events. It aims to provide new practical and theoretical insights on interaction patterns within team meetings. This study will answer the question ‘what makes teams effective in their interaction patterns during their regular staff meetings?’
Examining team dynamics is not possible with traditional survey methods, hence a based analysis was employed. The team meetings analyzed for this research are video-taped during their regular meetings. Obtrusiveness was minimized by, for instance,
scheduling the meetings at the normal location and by using only small cameras during the team meetings. The video-taped team meetings were coded by using the behavioral software program called ‘The Observer XT 12’ ((Noldus, Trienes, Hendriksen, Jansen, & Jansen, 2000), hereafter The Observer). During the extensive coding process, nineteen mutually exclusive behaviors were coded by two independent trained coders.
In total ten hypotheses were developed to answer the research question. Within Theme a distinction can be made between quantitative and qualitative aspects of an interaction
pattern. The quantitative aspects focus on the number of interaction patterns and the
7 interaction patterns. Five hypotheses (H1-H5) will be focused on the quantitative variables. Four hypotheses (H6-H9) will be focused on the content of the interaction patterns. Finally, a moderation effect will be tested (H10).
This study aims to make both practical and academic contributions. At first, this study offers a view on the complete team interaction instead of only a fraction of the team
interaction (e.g., Zijlstra et al., 2012). By analyzing a complete and regular team meeting, a reliable and complete impression of its content and the day-to-day work activities will be presented (Allen & Rogelberg, 2013; Vine, Holmes, Marra, Pfeifer, & Jackson, 2008). Because meetings offer insights in the processes observable during team interaction (Fairhurst, 2007; Svennevig, 2008), meetings perfectly fit the purpose of this study.
In the second place, an analysis based on the content of interactions with Theme will offer new insights. It links pattern occurrences to the actual behavior that the team members display, a combination that was hardly not studied before. A third contribution is the new insights in to the question: ‘to what extent quantitative aspects of interaction patterns
influence team effectiveness in a day-to-day work setting?’ Also the question, ‘to what extent the developed habitual rituals and routines for dealing with frequently encountered stimuli are effective?’ (Gersick & Hackman, 1990), will be answered. The fourth and last contribution is the effective structuring of meetings. Previous research found that meetings have become more and more an integral part of contemporary working life (Rogelberg, Leach, Warr, & Burnfield, 2006; Rogelberg, Shanock, & Scott, 2011). Given that much time and money is spent on them (Leach, Rogelberg, Warr, & Burnfield, 2009; Rogelberg, Scott, & Kello, 2007) and that meetings are crucial in employee socialization, inter-relationship building and
8 understanding of team dynamics and social interaction in relation with team effectiveness within a meeting type of work setting.
9
Theoretical foundation
The theoretical foundation of this research consists of three sections. Firstly, the literature on social interaction and social influence theories will be reviewed. Secondly, team effectiveness, in light of social interaction and team dynamics, will be explained. Finally, the hypotheses will be presented in a conceptual model.
From social interaction to patterned interaction
In the previous century, the most common way of studying leadership was the leader-centric approach (Fairhurst, 2007). Within this approach, the focus is on the persona of the leader. An underlying assumption was that their interaction with co-workers (i.e., followers) was mainly top down (Kelley, 1988). Recent leader-follower interaction research focuses more on equal interactions (Meindl, 1995; Pentland, 2012). Based on the idea that followers can also contribute to organizational success and team’s leadership, the importance of the social interaction within teams stands clear. In addition, Zaccaro, Rittman, and Marks (2001) stated that leadership and team processes reciprocally influence each other. Thirdly,
Rogelberg et al. (2006) stated the importance of relationship building, especially in
combination with meeting science. Kozlowski and Ilgen (2006) found that team processes are dynamic but that repeated interactions among individuals tend to regularize, such that shared (interaction) structures and emergent states crystallize and, finally, can be used to guide subsequent interactions and relationships.
10 followers. Task interdependence refers to the degree to which team members depend on one another for their efforts, information, and resources (Van de Ven, Delbecq, & Koenig, 1976). Another example is provided by Meindl (1990), where follower processes are reviewed as social information, social construction and social contagion processes.
The intra-team relations and the collectivity, led by the leader, are subject to change over time. For example in response to the leader’s actions and behaviors but also in response to external factors or inter-follower relationships (Kozlowski, Grand, Baard, & Pearce, 2015; Kozlowski & Ilgen, 2006). Following Marks, Mathieu, and Zaccaro (2001), team processes are represented by collective constructs that raise from motivation, affect, individual cognition and behavior. Having collective constructs, therefore, is important for the development of social relations between the leader and followers. Meindl (1995) tried to examine social relationships as a function of a network in which, besides leaders, also followers are embedded. Following Meindl, Ehrlich, and Dukerich (1985), the social construction of leadership has developed to a ‘lofty’ status. As a consequence, the social construction was used often in previous literature, as a starting point for further development of the follower-oriented leadership approach (Carsten, Uhl-Bien, West, Patera, & McGregor, 2010; Kean, Haycock-Stuart, Baggaley, & Carson, 2011).
11 Building on the equal importance of leaders and followers, in the social interaction literature a two-perspective relational leadership theory was introduced (Uhl-Bien, 2006). The first perspective is an entity perspective that focuses on identifying attributes of individuals while the individual engages in interpersonal relationship. The entity perspective is a traditional orientation. The second perspective is a modernized perspective that observes leadership as a process of social construction (Uhl-Bien, 2006). Applying this perspective to leadership, the relational orientation focus is not about identifying attributes of individuals involved in leadership behavior but about social construction processes by which
understandings of leadership come about. Furthermore, social constructions which were given privileged ontology are most important in this view (Meindl, 1995; Uhl-Bien, 2006). Another influential relation-based leadership theory is the leader-member exchange (LMX, Gerstner & Day, 1997). The LMX theory is the most used relationship-based approach in the academic leadership literature (Gerstner & Day, 1997; Graen & Uhl-Bien, 1995).
The focus within the relationship-based approach is on identifying characteristics of a dyadic relationship, for instance: building trust, showing respect, and mutual obligation (Gerstner & Day, 1997). The relationship-based approach does also include the evaluation of reciprocal influence between leaders and followers (Graen & Uhl-Bien, 1995; Liden, Wayne, & Stilwell, 1993). Even though this approach gained insight in the reciprocal dyadic process between leaders and followers, insights in team dynamics in combination with team
effectiveness are still lacking in today’s theorizing.
Team effectiveness & team interaction
Although empirical evidence is scarce, scholars have pointed to the importance of team interaction to better understand team effectiveness (e.g., Kozlowski et al., 2015). However, previous literature about team effectiveness has been dominated by the IPO
12 Ilgen, 2006). IPO represents input (conditions that exist prior to a performance), processes (how team inputs are transformed into outputs and tend to bring together all of the behavioral, cognitive, and affective phenomena existing in teams), and output (results and by-products of team activity)(Ilgen, Hollenbeck, Johnson, & Jundt, 2005). In contrast, it is stated that team processes and dynamics influence leadership and vice versa (Zaccaro et al., 2001). Thus, the social interaction associated with leadership has high importance for team performance. As discussed before, the role of team processes and dynamics within team effectiveness received little attention within research. Previous literature discussed this understudied view as the bottom-up emergence (e.g., Kozlowski & Klein, 2000). Within the bottom-up emergence, the dynamic interaction processes manifest at a collective level (Kozlowski, Chao, Grand, Braun, & Kuljanin, 2013). In addition, Kozlowski and Klein (2000) argued that team processes are inherently multilevel occurrences that, shaped by team’s context, emerge bottom-up from team member interactions.
Team effectiveness is broadly defined by previous scholars. Previous research used measures like performance, member satisfaction, and shared interaction (Gibson, Cooper, & Conger, 2009; Hackman, 1987; Marks et al., 2001; Stewart & Barrick, 2000). Team
interaction received an important yet understudied role in the literature about team
13 In addition to the discussed literature, Lehmann-Willenbrock, Chiu, Lei, and Kauffeld (2016) stated that the extent to which a team’s interaction is dynamic depends on the extent to which team members are involved and build on each other’s contributions. The discussed arguments support the finding that team effectiveness is not a static property or attribute, but emerges from a series of ongoing processes and dynamics that differ and mature over time (Ilgen et al., 2005; Mathieu et al., 2008).
Marks et al. (2001) discussed a model that described the rhythmic nature of team processes in combination with team effectiveness. The rhythmic nature of team processes can be observed as a pattern over a longer period of time. Marks et al. (2001) found that teams performing different processes at different times are related to what they called performance episodes. This study also argues that between episodes, teams execute transition processes as the teams review their previous efforts and prepare for future work. As an addition, Marks et al. (2001) discussed team process as “members’ interdependent acts that convert inputs to
outcomes through cognitive, verbal, and behavioral activities directed toward organizing task
work to achieve collective goals” (p. 357).
14
Patterned interaction
Most common ways to detect patterns in interaction, are 1) lag sequential analysis and 2) Theme software (Casarrubea et al., 2015; Magnusson, 2000). The lag sequential analysis technique calculates the frequency of transition between pairs of events within a certain lag in a time series (Noldus et al., 2000). For example, Lehmann-Willenbrock, Allen, and Kauffeld (2013) performed a lag sequential analysis where the role of team interaction on meeting effectiveness was subject of research. They found that procedural meeting behaviors are sustained by supporting statements within the team interaction process and that stable interaction processes promote proactive communication and inhibit dysfunctional meeting behaviors. A second example is the study of Lehmann-Willenbrock and Allen (2014). They concluded that humor patterns triggered positive socio-emotional communication and
innovativeness towards new solutions. At the team level, humor patterns are positively related to team performance. In the appendixes a table is presented with an overview of studies using lag sequential analyses or Theme. This current study used Theme to detect patterns in team interaction.
15
Quantity of interaction patterns
The first dimension of the quantity of interaction patterns to be discussed is the number of discovered interaction patterns. The number of interaction patterns is used to characterize team interaction as highly or low patterned. Taking the example of a leader giving a task and a follower who reacts on the task, the predictability of the interaction (here described as the amount of behaviors that belongs to an interaction pattern (Magnusson, 1996)) has decreased when the follower reacts with more than a simple confirmatory answer. Previous research (e.g., Zijlstra et al., 2012) observed the lower predictability of interaction as an increase of uncertainty and a reduction of efficiency. However, this was not statistically supported.
The lower predictability can also be observed as an indication of unexpected and positive contributions of the follower since the goal accomplishment and the constructive conflict are considered to have an effect on team effectiveness (Gibson et al., 2009; Ilgen et al., 2005). In addition, Burke, Fiore, and Salas (2003) mentioned the importance of shared leadership present in more effective teams and absent in ineffective teams. Shared leadership is characterized by more team interaction where equality between the leader and followers is required (Pentland, 2012; Shamir, 2007; Uhl-Bien, 2006). More team interaction can, thus, be followed by more interaction patterns.
In contrast to this expectation, the increased team interaction can also be more spread over the team. Following the theory of Pentland (2012), effectiveness is considered to be a function of voice distribution within the team. When the team members have an equal input, team effectiveness is highest. Hence, equal voice distribution can lead to less detected
16 of effective teams is less patterned than less effective teams. Based on the findings discussed above, it is hypothesized that:
Hypothesis 1: Effective teams will exhibit significantly fewer interaction patterns during their
regular staff meetings, compared to less effective teams
Teams exhibiting more interaction patterns do not directly show more unique
interaction patterns. For example, a team can exhibit eight unique interaction patterns with an occurrence of one time per interaction pattern or a team can exhibit four unique interaction patterns with an occurrence of two times per interaction pattern. In other words, teams can score differently on the number of interaction patterns and the uniqueness of the interaction patterns.
The research of Waller (1999) studied teams in crises and non-routine events and found a significant difference between effective and less effective teams regarding variability in their interaction patterns. This means that effective teams exhibit fewer unique interaction patterns in comparison with the interaction patterns exhibited by less effective teams.
17
Hypothesis 2: Effective teams will exhibit significantly fewer unique interaction patterns
during their regular staff meetings, compared to less effective teams
Complexity of interaction patterns
The complexity of the interaction patterns can be separated in the number of switches within an interaction pattern (H3), the level of the interaction pattern (H4), and the length of an interaction pattern (H5). The level represents the number hierarchical levels showed in an interaction pattern while the number of switches represents the amount of switches between the subjects (in this study: the leader and the followers) within an interaction pattern. The length is the number of behaviors displayed in a detected interaction pattern.
The first component to be discussed is the number of switches. Salas, Cooke, and Rosen (2008) stated that team members have to coordinate their cognition, affects and
behaviors. In order to coordinate the group’s behavior, it can be argued that followers and the leader will interact more with each other than less effective teams (Kozlowski et al., 2015; Pentland, 2012; Salas et al., 2008). The number of switches between followers and the leader, therefore, seems to be a good predictor for the intensity of interaction showed by the team members. For teams with a low number of switches, the leader will probably behave more common with the traditional leadership approach. The traditional leadership approach, in fact, adopts the follower as docile and passive (Carsten et al., 2010). In contrast with teams
showing a higher number of switches, it can be expected that the social interaction between the leader and the followers is on a more equal level. According to some scholars, having an active social interaction with your followers, can have impact on team effectiveness (Meindl, 1995; Meindl et al., 1985; Pentland, 2012). Hence, it is hypothesized that:
Hypothesis 3: Effective teams will exhibit significantly more switches in their interaction
18 The second component of complexity within interaction patterns is the level of the interaction pattern (the number hierarchical levels showed in an interaction pattern, H4). Gersick (1989) pointed out that groups exhibiting an increased level of activity during their work, tended to achieve better overall outcomes than groups not exhibiting this behavior. Building on this assumption, Stachowski et al. (2009) analyzed teams during simulated crises and hypothesized that higher performing teams demonstrated interaction patterns
characterized by a higher level of complexity. However, this research did not find a
significant relation between the variables. Therefore, Stachowski et al. (2009) concluded that less standardized responses are effective and that team training should emphasized this flexibility. In line with Stachowski et al. (2009), it is stated that higher performing teams followed occurrences with the interaction concerning task prioritization and resource
allocation (Waller, 1999). In addition, Waller (1999) found that effective teams did this more quickly than less effective teams. Building on the discussed findings, the interaction of
effective teams is considered to be more stable (James & Wooten, 2010; Zellmer-Bruhn et al., 2004; Zijlstra et al., 2012) but less regulated (Stachowski et al., 2009). Hence, the effective teams are expected to show less complex behavioral interactions. Therefore, it can be hypothesized that:
Hypothesis 4: Effective teams will exhibit significantly simpler (lower-leveled) interaction
patterns during their regular staff meetings, compared to less effective teams
The fifth hypothesis will cover the length of the interaction pattern. LePine (2003) observed a positive relation between role structure adaptation and team decision-making accuracy. This finding is consistent with the idea that increased flexibility is functional (Ilgen et al., 2005). Additional support was provided by the adaptation of follower-oriented
19 case, a follower receives power while the leader loses power at a certain point in time. Hence, it is suggested that effective teams perform greater flexibility by showing less and more simple interaction patterns. Based on previous literature and the same consideration as discussed above, it is hypothesized:
Hypothesis 5: Effective teams will exhibit significantly shorter interaction patterns during
their regular staff meetings, compared to less effective teams
Qualitative analysis of interaction patterns
Qualitative analysis performed with Theme will focus on the content of the interaction patterns. Every interaction pattern is built upon multiple behaviors. By focusing not only on the quantitative aspects related to team effectiveness but also on the content of the interaction patterns, a conclusion can be drawn about the effectiveness of certain behaviors within
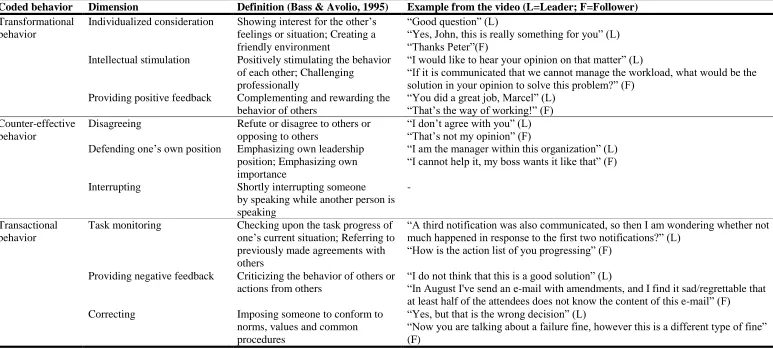
interaction patterns. Because taking the nineteen coded behaviors separately would lead to too precise and fewer detected patterns, the behaviors were clustered in five clusters (transactional behavior, transformational behavior, initiating structure, counter-effective behavior and
humor) underpinned by academic literature. Firstly, transactional behavior will be discussed. Previous research focused on the question if performing transactional or
20 for problems caused by the follower before taking any action (Bass, 1999). Following the items which represent these behavioral categories in the MLQ, transactional behavior is considered to consist of: task monitoring; providing negative feedback; and correcting (Bass & Avolio, 1995).
In previous empirical work, some research was performed on the linkage between transactional behavior and team performances (Burke et al., 2006; Pearce & Sims Jr., 2002). It is stated that transactional behavior influence team effectiveness through the impact on effort. Transactional leadership creates a close relation between organizational goals and (individual) rewards. According to Burke et al. (2006), transactional behavior may lead to employees which are motivated to exert an extra effort in their tasks. Thus, it can be stated that transactional behavior can encourage team effectiveness by its effect on team member’s motivation. However, Jung and Avolio (2000) stated that employee’s motivation can be decreased by the focus on current organizational goals instead of the focus on personal
development (as observed by transformational behavior). In addition, previous research found that a potential trap can be social loafing (Erez, LePine, & Elms, 2002). The problem within social loafing is the moment when single team members put more effort in completing their own tasks than the shared team tasks (Karau & Williams, 1993). To reach a higher level of team effectiveness, less social loafing is desired. Finally, transactional behavior is expected to have a negative effect on creativity coming from team members (Bryant, 2003). According to the discussed literature, it is hypothesized:
Hypothesis 6: Effective teams will exhibit significantly fewer interaction patterns containing
transactional behavior, compared to less effective teams
The second clustered group of behaviors is transformational behavior.
21 follower’s level of ideals and its concerns for achievement of goals, well-being of others and the organization (Bass, 1999). Following Bass (1985), transformational behaviors could have large psychological impact on followers and also have more effect than the effect caused by quid-pro-quo transactional leadership. Transformational behavior shapes confidence, encourages team members to raise questions and coaches team members to develop their capabilities (Burns, 1978). Transformational behavior is considered to consist of the following behaviors: providing positive feedback; intellectual stimulation; and individualized
consideration (Bass & Avolio, 1995).
According to Bass and Avolio (1990, 1995), leaders who are more transformational and less transactional in their behavior are more satisfying to their followers and more effective than leaders showing more transactional behavior. Previous research found that transformational behavior is more effective than transactional behavior (Bass, 1999; Bass & Avolio, 1995). Also, transformational behavior is expected to let team members intellectually stimulate each other; inspire each other; and let team members identify themselves with common goals (Bass, 1991, 1999). Hence, the next hypothesis is as follows:
Hypothesis 7: Effective teams will exhibit significantly more interaction patterns containing
transformational behavior, compared to less effective teams
Besides showing transactional or transformational behavior, effective leadership does also require actions like influencing the transformation process; ensuring organizational adaption; and sharing visions (Fleishman et al., 1991). In the previous literature, this is called initiating structure (IS, Hoogeboom & Wilderom, 2015; Judge & Piccolo, 2004). In this research, the following three behaviors are defined as initiating structure: structuring the meeting; informing; and directing.
22 leadership, therefore this behavior was too important to disregard. According to Avolio et al. (1999), humor can create a more amiable atmosphere within transformational leadership. However, humor is not directly related to one of the previously clustered behaviors (Avolio et al., 1999).
The fifth group is counter-effective behavior. Counter-effective behavior can be observed as systematic behavior performed by a person with the goal to violate the legitimate interest of the organization by undermining the goals, tasks or effectiveness (Einarsen, Aasland, & Skogstad, 2007). The coded behaviors are: disagreeing; interrupting; and defending one’s own position.
Counter effective behavior, thus, must be observed as negative energy performed by one of the team members. Einarsen et al. (2007) observed that counter-effective behavior contributes to less team effectiveness. Also Aubé and Rousseau (2014) concluded that counterproductive behaviors are negatively related to the team performances. They indicated that counterproductive behaviors within teams shape a collective phenomenon which affect not only team members, but also the functioning and effectiveness of the complete team. Because the leader’s behavior is a proximal predictor of team effectiveness (DeRue, Nahrgang, Wellman, & Humphrey, 2011), interaction patterns containing leader’s counter-effective behavior are key in the next hypothesis:
Hypothesis 8: Effective teams will exhibit significantly less interaction patterns containing
counter-effective behavior performed by the leader, compared to less effective teams
23 between leaders and followers is primarily a constructed relation influenced by inter-follower relationships. In addition, Pentland (2012) argued that a distribution of voice over team members has a positive on team performances. Based on the literature discussed, it may be stated that the participation of followers within team interaction is an important factor for team effectiveness.
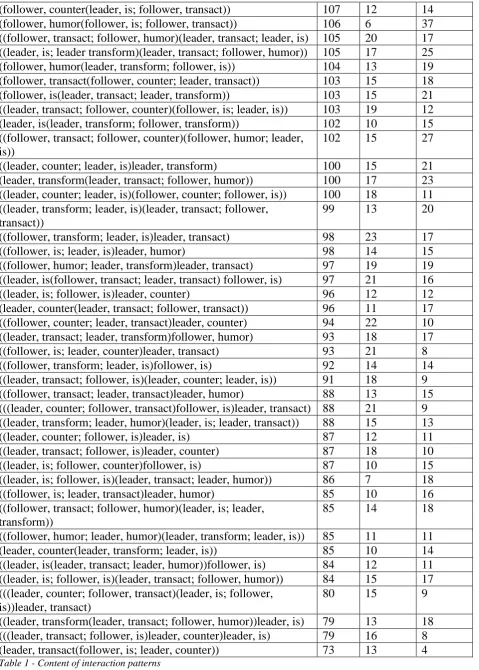
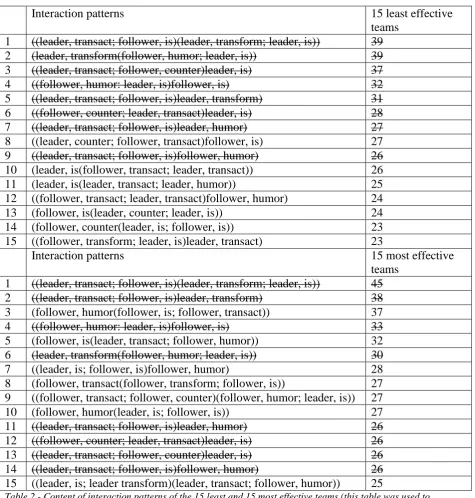
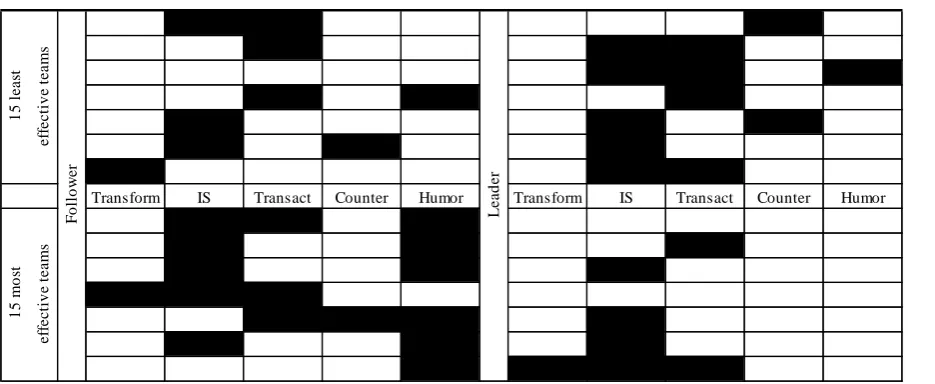
Within this study, the participation of followers in team interaction is measured by the occurrence of a follower behavior within an interaction pattern. Table 1 presents interaction patterns that occur in at least 50 percent of the teams. In addition, a distinction was made between the fifteen most and the fifteen least effective teams and the interaction patterns detected within these teams (see Table 2). In order to examine a difference between follower participation within effective teams and less effective teams, the next hypothesis has been stated:
Hypothesis 9: Effective teams display more follower behavior within their interaction
patterns, compared to less effective teams
The final hypothesis of this study aims to find a moderation effect for the negative hypothesized quantitative variables (H1, H2, H4 and H5). The moderating role of work type was already point of attention in previous research (e.g., LePine, Piccolo, Jackson, Mathieu, & Saul, 2008; Steward & Barrick, 2000). In general, previous scholars argued that a
distinction can be made between teams that fulfill their work based on knowledge-intensive work and teams that do not (e.g., Janz, Colquitt & Noe, 1997). In addition, Cross and Cummings (2004) argued that knowledge-intensive work is associated with both networks and social ties.
In accordance to the social network theory, spanning social divides are associated with performance-related outcomes (Cross & Cummings, 2004). It can be concluded that
24 are associated with team performances (e.g., Cross & Cummings, 2004). Based on the social interaction theories (as discussed before), it could be argued that the negative relation between quantitative variables (H1-H5) and team effectiveness could become positive when the work of the team is knowledge-intensive.
In addition, LePine et al. (2008) argued that teamwork processes have a positive relationship with team performances. The results of their moderator analyses suggested that relationships among teamwork processes and team performance are dependent on task interdependence (LePine et al., 2008). Task interdependence is described as the degree to which team members depend on one another for their efforts, information, and resources (Van de Ven et al., 1976). De Dreu (2007) argued that a collective outcome interdependence is related to higher team effectiveness. Finally, Vandenberg, Richardson, and Eastman (1999) found that work which requires more information and knowledge, will lead to higher team performances. The expected negative relation between the quantitative variables and team effectiveness, may be positively influenced by knowledge-intensive work and, thus, task interdependence.
Within the public organization analyzed for this study, two types of work can be distinguished: procedural-oriented work and knowledge-oriented work. Based on the articles discussed, the knowledge-oriented work type is hypothesized to positively moderate the relation between team effectiveness and quantitative aspects of an interaction pattern. Hence, it is suggested that:
Hypothesis 10: The degree of knowledge intensiveness of a team positively moderates the
relation between a team’s effectiveness and patterned interaction
Hypothetical model
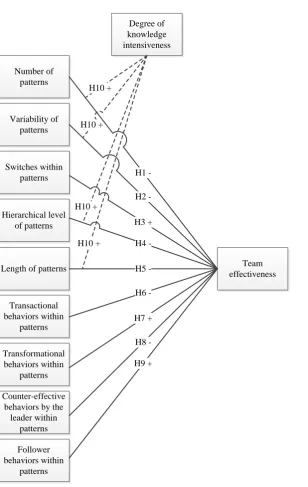
25 H10 + Number of patterns Variability of patterns Switches within patterns Hierarchical level of patterns
Length of patterns
Transactional behaviors within patterns Transformational behaviors within patterns Counter-effective behaviors by the
[image:25.595.74.383.59.547.2]leader within patterns Degree of knowledge intensiveness Team effectiveness H2 -H3 + H4 H8 -H7 + H6 H5 -H10 + H10 + H10 + H1 -Follower behaviors within patterns H9 +
26
Methodology
Research design
This study has a cross-sectional design. Such a design is suitable when the data is selected at a single point in time (Gerring, 2001). The context of this study is a large Dutch public-sector organization. It consists of three divisions. With help of a random stratified sample, a similar proportional amount of teams from every division was selected. For this reason, the results might be generalizable over the complete organization. Besides scientific purposes of the collected data, the leaders received a feedback report. This report offers the opportunity to improve one’s leadership skills, based on the context-specific study. In this study three different data sources are used. Each of them will be discussed in the next section. By focusing on regular scheduled team meetings, a reliable representation of the day-to-day work behaviors and interactions including leadership behavior was assessed (Uhl-Bien, 2006; Vine et al., 2008).
Methods of data collection
We captured, with a video-recording device, follower and leader behaviors during regularly scheduled staff meetings. In total 111 teams (N = 111) were recorded and coded, with a total of 111 leaders, 1445 followers and 9205 minutes of recorded staff meetings. In total 51518 leader behaviors were coded with an average of 464 behaviors per meeting (S.D. = 219), followers showed in total 75990 behaviors with an average of 685 (S.D. = 426) per meeting.
27 distributed as follows: 38.7% of them has a Bachelor’s degree from a university of applied sciences, 37.8% a Master degree, 1.8% have PhD level, 1.8% obtained a Bachelor degree at an university, 15.3% was lower educated and 4.5% did not complete this question.
The followers’ demographics are as follows: 832 (57.6%) of them are male, 474 (32.8%) are female and 139 (9.6%) did not answer this question. The average age is 49.0 (S.D. = 10.7). The followers worked on average for 23.9 years (S.D. = 13.8) within the organization and for 3.9 (S.D. = 5.1) within their team. Finally the educational level: 43.1% was educated at a lower level, 26.5% got a Bachelor degree on an university of applied sciences, 1.5% completed a Bachelor degree at an university, 14.7% obtained a Master’s degree, 1.4% has a PhD level and 12.9% did not complete this survey question.
Coding is processed by the software program called The Observer (Noldus et al., 2000). This software program was mainly developed for the recording of behavioral data in a structural way. For coding the recorded staff meetings, an extensive codebook was developed and tested (Van der Weide, 2007). In total nineteen mutually exclusive behaviors were examined, an overview of the coded behaviors can be found in one of the appendixes. Coders were all university-level students (Bachelor or Master degrees) with a background in business administration, communication science or psychology.
In order to secure the reliability of the coding work, every recorded staff meeting was coded twice. By using the same codebook and a discussion about the disagreements
afterwards, a minimum reliability level of 90 percent was required (a two seconds time interval was allowed for agreement). In practice the coded videos had a Kappa of 98%.
28 Likert scale (where 1 represents strongly disagree and 7 strongly agree, questions are
attached in the appendixes).
The second data source is an extensive survey. Every team that was recorded, was asked to complete a survey at an individual level. In total the survey contains 149 questions. Most of the questions were related to team effectiveness, work values, team characteristics and demographic details. Survey results were progressed with help from SPSS.
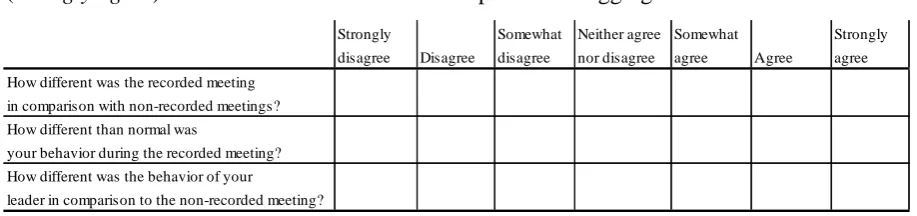
The third data source are the expert scores. The hierarchical leader of the team’s leader was asked to complete a survey containing four questions about the relative effectiveness of the team. This survey was completed by the hierarchical leader of the team’s leader in order to rule out common-source bias. The answers were given on a scale from one (very ineffective) to ten (very effective) and were based on the study of Gibson et al. (2009). The questions are attached in the appendixes.
By using multiple data sources, the validity of this research is improved and common-source bias in this study is ruled out (Podsakoff, MacKenzie, Lee, & Podsakoff, 2003). In data collection process, the followers were all given a number. This to improve follower’s
perception of confidential treatment of the data and also to make sure the survey of the follower corresponds with the coded behavior of that follower in The Observer.
Data analysis
Within this research, three data sources were used. Also the analysis were performed in three steps. First of all, the behaviors of leaders and followers were coded in The Observer. The output of The Observer forms the input for the second step in analyzing by using Theme 5.0 (Magnusson, 1996, 2000; hereafter Theme).
29 events in behavior are taken into account but also the hierarchical structure of behavioral events. Magnusson (2000) presented Theme as an unique algorithm that searches for
relationships between events in behavioral data; the exact method of pattern detection used by Theme can be found in Appendixes.
Theme was used here to detect behavioral interaction patterns within each team. In order to ensure that the detected interaction patterns are valuable for research, some search criteria must be set. This study used the following search criteria: the significance level is 0.005 and the minimal number of pattern occurrences is three. This is the minimum number of occurrences an interaction pattern must have within one meeting before it is part of the
statistical analysis. The last search criteria is the hierarchical level. An one-level interaction pattern is represented by only two behaviors (see Figure 2). In order to overcome an
enormous amount of meaningless lower-leveled interaction patterns, the minimal hierarchical level is two.
Figure 2 - An one-level interaction pattern
30
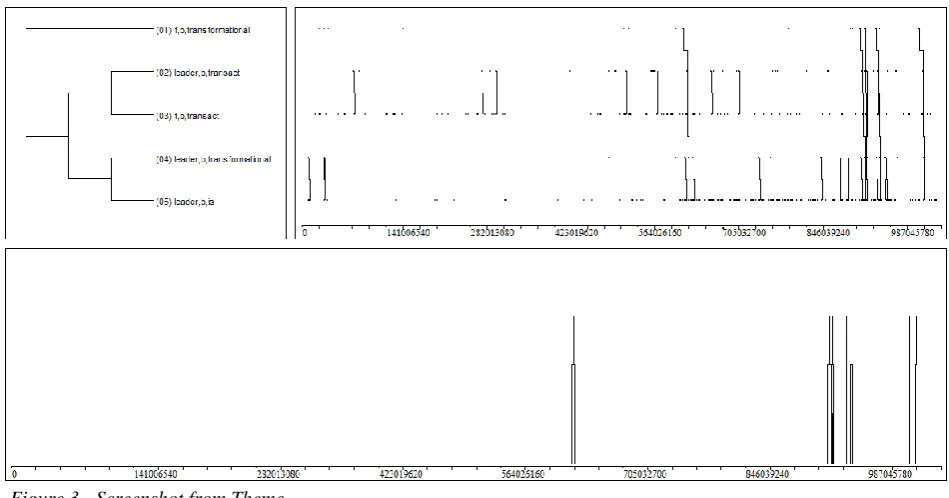
Figure 3 - Screenshot from Theme
Above a screenshot is copied from Theme (Figure 3), consisting of three parts. In the upper small left box, the detected interaction pattern is presented. In the lower box, the occurrences of one interaction pattern is presented on a time scale (in seconds). In this case the interaction pattern is most detected in the final phase of the meeting. Finally, the upper right box presents the pattern occurrences. However, when only a fraction of the interaction pattern is exhibited, this is represented by shorter lines. Thus besides the occurrence of the complete interaction pattern, also fractions of the same interaction patterns were detected.
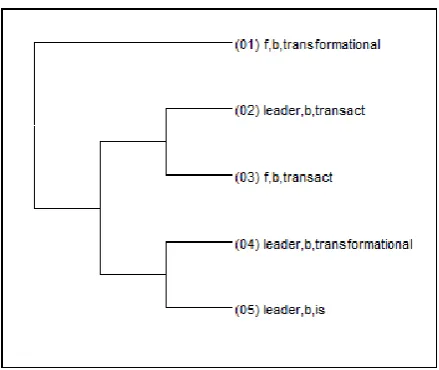
In the next example (see Figure 4 below), an interaction pattern is displayed. The length of this interaction pattern is five (represented by the numbers between the brackets) and the level of this interaction pattern is three. Level one is presented by the connection between behavior two and three or four and five. Level two is represented by the connection between these four behaviors. The third level is the connection with first behavior
31
Figure 4 - An example of an interaction pattern (F represents Follower, Transformational represents
Transformational behavior, Transact represent Transactional behavior, IS represents Initiating Structure and B represents the beginning of a behavior)
Due to the input restrictions of Theme, it was not possible to perform the qualitative analysis (H6-H8) with 111 teams. Therefore, the sample size for these hypotheses is 98 teams (N = 98). The third and final step is analyzing the survey data and the staff’s behaviors. The data is analyzed by introducing a mathematical formula in order to secure a normal
distribution for the data. The new value is represented by matching a percentile with the standardized outcome. The mean is considered to be zero and the standard deviation is
expected to be one (Field, 2013). This formula computes the inverse of the cumulative normal distribution. For the data analysis, a multiple hierarchical regression analysis has been
performed. Additional statistics can be found in the appendixes.
32
Measures
Team effectiveness
First variable to be discussed is team effectiveness. In order to ensure an accurate measure of variables used, only those questions that have previously been used in the
literature and are considered as reliable were included. Team effectiveness was measured via the four-item scale developed by Gibson et al. (2009). In this research, a maximum of three hierarchical leaders of the team’s leader were asked to rate the effectiveness of the team. The mean of the hierarchical leaders was taken as the indicator for team effectiveness. The reason why the expert rates were selected for measuring team effectiveness is because of ruling out the common source bias and the additional finding that data coming from multiple sources makes the findings more reliable (Podsakoff et al., 2003). The question can be found in the appendixes.
Transformational, transactional and other behavioral patterns
The qualitative pattern analysis resulted in a total of 76 unique interaction patterns. By counting the occurrence of a specific behavior within patterned interaction, an overview of frequent patterned behaviors has been showed. By selecting only the interaction patterns that occur in 50 percent of the teams, a reliable sample of patterns is selected. The number of interaction patterns containing group’s transformational behavior, transactional behavior and leader’s counter-effective behavior has been used for analysis in this study as well as the behavior of followers within interaction patterns.
Quantitative interaction patterns
33 organizational science. This because Theme offers a method different from, for instance, Markov chains or lag sequential analysis (Magnusson, 2000). Variables were used to get insights in the complexity, number and variability of interaction patterns (Casarrubea et al., 2015; Casarrubea et al., 2014).
Moderation effect
The moderation effect of this research is expected to be caused by the degree of
knowledge intensiveness of the team’s work. Within the public organization, a distinction was made between procedural- and knowledge-oriented work. The project leader was responsible for the collection of the data regarding the distinction between procedural and knowledge work of the team.
Control variables
To make sure that the proposed outcomes can be attributed to the measured variables, some control variables are included. First of all, team tenure is included as control variable. Some previous scholars argued that teams that work together for a longer time, reach a higher level of team effectiveness (Cohen & Bailey, 1997; Schippers, Den Hartog, Koopman, & Wienk, 2003) or developed more regular stimuli, behaviors, attitudes or patterns (Gersick & Hackman, 1990). Secondly, the average age of the team members was included as a control variable for their potential impact on team effectiveness. The third control variable is gender. The reason that gender and age were selected as control variable is because previous scholars argued that differences in behavior may exist between generational and gender groups
(LePine, Hollenbeck, Ilgen, Colquitt, & Ellis, 2002; Van der Vegt & Janssen, 2003).
35
Results
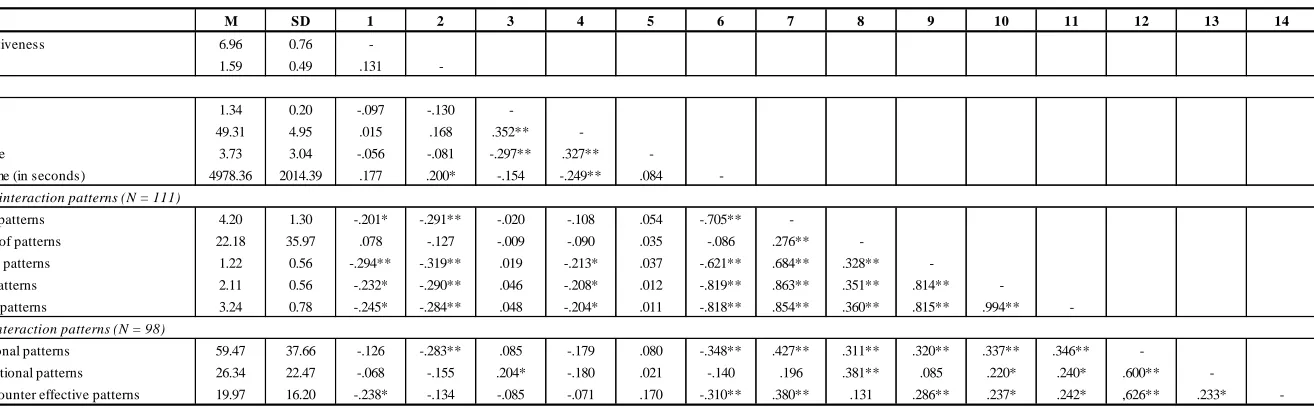
Table 7, which can be found in the appendixes, presents the means, standard deviations and bivariate correlations between the most important variables of this study. In line with the regression analyses, the relation between the number of interaction patterns (r =-.201, p<.05), switches within interaction patterns (r=-.294, p<.01), the length of interaction patterns (r=-.245, p<.05), and team effectiveness turned out to be negatively supported. The level of interaction patterns (r=-.232, p<.05) turned out to be negative while the regression analysis showed a positive relation. No support was found for the variability of interaction patterns (r=.078, p>.05), transformational behavior and transactional behavior within interaction patterns (r=-.068, p>.05; r=-.126, p>.05, respectively). Finally, counter-effective behavior performed by the leader was found negative (r=-.238, p<.05) and significant.
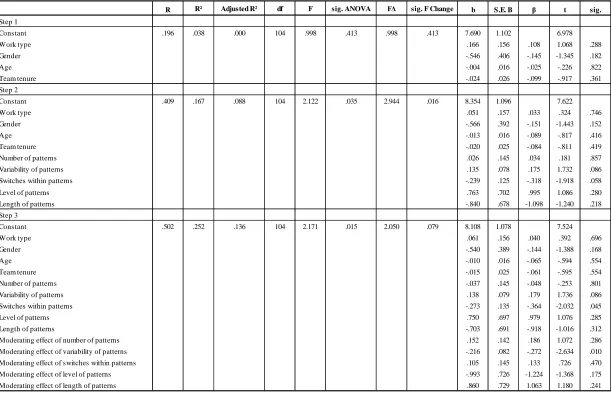
36 between team effectiveness and the level of an interaction pattern was hypothesized. This negative relation was not found (ß=.979, p>.05). The last hypothesis about quantitative aspects is the negatively hypothesized relation between the length of an interaction pattern and team effectiveness. This relation, indeed, seems to be negative but not significantly supported (ß=-.918, p>.05).
The final part of the first model is the moderation effect (H10, see Table 8). For the number of interaction patterns, the positive relation was found (ß=.186, p>.05, see Figure 6) but not significantly supported. The moderation effect for the variability of interaction patterns was found negative significantly supported (ß=-.272, p<.05, see Figure 7). The third moderation effect, the switches within an interaction pattern, was found positively but not supported (ß=.133, p>.05). The level of an interaction pattern was already found positively. Although the level of an interaction patterns was negatively moderated by the work type (ß =-1.224, p>.05). Finally, the moderation effect of the length of an interaction pattern was positive. However, no significant support was found (ß=1.063, p>.05).
The second model focused on the content of the interaction patterns (H6-H8). A ANOVA was found (F(97)=1.878, p>.05) with an explained variance of .110. A full overview of the regression results can be found in Table 9. The occurrence of transactional behavior within an interaction pattern was expected to be negative related to team effectiveness. This predicted relation, however, turned out to be positive but not significant (ß=.080, p>.05). In contrast, the occurrence of transformational behavior within an interaction pattern was expected to be positively related to team effectiveness. However, the results presented a negative and not significant relation (ß=-.288, p>.05). In accordance with the occurrence of transactional behavior within an interaction pattern, also this hypothesis must be rejected. The eighth hypothesis discussed the negative relation between team effectiveness and the
37 accordance with the theoretical foundation, this relation was found negative and significantly supported (ß=-.328, p<0.05).
Hypothesis 9 was tested by performing an independent sample T-test. A significant difference was found for the occurrence of followers within interaction patterns for effective teams (Mean = 2.29, S.D. = .76) and less effective teams (Mean = 1.29, S.D. = .76),
38
Discussion
The main objective of this study was to gain a detailed understanding of how effective teams structure their interaction in a day-to-day work setting. In general, it can be stated that ‘less is more’. Based on the results presented in the previous chapter, it is advised to use less complex, more diverse and fewer interaction patterns. Also interaction patterns performed by the followers are considered to be more effective.
The method selected to carry out this study is a relatively unique one. In the first place, fine-grained analyses of video-based leader and follower behaviors captured during 111 regular scheduled staff meetings were used. Secondly, the observed behaviors were analyzed with the unique algorithm called Theme. Results from T-pattern analyses are key for this study. The first set of hypotheses focused on team effectiveness in relation with quantitative variables (e.g., the number and the level of the interaction patterns).
Firstly, our regression results showed that the number of interaction patterns and the length of interaction patterns were negatively related to team effectiveness. Unexpected was the positive relation of the variability of interaction patterns. Hence it is concluded that although a negative relation between the number of interaction patterns and team
effectiveness, more unique interaction patterns contribute to team effectiveness. It may be the case that more uniqueness of the interaction patterns is caused by the routine setting of this study. Previous research focused on crises situations or simulations where fast, urgent and ad-hoc decisions in unknown situations were studied (e.g., Zijlstra et al., 2012; Waller, 1999).
Previous scholars (e.g., Janz et al., 1997) already found support for a distinction between knowledge and non-knowledge-intensive work. Also differences between routine and non-routine work has been observed in previous research (e.g., Stachowski et al., 2009). In order to test the influence of work type on patterned interaction, this study tested a
knowledge-39 intensive work between team effectiveness and the quantitative aspects of patterned
interaction.
The expected moderation effect had a positive effect on the number of interaction patterns, the length of interaction patterns, and the number of switches within interaction patterns. Even though this effect was not significant. However, a negative relation was found for the level of interaction patterns and the variability of interaction patterns. For this reason, it is expected that effective knowledge-intensive teams are more beneficial by less complex and more stable interaction patterns.
Another potential reason to explain the uniqueness of interaction patterns is the relation to the switches within interaction patterns (r=.328, p<.01). Based on this strong relation, it can be assumed that interaction patterns performed by the leader or the follower (i.e., an interaction pattern without switches) are more effective than an interaction pattern consisting of social interaction with team members. Interaction patterns displayed by one subject are expected to be more unique, since both variables are strongly inter-related and supported by the results of hypothesis 9. Here the occurrence of follower behavior (and thus an interaction pattern completely performed by the follower) is positively related to team effectiveness.
40 (e.g., Zellmer-Bruhn et al., 2004). Hence, higher-leveled interaction can be observed as a habitual developed routine for effective teams.
Besides to the quantitative aspects, the focus within this study was also on the content of the interaction patterns. The hypotheses about both transformational and transactional displayed behavior were not significantly supported and offered no renewed insights in literature. Nevertheless, counter-effective behavior performed by the leader is considered to be a proximal indicator for team effectiveness.
As proposed in the theoretical foundation, the linkage between social interaction and team effectiveness was observed as positive in previous research (Pentland, 2012; Uhl-Bien, 2006). This study showed that follower contributions to team interactions are more effective than contributions of the leader. In addition, by analyzing the fifteen most detected interaction patterns (Table 2), it can be concluded that most of the interaction patterns are performed by both effective and less effective teams. Seven interaction patterns were observed to be
41
Strengths, weaknesses and future research
Strength is the combination of both quantitative and qualitative analysis by using Theme. Also previous research focused on the early interaction (Zijlstra et al., 2012), simulated data (Waller, 1999), crises (Stachowski et al., 2009), or sports (Jonsson et al., 2006), the focus on routinely and complete team interactions remained unstudied. In addition, this study used a relatively large and reliable sample (N = 111).
Although the method of this study was designed with caution, some methodological weaknesses can be mentioned. An example is the weakness that teams were analyzed at one point in time. Therefore it is impossible to perform an analysis about the causal links between the different variables. For this reason, it would be valuable to perform a comparable study with measurement of multiple similar meetings over the same teams. Secondly, Theme
analyses were performed with two subjects (leader and follower). As already discussed, this to overcome the detection of fewer and meaningless interaction patterns. However, this choice did not offer the possibility to perform an analysis on team member level.
Each of the 111 teams in this study is part of a large Dutch public organization. Previous scholars found differences between private- and public-sector organizational contexts. Especially the differences related to the behavior showed by the leader were examined by previous research (e.g., Andersen, 2010). Therefore, it might be questioned to what extent the findings of this study are generalizable to private organizations. A public organization, often in combination with many hierarchical levels, can offer more clear insights about effective leaders since factors like rotating leadership and equal voice
42 for further research.
43
Practical implications
The focus on team interaction in combination with team effectiveness is important because of the growing number of work teams within organizations (e.g., Zaccaro & Bader, 2003). As a consequence, also the number of organizational staff meetings has increased and meetings became an integral part of working life (e.g., Rogelberg et al., 2006). Together with the increasing number of organizational staff meetings, meeting costs are growing. Especially when meetings are not structured effectively. This study added new insights about effective patterned interaction, valuable insights that can be used for training as well as for
organizational purposes (i.e., improving effective interaction and behaviors).
Effective patterned interaction, as found by this study, can be a basis for change of behavioral habits of managers. An example is the negative relation between the length of interaction patterns and team effectiveness. For instance, providing a more detailed and strict agenda offers less room for improvisation or ambiguity and, thus, potentially shorter
interaction patterns.
Because the role of the follower in social interaction has been observed as important, the focus must be not primary on the leader but also on the follower. Understanding them is as important as understanding leaders (Howell & Shamir, 2005). For decades, previous literature accepted the believe that team effectiveness is especially influenced by the leader. However, the role of the follower within the social interaction is found to be important. Therefore, the key to organizational success is to focus especially on the follower and by taking into account the development of the follower besides the multiple leader development programs.
45
Conclusion
This paper offers new insights into the management literature by offering new insights in the effective structure of regular scheduled staff meetings within a large Dutch public organization. It was demonstrated that effective teams exhibit shorter and more simple interaction patterns while focusing on the content of an interaction patterns offers a new way of analyzing. Support was found for the role of counter-effective behavior in combination with team effectiveness. This is a contribution that might be important for further research. Finally, also a moderating effect caused by the team’s work type was found.
The majority of the leadership literature focuses on the leader, this study found that the followers in a team play an important role in team interaction and performances. For this reason, followers cannot be longer ignored in leadership studies. Thus, the statistical evidence reported in this paper and the relatively distinctive methodology, offers multiple opportunities for further research on the dynamic interactions and behavioral patterns, and their effects of both leaders and followers. Finally, from an academic point of view, the method performed could be introduced in multiple (behavioral) disciplines and in various settings and preferably in a private organizational setting in order to test the generalizability of the results reported herein.
Acknowledgements
46
References
Allen, J. A., & Rogelberg, S. G. (2013). Manager-led group meetings: A context for promoting employee engagement. Group & Organization Management, 38(5), 543-569. doi:10.1177/1059601113503040
Andersen, J. A. (2010). Public versus private managers: How public and private managers differ in leadership behavior. Public Administration Review, 70(1), 131-141. doi:10.1111/j.1540-6210.2009.02117.x
Aubé, C., & Rousseau, V. (2014). Counterproductive behaviors: Group phenomena with team-level consequences. Team Performance Management, 20(5/6), 202-220. doi:10.1108/tpm-05-2013-0014
Avolio, B. J., Howell, J. M., & Sosik, J. J. (1999). A funny thing happened on the way to the bottem line: Humor as a moderator of leadership style effects. Academy of
Management Journal, 42(2), 219-227. doi:10.2307/257094
Bass, B. M. (1985). Leadership and performance beyond expectations. New York: The Free Press.
Bass, B. M. (1991). From transactional to transformational leadership: Learning to share the vision. Organizational Dynamics, 18(3), 19-31. doi:10.1016/0090-2616(90)90061-s
Bass, B. M. (1999). Two decades of research and development in transformational leadership.
European Journal of Work and Organizational Psychology, 8(1), 9-32. doi:10.1080/135943299398410
Bass, B. M., & Avolio, B. J. (1990). Transformational leadership development: Manual for the multifactor leadership questionnaire. Sunnyvale, CA: Consulting Psychologists Press.
47 Bell, B. S., & Kozlowski, S. W. J. (2002). A typology of virtual teams implications for
effective leadership. Group & Organization Management, 27(1), 14-49. doi:10.1177/1059601102027001003
Bryant, S. E. (2003). The role of transformational and transactional leadership in creating, sharing and exploiting organizational knowledge. Journal of Leadership &
Organizational Studies, 9(4), 32-44. doi:10.1177/107179190300900403
Burke, C. S., Fiore, S. M., & Salas, E. (2003). The role of shared cognition in enabling shared leadership and adaptability. In C. L. Pearce & J. A. Conger (Eds.), Shared leadership: Reframing the hows and whys of leadership (pp. 103-122). Thousand Oaks, CA: Sage.
Burke, C. S., Stagl, K. C., Klein, C., Goodwin, G. F., Salas, E., & Halpin, S. M. (2006). What type of leadership behaviors are functional in teams? A meta-analysis. The Leadership Quarterly, 17(3), 288-307. doi:10.1016/j.leaqua.2006.02.007
Burns, J. M. (1978). Leadership. New York: Harper & Row.
Carsten, M. K., Uhl-Bien, M., West, B. J., Patera, J. L., & McGregor, R. (2010). Exploring social constructions of followership: A qualitative study. The Leadership Quarterly, 21(3), 543-562. doi:10.1016/j.leaqua.2010.03.015
Casarrubea, M., Jonsson, G. K., Faulisi, F., Sorbera, F., Di Giovanni, G., Benigno, A., . . . Magnusson, M. S. (2015). T-pattern analysis for the study of temporal structure of animal and human behavior: A comprehensive review. Journal of Neuroscience Methods, 239, 34-46. doi:10.1016/j.jneumeth.2014.09.024
Casarrubea, M., Magnusson, M. S., Roy, V., Arabo, A., Sorbera, F., Santangelo, A., . . . Crescimanno, G. (2014). Multivariate temporal pattern analysis applied to the study of rat behavior in the elevated plus maze: Methodological and conceptual highlights.
48 Cohen, S. G., & Bailey, D. E. (1997). What makes team work: Group effectiveness research
from the shop floor to the executive suite. Journal of Management, 23(3), 464-476. doi:10.1177/014920639702300303
Collinson, D. (2006). Rethinking followership: A post-structuralist analysis of follower identities. The Leadership Quarterly, 17(2), 179-189.
doi:10.1016/j.leaqua.2005.12.005
Cross, R., & Cummings, J. N. (2004). Tie and network correlates of individual performance in knowledge-intensive work. Academy of Management Journal, 47(6), 928-937.
doi:10.2307/20159632
De Dreu, C. K. W. (2007). Cooperative outcome interdependence, task reflexivity, and team effectiveness: A motivated information processing perspective. Journal of Applied Psychology, 92(3), 628-638. doi:10.1037/0021-9010.92.3.628
DeRue, D. S., & Ashford, S. J. (2010). Who will lead and who will follow? A social process of leadership identity construction in organizations. Academy of Management Review, 35(4), 627-647. doi:10.5465/amr.2010.53503267
DeRue, D. S., Nahrgang, J. D., Wellman, N. E. D., & Humphrey, S. E. (2011). Trait and behavioral theories of leadership: An integration and meta-analytic test of their relative validity. Personnel Psychology, 64(1), 7-52. doi:10.1111/j.1744-6570.2010.01201.x
Einarsen, S., Aasland, M. S., & Skogstad, A. (2007). Destructive leadership behaviour: A definition and conceptual model. The Leadership Quarterly, 18(3), 207-216. doi:10.1016/j.leaqua.2007.03.002
Erez, A., LePine, J. A., & Elms, H. (2002). Effects of rotated leadership and peer evaluation on the functioning and effectiveness of self‐managed teams: A quasi‐experiment.
49 Fairhurst, G. T. (2007). Discursive leadership: In conversation with leadership psychology.
Thousand Oaks, CA: Sage.
Fairhurst, G. T., & Uhl-Bien, M. (2012). Organizational discourse analysis (ODA):
Examining leadership as a relational process. The Leadership Quarterly, 23(6), 1043-1062. doi:10.1016/j.leaqua.2012.10.005
Field, A. (2013). Discovering statistics using IBM SPSS statistics. London: Sage publications.
Fleishman, E. A., Mumford, M. D., Zaccaro, S. J., Levin, K. Y., Korotkin, A. L., & Hein, M. B. (1991). Taxonomic efforts in the description of leader behavior: A synthesis and functional interpretation. The Leadership Quarterly, 2(4), 245-287. doi:10.1016/1048-9843(91)90016-u
Gerring, J. (2001). Social science methodology: A criterial framework. Cambridge: Cambridge University Press.
Gersick, C. J. G. (1989). Marking time: Predictable transitions in task groups. Academy of Management Journal, 32(2), 274-309. doi:10.2307/256363
Gersick, C. J. G., & Hackman, R. (1990). Habitual routines in task-performing groups.
Organizational Behavior and Human Decision Processes, 47(1), 65-97. doi:10.1016/0749-5978(90)90047-d
Gerstner, C. R., & Day, D. V. (1997). Meta-analytic review of leader-member exchange theory: Correlates and construct issues. Journal of Applied Psychology, 82(6), 827-844. doi:10.1037/0021-9010.82.6.827
Gibson, C. B., Cooper, C. D., & Conger, J. A. (2009). Do you see what we see? The complex effects of perceptual distance between leaders and teams. Journal of Applied
Psychology, 94(1), 62-76. doi:10.1037/a0013073
Ginnett, R. C. (1987). The formation process of airline crews. In R. S. Jensen (Ed.),
50 Graen, G. B., & Uhl-Bien, M. (1995). Relationship-based approach to leadership:
Development of leader-member exchange (LMX) theory of leadership over 25 Years: Applying a multi-level multi-domain perspective The Leadership Quarterly, 6(2), 219-247. doi:10.1016/1048-9843(95)90036-5
Hackman, J. R. (1987). The design of work teams. In J. Lorsch (Ed.), Handbook of Organizational Behavior (pp. 315-342). Englewood Cliffs, NJ: Prentice-Hall.
Hoogeboom, A. M. G. M., & Wilderom, C. P. M. (2015). Integrating two leadership models: Augmentation effects with initiating structure. Paper presented at the 75th Annual Academy of Management Conference, Vancouver, British Columbia.
Howell, J. M., & Shamir, B. (2005). The role of followers in the charistmatic leadership process: Relationships and their consequences. Academy of Management Journal, 30(1), 96-112. doi:10.5465/amr.2005.15281435
Ilgen, D. R., Hollenbeck, J. R., Johnson, M., & Jundt, D. (2005). Teams in organizations: From input-process-output models to IMOI models. Annual Review of Psychology, 56(1), 517-543. doi:10.1146/annurev.psych.56.091103.070250
James, E. H., & Wooten, L. P. (2010). Leading under pressure. New York, NY: Routledge.
Janz, B. D., Colquitt, J. A., & Noe, R. A. (1997). Knowledge worker team effectiveness: The role of autonomy, interdependence, team development, and contextual support
variables. Personnel Psychology, 50(4), 877-904. doi:10.1111/j.1744-6570.1997.tb01486.x
Jonsson, G. K., Enguera, M., Blanco-Villasenor, A., Losada, J., Hernandez-Mendo, A., Arda, T., . . . Castellano, J. (2006). Hidden patterns of play interaction in soccer using SOF.CODER. Behavior Research Methods, 38(3), 372-381. doi:10.3758/bf03192790