© 2019, IRJET | Impact Factor value: 7.211 | ISO 9001:2008 Certified Journal
| Page 7585
INVESTIGATION ON DELAY AND POWER MINIMIZATION IN IEEE 802.15.4
PROTOCOL USING CSMA-CA ALGORITHM
DHARA K V
1, RAJAN S
21
ME-Applied Electronics, Department of ECE, Velalar College of Engineering and Technology, Erode,
Tamilnadu, India
2
Assistant professor, Department of ECE, Velalar College of Engineering and Technology,
Erode, Tamilnadu, India
---Abstract
:
Wireless Sensor Networks (WSN’S) is a wireless network consisting of spatially distributed autonomous devices to monitor environmental and physical conditions. Many challenges and issues are in WSN .One of the challenges, in WSN is Quality of Service (QOS). Delay is the one of the parameter of QOS. In existing method, when sending the packets from the source to the destination if CTS signal is not received from the destination to the source, it resends the packet use maximum retry limits from sender to the receiver on average delay and power in the four dimensional markov chain based analysis of the slotted Carrier Sense Multiple Access with Collision Avoidance (CSMA/CA) algorithm in 802.15.4 protocol. In the proposed method, while sending the packets from source to the destination if CTS signal is not received from the destination to the source, it resends the packet use maximum retry limits is not considered from the source to the destination to improve delay and power in the four-dimensional markov chain-based analysis of the slotted Carrier Sense Multiple Access with Collision Avoidance (CSMA/CA) algorithm in 802.15.4 protocol .Compare zigbee protocol with maximum retry limit and zigbee protocol without maximum retry limit provide less delay and power.Keywords: WSN ; CSMA/CA; Quality of Service; Delay; Power
1 INTRODUCTION
A network, in compute, is a group of two or more devices that can converse. In practice, a network is comprising of a number of different processor systems associated by physical and/or by wireless connection. The scale can
collection from a single PC sharing out basic peripherals to enormous data centers located around the World, to the Internet itself. In any case of scope, all networks allow computers and/or individuals to share information and resources.
1.1
Wireless Networks
Hespanha J and Naghshtabrizi P (2007) were analyzing the performance of wireless networks are computer networks that are not connected by cables of any kind. The use of a wireless network enables project to stay away from the costly method of introducing cables into buildings or as a connection between different utensils locations. The basis of wireless systems is radio waves, an execution that takes place at the physical level of network structure.
1.2 Wireless Sensor Networks(WSN)
Bougard B and Dehaene W (2005) were analyze the
performance of Wireless Sensor networkto a group of spatially dispersed and dedicated sensors for monitoring and recording the physical conditions of the location and organize the collected data at a central location. WSNs measure ecological surroundings like temperature, sound, pollution levels, humidity, wind, and so on.© 2019, IRJET | Impact Factor value: 7.211 | ISO 9001:2008 Certified Journal
| Page 7586
2 RELATED WORKS
2.1 Performance Evaluation and
Delay-Power Trade-off Analysis of Zigbee
Protocol
Soumen moulik, Sudip Misra and Chandan Chakraborty (2018) estimate the superframe structure of the Medium Access management (MAC) sublayer in IEEE 802.15.4 protocol (ZigBee), measured for Low-Rate Wireless Personal Area Networks (LR-WPANs), and estimate the effect of the inactive portion of a superframe on average delay, and average power consumption. The four-dimensional Markov chain-based analysis of the slotted Carrier Sense Multiple Access with Collision Avoidance (CSMA/CA) algorithms presented in this work consider backoff freezing and acknowledged packet transmission that is not studied in the existing works. The systematic results prove that the performance of LR-WPANs depends significantly on the length of a superframe’s active portion. Introduce a variable – Superframe duration-Beacon interval quantitative relation (SBR), that is used by ever-changing a number of macintosh parameters to attain thirty fifth, reduced delay on a mean compared to the existing state of the art. The results show that the proposed model also yields improved performance in terms of power consumption, for shortand medium contention windows. In addition to the proposed analysis, this work provide optimized superframe order values that achieve trade-offs between delay and power consumption as demanded by user-provided QoS necessities corresponding to different contexts.
2.2
Beacon-Enabled
IEEE
802.15.4
Wireless Sensor Network Performance
Buratti (2010) was proposed by the application considered for IEEE 802.15.4 standard Low Rate-Wireless Personal Area Network (LR-WPAN) is wireless sensor network and control application that is centered on the concert of IEEE 802.15.4 standard for star and cluster topology. Analyze the result of throughput, delay, and energy consumption in order to get the highest result by this study conduct concert comparison of beacon-enabled modes on the star and cluster topology IEEE 802.15.4 standard to be appropriate the suitable topology model as needed. Conduct study on each topology model by using the numbers of nodes from 10 nodes to 100 nodes to evaluate throughput, delay, energy consumption, and
probability success packet. The simulation results show that the lifetime node and throughput of cluster topology is higher than that of star topology.
2.3 Performance Evaluation of the IEEE
802.15.4 MAC for Low-Rate Low-Power
Wireless Networks
Krishnamachari and Raghavendra (2004) was
analyze the performance of IEEE 802.15.4 is a new standard to address the need for rate power low-cost wireless networking. Provide in this manuscript one of the first simulation-based performance evaluation of the new medium access protocol in IEEE 802.15.4, focusing on its beacon-enabled mode for a star-topology network. Describe its key features such as the superframe structure, which allows devices to access channels in a contention access period (CAP) or a collision free period (eFP) and the beacon-based synchronization mechanism. Numerous of the key throughput-energy-delay tradeoffs instinctive in this MAC protocol using Our concert evaluation .Provide an analysis comparing the energy costs of the beacon tracking and non tracking modes for synchronization, performance that the optimal choice depends upon the grouping of duty cycles and data rates.3 EXISTING SYSTEM
3.1 DELAY
End-to-End delays or one way delays denotes to the time taken for a node to be transmitting transversely a network from sender to receiver. It is a general period in IP network monitoring, and differs from round-trip time (RTT) in that only paths in the one way from sender to the receiver is measured.
3.2
DELAY
ANALYSIS
OF
ZIGBEE
PROTOCOL WITH MAXIMUM RETRY
LIMIT
Delay analysis of zigbee protocol without
considering maximum retry limit is© 2019, IRJET | Impact Factor value: 7.211 | ISO 9001:2008 Certified Journal
| Page 7587
Figure 3.1 Flow diagram of zigbee protocol with
maximum retry limit
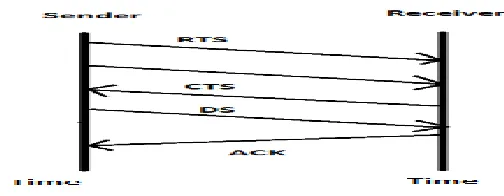
It sends the packet from sender to the receiver, if CTS packet is not received from the receiver. Sender will retransmit the packet with maximum retry limits to the receiver then it will send data sending to the receiver and acknowledgement from the receiver.
Analysis of average delay is shown in equation (1)
( [ ( ) ] ( )( )) --(1)
3.3 POWER
A low power wireless sensor networks is a lower cost result to transfer and gather information in the IoT space. By conserving and preventive power used by remote devices low power wireless networks open space for a variety of new applications in the IoT ecosystem.
3.4 POWER ANALYSIS OF ZIGBEE
PROTOCOL WITHOUT MAXIMUM RETRY
LIMIT
[image:3.612.323.575.104.202.2]Poweranalysis of Zigbee protocol flow diagram is shown in Fig 3.2
Figure 3.2 Flow Diagram of Zigbee protocol without maximum retry limit
It sends the packet from sender to the receiver, if CTS packet is not received from the receiver. Sender will retransmit the packet without maximum retry limit to the receiver then it will send data sending to the receiver and acknowledgement from the receiver.
Analysis of average power is shown in equation ( 2)
(∑ ∑ ∑ ∑ )
∑ ∑ ∑ ∑ ∑ ∑
(
) ∑
∑
∑
---
(2)
4 PROPOSED SYSTEM
4.1
DELAY
ANALYSIS
OF
ZIGBEE
PROTOCOL WITHOUT MAXIMUM RETRY
LIMIT
© 2019, IRJET | Impact Factor value: 7.211 | ISO 9001:2008 Certified Journal
| Page 7588
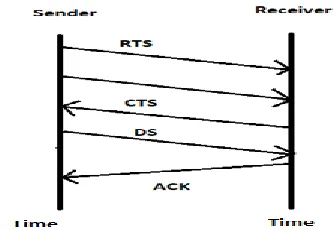
Figure 4.1 Flow Diagram of Zigbee protocol withoutmaximum retry limit
It sends the packet from sender to the receiver, if CTS
packet is not received from the receiver. Sender will retransmit the packet without maximum retry limit to the receiver then it will send data sending to the receiver and acknowledgement from the receiver.Analysis of average delay is shown in equation (3)
( [ ( ) ] ( )( )) --(3)
4.2 POWER ANALYSIS OF ZIGBEE
PROTOCOL WITHOUT MAXIMUM RETRY
LIMIT
Power
analysis of Zigbee protocol flow diagram isshown in Figure 4.2
Figure 4.2 Flow Diagram of Zigbee protocol without maximum retry limit
It sends the packet from sender to the receiver, if CTS packet is not received from the receiver. Sender will retransmit the packet without maximum retry limit to the receiver then it will send data sending to the receiver and acknowledgement from the receiver
Analysis of average power is shown in equation (4)
(∑ ∑ ∑ ∑ )
∑ ∑ ∑ ∑ ∑ ∑
(
) ∑
∑
∑
---
(4)
5 RESULTS AND DISCUSSION
5.1 THEORETICAL AVERAGE DELAY
CALCULATIONS OF ZIGBEE PROTOCOL
WITH MAXIMUM RETRY LIMIT
The delay is calculated as
The sample calculation of the delay is as follows,
Analysis of average delay is shown in equation ( 5)
( [ ( ) ] ( )( )) -(5)
[image:4.612.68.235.524.639.2]
© 2019, IRJET | Impact Factor value: 7.211 | ISO 9001:2008 Certified Journal
| Page 7589
Figure 5.1 Graphs for average delay calculation with
maximum retry limit
5.2 THEORETICAL AVERAGE DELAY
CALCULATIONS OF ZIGBEE PROTOCOL
WITHOUT MAXIMUM RETRY LIMIT
The delay is calculated as
The sample calculation of the delay is as follows,
Analysis of average delay is shown in equation (6)
( [ ( ) ] ( )( )) --(6)
Thus by performing the theoretical calculation, the average delay of zigbee protocol without maximum retry limit are obtained shown in Figure 5.2
Figure 5.2 Graphs for average delay calculation without maximum retry limit
5.3 THEORETICAL AVERAGE POWER
CALCULATIONS OF ZIGBEE PROTOCOL
WITH MAXIMUM RETRY LIMIT
The power is calculated as
The sample calculation of the power is as follows,
Analysis of average power is shown in equation (7)
(∑ ∑ ∑ ∑ )
∑ ∑ ∑ ∑ ∑ ∑
(
) ∑
∑
∑
---
(7)
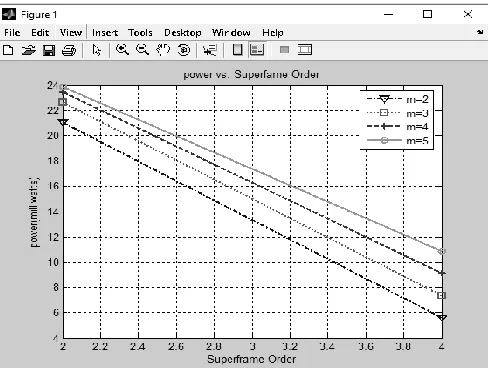
Thus by performing the theoretical calculation, the average power of zigbee protocol with maximum retry limit are obtained shown in Figure 5.3
Figure 5.3 Graphs for average power calculation with maximum retry limit
5.4 THEORETICAL AVERAGE POWER
CALCULATIONS OF ZIGBEE PROTOCOL
WITHOUT MAXIMUM RETRY LIMIT
The power is calculated as
[image:5.612.326.542.452.587.2] [image:5.612.38.266.560.691.2]© 2019, IRJET | Impact Factor value: 7.211 | ISO 9001:2008 Certified Journal
| Page 7590
Analysis of average power is shown in equation (8)
(∑ ∑ ∑ ∑ )
∑ ∑ ∑ ∑ ∑ ∑