
A Critical Review of Thermal Management Models and Solutions of Lithium-ion
Batteries for the Development of Pure Electric Vehicles
Qian Wang, Bin Jiang, Bo Li, Yuying Yan*
Fluids & Thermal Engineering Research Group, Faculty of Engineering,
University of Nottingham, UK
Corresponding author: [email protected]
Abstract
Power train electrification is promoted as a potential alternative to reduce carbon intensity of transportation. Lithium-ion batteries are found to be suitable for hybrid electric vehicles (HEVs) and pure electric vehicles (EVs), and temperature control on lithium batteries is vital for long-term performance and durability. Unfortunately, battery thermal management (BTM) has not been paid close attention partly due to poor understanding of battery thermal behaviour. Cell performance change dramatically with temperature, but it improves with temperature if a suitable operating temperature window is sustained. This paper provides a review on two aspects that are battery thermal model development and thermal management strategies. Thermal effects of lithium-ion batteries in terms of thermal runaway and response under cold temperatures will be studied, and heat generation methods are discussed with aim of performing accurate battery thermal analysis. In addition, current BTM strategies utilised by automotive suppliers will be reviewed to identify the imposing challenges and critical gaps between research and practice. Optimising existing BTMs and exploring new technologies to mitigate battery thermal impacts are required, and efforts in prioritising BTM should be made to improve the temperature uniformity across the battery pack, prolong battery lifespan, and enhance the safety of large packs.
Keywords: Low carbon vehicles, Lithium-ion battery thermal management, heat pipe, pure electric and hybrid cars
1.
Introduction
opportunities are offered to EVs, since the US government offers 2.5 billion funding and grants for a variety of EV related companies, and China shifts the focus to develop EV related economic and energy policies [9].
The fundamental challenge for clean energy vehicles to be commercialised is energy storage. Developing a proper battery pack for the vehicle to achieve high power and high energy is essential. Rechargeable lithium-ion batteries are well suited for HEVs and EVs, but they have not yet been widely adopted in automotive industry due to barriers such as cost, safety, and low temperature performance coupled to thermal effects [10]. Battery thermal management (BTM), which is a critical issue for the development of pure electric vehicles, typically pure electric passenger cars [200-2002], has received little attention during the last few years because the understanding of lithium-ion battery thermal issues is lacking. This paper will focus on two aspects of lithium-ion batteries applied to HEVs and/or EVs, namely, the development of battery models and the existing thermal management strategies. Thermal issues such as safety, thermal runaway, and sub-zero temperature operating performance are investigated and discussed. The approaches of battery models in terms of thermal-electrochemical or thermal-electrical coupled and decoupled models will be reviewed and the heat generation is in particular emphasised in order to determine the accuracy of battery thermal analysis. The existing BTM strategies are then investigated so that the imposing challenges and critical gaps between commercial manufacturers and developers can be identified. Eliminating battery thermal impacts by optimising existing BTMs and exploring new technologies is encouraged, and prioritising BTM for HEVs and EVs seems critical in minimising the temperature variations across the batter pack, prolonging battery life cycle, and improving the safety of large packs.
2.
Lithium-ion Batteries for Hybrid/Pure Electric Vehicles
2.1.
General Considerations
EV, which was invented ahead of the first gasoline-powered vehicle, consists of mainly four elements: an energy source (the battery), a power convertor, an electric motor, and a mechanical transmission [11]. A vehicle driven by an electric motor is much more efficient than an engine-driven vehicle, for that the motor has high efficiency over 90% compared to 30% obtained by the engine [12]. Other merits such as a high-torque at low revolution speed, quicker torque response, and recovering kinetic energy into electricity from braking torque are also favourable. Shimada [13] compared the energy efficiency of FCV (fuel cell vehicles), HEV (hybrid electric vehicles), CNG (compressed natural gas), and BEV (battery electric vehicle) based on the input energy per 1km during 10-15 mode driving cycle test [14]. BEV (or EV) has shown to have the lowest input energy proportional to CO2 discharge and
the highest fuel economy. The heat loss of EV, in addition, is significantly small compared to that from the engine vehicle. However, the fuel density of batteries in comparison with liquid fuel or gas fuel retains extremely low, which implies that EV has to carry a large amount of battery cells in order to achieve the same performance offered by the engine-vehicle.
twice the amount of specific energy and energy density (150 Wh/kg and 400 Wh/L respectively) relative to the practical nickel-metal hydride (NiMH) batteries (75 Wh/kg and 240 Wh/L), which have dominated the HEV market.
Apart from acceleration and driving performance, other criteria such as cost, range, and lifespan, as well as safety, are also critical. The cost of an EV battery is significant, arguably and prohibitive. $/kWh is an important quantity in evaluating cost. The United States Advanced Battery Consortium (USABC) outlined $/kWh goals for battery technology to reach a commercially viable level, which is $200-300/kWh versus current costs of $750-1000/kWh [17]. Cluzel and Douglas [18] presented both conservative and optimistic scenario results of battery pack cost based on different EV classes and the reported cost ranges from $587-1,327/kWh in 2011. Additionally, Gaines and Cuenca [19] broke down the materials cost of a 10Ah lithium-ion high power cell and pointed out that cathode, separator and electrolyte contribute the most to the total battery cost, taking up 28%, 23% and 20% respectively. It is stated in [20-22] that lithium-ion batteries have not yet achieved the potential of cost reductions and the search for reducing potential cost is encouraged by material substitution, increased packaging efficiencies, process development, increased manufacturing yields or inexpensive production.
Table 1 lists the types of storage batteries currently used or to be used in EVs. Notably, high-temperature batteries, which have been developed for quite a few years and now in pilot production, have not been used in EV productions. Therefore, only ambient operating temperature batteries are considered for EVs to ensure good performance and safety. A suitable lifespan for a practical battery is suggested to be 1000 cycles or about 3-4 years. Open-circuit voltage is also crucial which determines the required number of cells to form a battery pack reflecting battery complexity and potential reliability. The higher the voltage becomes, the better the ratio of the active components in the cell over the passive containing materials. From Table 1, lithium-ion batteries seem to be the best among other cell chemistries due to high energy and power density, long life cycles, ambient operating temperature, and high open-circuit cell voltage. Lithium-ion batteries can store more energy per mass compared to NiMH, and achieves high cell voltage of 3.6V in contrast with 1.23V obtained by NiMH. More importantly, lithium-ion refers to the family of battery chemistry, as shown in Table 2, which indicates material flexibility and potential in cost reduction through material substitution.
Figure 1: Ragone plot of various electrochemical energy storage and conversion devices [23] including recently reported SOFC [15].
Qmax (Wh/kg)
Pmax (W/kg)
t (min) N $/kWh V (V)
Lead-acid
35 150 / 1000 60 2.1
Advanced lead-acid
45 250 / 1500 200 /
Valve regulated lead-acid
50 150+ 15 700+ 150 /
Metal foil lead-acid
30 900 15 500+ / /
Nickel-iron
50 100 / 2000 150-200 1.2
Nickel-zinc
70 150 / 300 150-200 1.7
Nickel-cadmium
50 200 15 2000 300 1.2
Nickel-metal hydride (NiMH)
70 200 35 2000+ 250 1.23
Lithium-ion
120-150 120-150 <60 1000+ 150 3.6 Aluminium-air
220 30 / / / 1.5
Zinc-air
200 80-140 / 200 100 1.65
Note:
Qmax – maximum energy density; Pmax – maximum power density; t - fastest 80% recharge time;
[image:4.595.55.521.573.752.2]N – 80% discharge cycles before replacement; $ - estimated large-scale production cost per kWh; V – open-circuit cell voltage.
Table 2. The major components of lithium-ion batteries and their properties [25, 26]
Abbrev. LCO LNO NCA NMC LMO LFP LTO
Name Lithium cobalt
oxide
Lithium nickel
oxide
Lithium nickel cobalt aluminium
oxide
Lithium nickel, manganese
cobalt oxide
Lithium manganese
spinel
Lithium iron phosphate
Lithium titanate
Positive electrode
LiCoO2 LiNiO2 Li(Ni0,8
5Co0,1Al
0,05)O2
Li(Ni0,33
Mn0,33C
oo33)O2
LiMn2O4 LiFePO4 LMO,
NCA, …
Negative electrode
Cell voltage (V)
3.7-3.9 3.6 3.65 3.8-4.0 4.0 3.3 2.3-2.5
Energy density (Wh/kg)
150mAh/ g
150 130 170 120 130 85
Power + o + o + + ++
Safety - o o o + ++ ++
Lifetime - o + o o + +++
Cost -- + o o + + o
2.2.
Mechanism and Configuration
The mechanism of a lithium-ion battery is given by Fig. 2. Lithium-ions (Li+) move from the negative electrode (cathode) to the positive electrode (anode) via a separator diaphragm to form a discharge cycle, and vice versa when charging. The cathode is usually made of carbon, and the most commercially popular material is graphite. The anode is a lithium containing compound and is generally one of three materials: a layered oxide (e.g. lithium cobalt oxide – LiCoO2), a polyanion (e.g.
lithium iron phosphate – LiFePO4) or a spinel (e.g. lithium manganese oxide – LiMn2O4). The
electrolyte refers to a solution of lithium salt in a non-aqueous solvent such as ethylene carbonate or diethyl carbonate. The current collector for negative and positive electrode is made of copper (Cu) and aluminium (Al) respectively. Taking LiMn2O4/graphite as an example, the electrochemical reactions
occurring at the electrode/electrolyte interfaces are described below.
Composite positive electrode:
Composite negative electrode:
As illustrated in Fig. 2, Li+ is inserted into solid particles of the anode and de-inserts from solid particles of the cathode during discharge. Lithium-ion diffusion in the solid phase and the electrolyte depletion will always limit cell discharge. Significantly, heat is generated within the cell and dissipated to the surroundings in all directions. If the heat is dissipated only through the graphite on the top of the two electrodes, temperature gradient will be developed along the cell height leading to non-uniform electrode reaction rates.
4 2 4
2
arg
arg Li Mn O
xe xLi O Mn
Liy x y
e disch e ch
LiC xLi xe
C Li e disch e ch
x 6 0 6
arg
Figure 2: Lithium-ion battery mechanism during charge and discharge.
Figure 3: Battery cell configurations.
Figure 5: Lithium-ion battery pack for a PHEV (A123 Systems) [27].
2.3.
Market Penetration and Potential
The future development of EV can be predicted by introducing major work done by specialist niche manufactures. Table 3 summarises major EV productions currently available/unavailable in the market. It seems that NiCd (Citroën, Ford, Peugeot and Renault) and NiMH (GM, Honda and Toyota) were the most favourite two for EV batteries back in 2000. The inconsistent aim set by the manufacturers indicates the immaturity of battery technology, such that scarce evidence of EV mass production to the public was seen. However, in recent 5 years, lithium-ion batteries become the top candidate in EV manufacturers due to lightweight, higher energy and power density, improved nominal range, and reasonable fast charging time. The cases of commercial success of EVs are listed in Table 3 and these may have suggested that lithium-ion batteries will possibly be a preferred solution for overcoming the challenges of energy storage and driving range encountered by many battery powered vehicles.
Table 3: List of major EV productions currently available and no longer available (by 2014)
Model Type
Battery Type Battery Weight (kg)
Top speed (km/h)
Nominal Range (km)
Charge Time (h)
Sale/lease Price
Market Release Date
Available in [31-40]
BMW i3 22 kWh Lithium-ion
230 [41]
150 130-160 0.5-9 $52,000 [42]
2013
BYD e6 75 kWh LiFePO4
500 [43]
140 330 10-20min $52,000 [44]
2010
Chevrolet Spark EV
21.3 kWh nanophosphate Lithium-ion
254 [45]
144 132 0.33-7 From
$12,170 [46]
Citroën C-Zero (also called Mitsubishi i-MiEV) 16 kWh Lithium-ion 240 (200 [47])
130 100-160 (170) 0.5-7 (0.5-14) $48,000 [48] (>$38,000 ) [49] 2010 (2009)
Ford Focus 23 kWh Lithium-ion
300 [50]
135 122 3-4,
18-20
$35,170 [51]
2011
Nissan Leaf 24 kWh Lithium-ion
294 [52]
150 117-200 0.5-20 $35,430 2010
Tesla Model S 60-85 kWh Lithium-ion 535-556 [53]
193-214 370-426 1.5-20 min $63,570 [54] 2012 Venturi Fetish 54 kWh Lithium-ion polymer 450 [55]
200 340 3-8 $400,000 2006
Volkswage n e-Up! 18.7 kWh Lithium-ion 230 [56]
130 160 0.5 $34,500 2013
general information from [24, 57]
Ford Th!nkCity 11.5 kWh NiCd 260 [58]
90 85 5-8 / 1999
-2002 GM EV1 16.2 kWh
Lead-acid
594 [59]
129 95 6 $399 per
month
1996 -2003 GM EV1 26.4 kWh
NiMH
481 [60]
129 130 6 $480 per
month 1996 -2003 Honda EV Plus 26.2 kWh NiMH
374 129 190 6-8 $455 per
month 1997 -1999 Nissan Hypermini 15 kWh Lithium-ion
/ 100 115 4 $23,350
-36,000 1999 -2001 Nissan Altra EV 32 kWh Lithium-ion 365 [61]
120 190 5 $50,999 1998
-2000 Peugeot 106 électrique (also called Citroën Saxo électrique) 12 kWh NiCd
/ 90
(91) 150 (80) 7-8 (7) $14,700 -27,000 ($12,300 excluding batteries) 1995 -2003 Renault Clio Electric 11.4 kWh NiCd
/ 95 80 / $16,000
-27,400 / Toyota RAV 4 27 kWh NiMH
380 125 200 10 $45,000 1997
Tesla Roadster
53 kWh Lithium-ion
450 [62]
209 390 3-5 >$92,000 2008 -2012
Note: charge time varies depending on the charging method. Long hours of charging may be needed with conventional charger (e.g. onboard charger, charged from household); short period of charging can be realised by a quick charger system (50-80% of battery capacity charged) (e.g. AC/DC fast charging station, Tesla Superchargers, etc) or battery swap (1.5min demonstrated by Tesla Motor).
3.
Thermal Analysis of Lithium-ion Batteries
3.1.
Safety and Thermal Runaway
For high voltage batteries such as lithium-ion battery in particular, prioritising safety at every step of the battery development including material selection, cell design, electronic controls and module assembly is essential but challenging. According to Doughty and Roth [63], safety is required to be evaluated at every level, i.e. the cell, the module, the pack and ultimately the vehicle level. This is because failure at one level will escalate to much more severe failures at a higher level. The international standard ISO 6469 [64] addresses safety specifications for electrically propelled road vehicles including onboard electrical energy storage (Part 1), functional safety means and protection against failures (Part 2), and protection of persons against electrical hazards (Part 3). Safety devices are required to be incorporated into EV batteries to protect against off-normal operations and manage consequences of heat and gas generation. One of these devices is battery management system that regulates electrical distribution and prevents from over-voltage, under-voltage, excessive current, as well as elevated temperature.
Various battery chemistries have different responses to failure, but the most common failure mode of a cell under abusive conditions is the generation of heat and gas [65]. The possible exothermic reactions and thermal stability of lithium-ion batteries have been reviewed in [10] and [63]. Table 4 summarises the identified reaction of the components used in a lithium-ion battery. It shows that the components are completely stable below 80°C, but once the temperature reaches to 120-130°C, the passivation layer (SEI – solid-electrolyte interface) starts dissolving progressively in the electrolyte causing the electrolyte to react with the least protected surface of graphite generating heat.
Table 4: Thermal stability of components used in a lithium-ion battery (values measured with differential scanning calorimetry on electrodes) [26].
Temperature (°C) Associated reactions
Energy (J/g) Comment
120-130 Passivation layer 200-350 Passive layer breaks, solubilisation starts below 100°C
130-140 PE separator melts -90 Endothermic
160-170 PP separator melts -190 Endothermic
[image:10.595.95.501.592.733.2]200-230 Positive material decomposition
1000 O2 emission
reacts with solvents 240-250 LiC6 + binder 300-500
240-250 LiC6 + electrolyte 1000-1500
Roth et al. [66] tested three different lithium-ion cells (SONY/GEN1/GEN2) under elevated temperature abusive conditions. Data summarised by Doughty [67] illustrates a general path to thermal runaway in lithium-ion cells which can be categorised into three stages (Fig. 6): 1) initial thermal runaway regime; 2) cell venting; 3) cell runaway and explosive decomposition. Thermal runaway describes the condition when elevated temperature triggers heat-generating exothermic reactions and potentially increases the temperature causing more deleterious reactions [10]. If no heat dissipation method is available, the internal cell temperature will continue increasing rapidly. Once the temperature exceeds the onset temperature, the heat release will be accelerated due to increased electrolyte reduction at the anode (Stage 2). Additional heating may cause the cell to generate more than 10°C/min self-heating rate leading to thermal runaway (Stage 3). As a consequence, this progresses into battery fire and explosion. Examples of EV incidents listed in Table 5 may give an idea of how car crash or charging/discharging batteries leads to potential overheating or fire explosion. In order to improve lithium-ion battery safety, shutdown separators or pressure releasing devices, safer electrolytes and positive electrode materials, special additives and coatings [68], and an appropriate thermal management strategy are suggested to provide additional safety by limiting thermal runaway and preventing cell from rapid self-heating.
(b)
[image:12.595.147.539.74.299.2]Figure 6: Illustrating three stages of the thermal response (thermal runaway path) obtained from SONY/GEN1/GEN2 lithium-ion cell [67]: (a) Stage 1-2 in scope; (b) Stage 3.
Table 5: EV incidents
EV Type Incident Place & date
Investigation summary
BYD e6 Caught fire after car crash
Shenzhen, China, 2012
Electric arcs caused by short circuit; however 72 out of 96 (75% ) single cell batteries did not catch on fire and no flaws in safety design [69]
Chevrolet Volt Caught fire after crash test
USA, 2011 No higher risk of fire than gasoline-powered vehicles according to National Highway Traffic Safety Administration (NHTSA) [70] Dodge Ram
1500 PHEV
Overheated battery packs
2012 No injuries, Chrysler recalled as a precaution [71]
Fisker Karma Home fire in Texas and a fire incident in
parking lot in California
Texas and California, 2012
Unknown;
Internal fault made the fan to fail, overheat and started fire, not lithium-ion battery pack [72]
Mistubishi i-MiEV
Caught fire at
Mizushima battery pack assembly plant when charging/discharging; battery cells in an Outlander PHEV in
[image:12.595.55.553.402.751.2]Yokohama overheated and melted
Tesla Model S Caught fire after hitting debris on highway
Kent,
Washington, 2013
Fire began in the battery pack but potential damage was avoided due to isolation of fire barriers inside the battery pack, fire risks are lower when driving a car powered by a battery than that powered by gasoline [74] Zotye M300
EV
Caught fire Hangzhou, China, 2011
Lack of quality during manufacturing, problems include leaking of battery cells, insulation damage between battery cells and container, short circuits [75]
3.2.
Sub-zero Temperature Performance
Sub-zero climate will make the battery efficiency drop leaving the discharge capacity minimal [76]. This directly affects vehicle mobility and driving range, and subsequently, the life cycle. A good example of this is 2012 Nissan Leaf, which has only 63 miles at -10°C whereas 138 miles under ideal condition [77]. For pure EVs, due to the fact that no combustion engine was present to provide heating, a significant proportion of battery energy will be used for heating the battery and the cabin, shortening the driving range even more by 30–40%. USABC [78] suggests the testing manual for EV batteries, which can be categorised into well-performed battery in cold weather if it absorbs a fast charge from 20% to 60% depth of discharge (DOD) or 40% to 80% state of charge (SOC) in 15min. According to QC/T 743-2006 [79], the discharge capacity requirement for lithium-ion battery at -20°C should be no less than 70% of its rated capacity. However, few batteries are capable of maintaining at such rated capacity at sub-zero temperatures.
Huang et al. [80] and Lin et al. [76] pointed out that a lithium-ion battery might be able to be discharged normally at low temperatures, but not so during reverse charging process. Nagasubramanian [81] reported that the commercial 18650 lithium-ion battery has only 5% of energy density and 1.25% of power density compared to that obtained at 20°C. Shidore and Bohn [82] summarised the percentage drop in EV range based on three initial temperature conditions (20°C, 0°C and -7°C) during UDDS and UDDSx1.2 aggressive driving cycles. 0%, 9%, and 13% drop in EV range was resulted respectively under UDDS, and 10.7% drop was observed under UDDSx1.2 for an initial temperature of 0°C as compared to 20°C. In addition, capacity fade due to lithium plating upon charging in cold climate has been studied [76, 83]. Zhang et al. [84] made a generalisation that both energy and power of the lithium-ion batteries will be reduced once the temperature falls down to -10°C. Shi et al. [85] conducted an experiment comparing the discharge capacity of the lithium-ion battery used for electric vehicles under both -20°C and 20°C, and showed that 62.6% was obtained at -20°C, smaller than the rated standard.
of a PHEV lithium-ion battery impact of low ambient temperature at -7°C and 0°C have been quantified [82]. These include limited battery propulsion and regenerative power accounting for 34% of the total reduction in battery power, high battery internal resistance leading to 8-12%, and other losses that attribute to 54-58%. In addition, ten-time increase in resistance has been measured from the commercial 18650-lithium-ion battery at -20°C [91]. Stuart and Hande [92] explained the charging or discharging difficulty at cold temperatures and addressed the concern of potential hazards due to increased charge-transfer resistance. The highly nonlinear overvoltage equivalent resistance (Rov) increases so much at a sufficiently low temperature and SOC making the battery almost unusable. High Rovalso causes excessive gassing resulting in a loss of electrolyte, or even case rupturing if the internal pressure generated due to gassing exceeds the capacity of the relief valves. The problems could be solved by formulating [88, 89] or replacing the chemical substances [93, 94] inside the lithium-ion batteries, or seeking for viable battery preheating methods in order to avoid loss in energy and power capability [81, 86] as well as severe battery degradation at sub-zero climates.
3.3.
Battery Model Approach
Battery modelling can be defined using a set of equations under specific conditions of interest. The choice of equations, or the mathematical description of batteries, is significant in predicting the behaviour of the system. The thermal behaviour of a lithium-ion battery can be strongly affected by electrochemical and chemical processes occurring inside the cell during charge and discharge [95]. Battery heat generation is complex which requires knowing of how electrochemical reaction rates vary with time and temperature, and how current is distributed, especially within large size batteries. A battery thermal model can be thermal and electrochemical/electrical coupled or decoupled, depending on the heat generation. A fully coupled model uses newly generated parameters for current and potential from the model to calculate the heat generation, so that the temperature distribution in relation with the current and potential can be predicted [96]. The decoupled model may sometimes employ empirical equations based on experimental data. A partially-coupled approach can also be adopted, where the heat generation rate applied at one thermal environment (nonisothermal) was from that obtained previously at a given thermal environment (isothermal model) [97].
3.3.1.
Electrochemical/electrical Model
Two categories of the numerical models for obtaining the heat generation will be discussed in this paper: electrochemical model (or first principle model) and equivalent circuit model. The electrochemical model is by far the most used method and is usually a one-dimensional physics-based electrochemical model which has a set of governing equations (Eq. 1-5, Table 6) describing kinetics, transport phenomena and energy dissipation of a cell. It was first developed by Newman’s group [98, 99] based on a macro-homogeneous and isothermal model approach [100]. The model (Fig. 7) can be established from two composite electrodes and a separator, along with one-dimensional transport of lithium-ions from the negative electrodes to the positive electrode through the separator. A good agreement with the experimental data performed later by Doyle [101] showed the applicability of such model to almost any of the existing li/lithium-ion systems.
Table 6: Fundamentals of electrochemical model for lithium batteries
Physic Fundamentals Equations
Reaction rate
(Butler-Volmer equation) (1)
as – specific interfacial area of an electrode
ioj – exchange current density (a function of lithium concentrations in both electrolyte and solid active materials,
, where ce is volume-average lithium concentration in the electrolyte; k is the constant, determined by the initial exchange current density and species concentration)
αaj, αcj – anodic and cathodic transfer coefficient of electrode reaction F – Faraday’s constant (96,485 C equiv.-1)
R – universal gas constant
T – absolute temperature in Kelvin
ηj – local surface overpotential ( , where ϕs, ϕe is volume-average electrical potential in solid phase and electrolyte; U is open circuit potential)
Phase transition & Ion transport
Solid phase
conservation of Li+ species
Electrolyte phase conservation of Li+ species
(2)
with boundary conditions ,
Ds – mass diffusion coefficient of lithium-ion in the electrolyte r – radial coordinate along active material particle
Rs – radius of solid active material particle
jLi– transfer current resulting from the lithium insertion/de-insertion at the electrode/electrolyte interface which consumes/generates the species Li+,
in the cathode, separator and cathode respectively
(3)
with boundary conditions for 1D analysis
εe – volume fraction/porosity of electrolyte
- effective diffusion coefficient (Bruggeman relation, )
cj j
j aj oj s nj RT F RT F i a
j exp exp
aj
aj
cjse se s
e
oj k c c c c
i ,max
U
e s
j
0
2
2
s s s c r r r r D c t 0 0 r s s c r D F a j c r D s Li R r s s s c n c s a n a s Li i a i a j , , , , 0
1 0 F t i F j t c D c t e Li o e eff e e e 0 0
x L
e x e c x c x eff e D 5 . 1 e e eff e D
- transference number of the Li+ with respect to the velocity of solvent (a function of electrolyte concentration, if assuming constant,
=0)
Energy dissipation
Charge conservation in the solid phase
Charge conservation in the electrolyte
(4) with boundary conditions
, for
1D analysis
σeff – effective conductivity of the solid phase
(5)
with boundary conditions for 1D analysis
– diffusional conductivity (Bruggeman relation, )
– effective ionic conductivity ( ,
[image:16.595.56.543.61.659.2]where is molecular activity coefficient of the electrolyte)
Figure 7: Dual lithium-ion insertion cell sandwich structure developed by [99].
The equivalent circuit model, which does not consider the physical fundamentals of the battery cells, provides a simple structure to capture the input/output relationship of the battery. It utilises common
o
t
F t ie
0 Li s eff j A I x
x x L
s eff x s eff 0 0 L x s x s x x
ln
0 Li e eff D e eff j c k k 0 0
x L
e x
e
x
x
eff
k 1.5
e
eff k
k
eff D
k
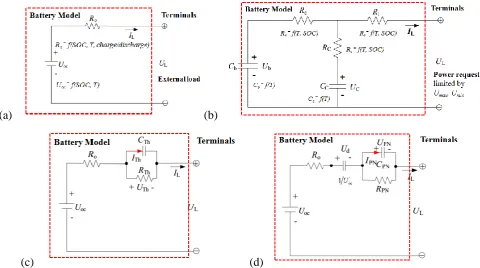
electrical components such as resistors, capacitors, and voltage sources to form a circuit network [102]. Typical equivalent circuit models used for vehicle batteries are Rint model (or Internal Resistance model), Resistance Capacitance (RC) model, Thevenin model, and PNGV (Partnership for New Generation of Vehicles) model [102-108].Rint model (Fig. 8 (a)) assumes that the battery is an ideal voltage source in series with the resistance. RC model (Fig. 8 (b)) was developed by SAFT Battery Company containing capacitors within the branches of the circuit to show more close-to-real battery characteristics. A one or two RC block model without parasitic branch is generally accepted for lithium cells according to [107]. In addition, Thevenin model (Fig. 8 (c)) has been widely used in early battery management system and was developed based on Rint model which connects a parallel RC network in series and takes into account of polarisation. Finally, the PNGV model (Fig. 8 (d)) was modified from Thevenin model with a slight increase in circuit elements (a capacitor 1/U’oc in series is added) [108]. Table 7 summarises basic equations for those models.
(a) (b)
[image:17.595.57.538.286.554.2](c) (d)
Figure 8: Various equivalent circuit models used for vehicle batteries (modified from [102, 103, 105]: (a) Rint model; (b) RC model; (c) Thevenin model; and (d) PNGV model.
Table 7: Equations of electrical model for lithium batteries
Model Equations
Rint Model (internal resistance
model)
(6)
UL– terminal voltage Uoc – open-circuit voltage
IL – load current (+ discharge, - charging) o L oc
L U I R
[image:17.595.59.543.666.768.2]Ro – internal resistance or ohmic resistance
RC Model (7)
(8)
Cc – surface capacitor (small capacitance which mainly represents the surface effects of a battery)
Cb – bulk capacitor (large capacitance which represents the ample capability of a battery to store charge)
Ub, Uc – voltages across capacitor Cb and Cc Rt – terminal resistance
Re – end resistance Rc – capacitor resistance Thevenin Model
(9)
(10)
CTh– equivalent capacitance that reflects the transient response during charge and discharge
UTh– voltage across CTh RTh– polarization resistance ITh– outflow current
PNGV Model (11)
(12)
(13)
Ud, UPN – voltages across 1/U’oc and CPN IPN – outflow current of CPN
Many studies extended the one-dimensional electrochemical model to include an energy balance to capture temperature within the cell. Gu and Wang [96] demonstrated a diagram (Fig. 9) of thermal-electrochemical coupled modelling approach and the coupled model takes into account of multi-scale physics in lithium-ion battery including kinetics (electrochemical kinetics), phase transition (solid-phase lithium transport), ion transport (lithium transport in electrolyte), energy dissipation (charge conservation/transport), and heat transfer (thermal energy conservation). Fig. 10 illustrates such
micro-
Lc e c e c e b c c b c e c c e c c e b c e b c b I R R C R R R C R U U R R C R R C R R C R R C U U 1 1 1 1
Lc e c e t c b c e e c e c L I R R R R R U U R R R R R R U Th L Th Th Th Th C I C R U
U
o L Th OC
L U U I R
U
L oc
d U I
U '
PN L PN PN PN PN C I C R U
U
o L PN d oc
L U U U I R
macroscopic modelling approach applied into a lithium-ion vehicle battery. Moreover, an example of a thermal-electrical coupled model used for an A123 LiPO4/graphite battery is demonstrated in Fig.
[image:19.595.66.539.146.615.2]11. A control-oriented model block is used to form the coupled model and it can be built from two subsystems namely equivalent circuit models and thermal models with parameter estimation linked in between for real time implementation.
[image:19.595.60.537.465.634.2]Figure 9: Thermal-electrochemical coupled modelling approach [96].
Figure 11: Coupled thermal-electrical model for an A123 LiPO4/graphitebattery [111].
3.3.2.
Thermal Model and Heat Generation Modelling
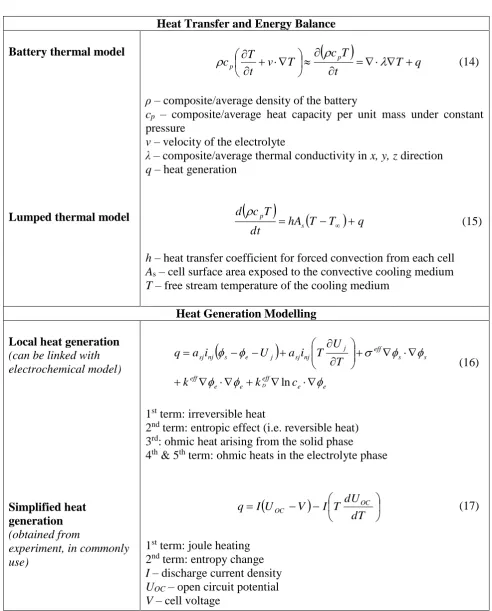
The battery thermal model accounts for heat accumulation, convection, conduction and heat generation (Eq. 14, Table 8). To note, the term , i.e. the convective heat transfer inside the battery, is always neglected because liquid electrolytes in a lithium-ion battery tend to show limited mobility. Another commonly used method is called lumped thermal model, which balances accumulation, convective heat dissipation to the surroundings, and heat generation (Eq. 15, Table 8). By assuming the battery as a lumped body, the temperature of the battery is considered to be uniformly distributed in all directions at all times during the transient heat transfer. This often applies to the condition where
single cells have small thickness so that the Biot number ( ) is less than 1.
Battery heat is generated due to activation, concentration and ohmic losses [112]. Various equations have been applied to calculate the heat generation rate in lithium-ion batteries. The local heat generation (Eq. 16, Table 8) has shown to be more accurate but is very complex. Bernardi et al. [113] formulated the thermodynamic energy balance on a single cell, and a simplified form (Eq. 17, Table 8) has been readily accepted in small lithium-ion batteries if assuming no heat from mixing or phase change, uniform temperature or SOC, and only one electrochemical reaction takes place [96]. This equation can be used if the experimental over-potential and entropic heat coefficients are known. Attempts to experimentally examine the irreversible electrochemical heat generation for lithium-ion batteries can be obtained from two methods: accelerated-rate calorimetry (ARC) and isothermal heat conduction calorimetry (IHC) [112]. The ARC method allows the heat generation rate to be calculated based on an energy balance between the battery (heat source) and a constant temperature sink. The IHC method maintains the battery at a constant temperature throughout the whole operation and uses high-accuracy thermopiles attached to the surface of the battery to measure the heat rate. For reversible heat, the most common way is to measure the open-circuit potential (OCP) variation with temperature at a constant SOC. However, studies that used the aforementioned experimental methods have only been investigated where the total heat generation was obtained under currents no greater than 2C, and many were carried out under ambient temperature of 20°C or 25°C. Temperature influence was always omitted or for those who investigated it, the chosen temperature range was small. According to Hong et al. [114], small temperature changes cause significant heat accumulation, greater than the heat rejection of the device in some cases. Moreover, Sato [115] analysed the thermal behaviour of lithium-ion batteries (Sony 18650 cell) and developed a heat intake and release model (Eq. 18-19, Table 8).
T v cp
1
The heat generation equations which constitute reaction heat Qr, polarisation heat Qp, and Joule heat Qj during charging and discharging have been established and the obtained results (used a constant Rt at 50% DOD) agreed well with experiment.
Table 8: Summary of thermal model equations
Heat Transfer and Energy Balance Battery thermal model
Lumped thermal model
(14)
ρ – composite/average density of the battery
cp – composite/average heat capacity per unit mass under constant pressure
v – velocity of the electrolyte
λ – composite/average thermal conductivity in x, y, z direction q – heat generation
(15)
h – heat transfer coefficient for forced convection from each cell As – cell surface area exposed to the convective cooling medium
T – free stream temperature of the cooling medium
Heat Generation Modelling Local heat generation
(can be linked with electrochemical model)
Simplified heat generation
(obtained from
experiment, in commonly use)
(16)
1st term: irreversible heat
2nd term: entropic effect (i.e. reversible heat) 3rd: ohmic heat arising from the solid phase
4th & 5th term: ohmic heats in the electrolyte phase
(17)
1st term: joule heating 2nd term: entropy change I – discharge current density UOC – open circuit potential V – cell voltage
q T t T c T v t Tcp p
q T T hA dt T c d sp
Heat generation
(Sato [115]) (18)
(19)
Qr – reaction heat, Qp – polarisation heat, Qj – joule heat,
Q1 – heat generated (kJ/mol) from positive electrode (
) and negative electrode (
)
Ic, Id– battery charge/discharge current Rp – resistance due to polarisation Re – internal resistance
Rt.c, Rt.d – total electrical resistance during charging/discharging
3.3.3.
Coupled and Decoupled Models
A summary of the coupled thermal-electrochemical models used in literature is provided in Table 9. Arrhenius law (Eq. 20) can be applied to mass transport and kinetic parameter ψ to couple electrochemical and thermal models. Significantly, the lumped thermal model used by [97, 116-118] that neglects spatial temperature variation by assuming the temperature is uniform all over the cell (small Biot number, Bi<<1) may result in an error of 15% in total thermal energy under higher discharge rates [119] (Fig. 12). The local heat generation method performed by [116, 117, 119-122] has shown to be more accurate. Srinivasan and Wang [119] plotted the heat generated due to various factors contributing to the total heat (Fig. 13). They pointed out that the reversible heating effect can be important at low discharge rates (0.01-1C) (Fig. 13 (a)), but will be dominated by irreversible (reaction and ohmic) heating at high discharge rates (1-10C) (Fig. 13 (b)). Furthermore, 2D thermal model has been used in most studies because a larger aspect ratio of the cell is available. The need for a 2D model can only be reduced if the cell has a smaller aspect ratio or the current collectors have increased thickness with two orders of magnitude larger thermal conductivity [119].
(20)
ψref– property value defined at reference temperature Tref
- activation energy which controls the temperature sensitivity of each individual property ψ
Table 9. Summary of thermal-electrochemical models used in literature
2 , 1
2
arge 3.37 10 c 3.60 tc c
ch Q I R I
Q
2 , 1
2
arge 3.37 10 d 3.60 td d
disch Q I R I
Q
I Q Qr 3.37102 1
2
60 . 3 R I Qp p
2
60 . 3 R I Qj e
Li CoO xLi xe
LiCoO2 1 x 2
x
CLi xe
xLi
C
Refs. Battery type (positive/negative electrode)
Configuration Electrochemical model (ECM)
Thermal model (Eq. from Table
8) Pals and Newman
[97]
LiPEO8
-LiCF3SO3/LiTiS2
Small cell
1D ECM developed by Doyle et al. [98]
Eq. 15, Eq. 17
Song and Evan [120]
LiMn2O4/graphite Prismatic Eq. 14, Eq. 17
(2D) Gu and Wang
[122]
LiMn2O4/graphite Large size
lithium-ion cell for HEV/EV
applications
Eq. 14, Eq. 16
Gomadam et al. [121]
LiCoO2/graphite Prismatic Eq. 14, Eq. 16
Srinivasan and Wang [119]
LiMn2O4/graphite Small cell Eq. 14, Eq. 16
(2D) Smith and Wang
[116]
LiCoO2/graphite 72 cell battery
pack
Eq. 15, Eq. 16 (neglected
reversible heating) Kim and Smith
[109, 123]
LiMn2O4/graphite Cylindrical Eq. 14
(2D) Fang et al. [117] NMC/graphite Cylindrical Eq. 15, Eq. 16
(neglected reversible heating) Lee et al. [110] LiMn2O4/graphite Cylindrical Eq. 14
(3D) Cai and White
[124]
LiFePO4/graphite / Eq. 14, Eq. 16
Prada et al. [118] LiFePO4/graphite Cylindrical Eq. 15, Eq. 17
Baker and Verbrugge [125]
LiMn2O4/graphite Thin film 2D Eq. 14, Eq. 17
[image:23.595.51.550.73.718.2](2D)
(a) (b)
Figure 13: Heat generated due to various terms contributing to the total heat (a) under 2C discharge of a lithium-ion cell; and (b) under various discharge C rates [119].
For large-scale battery pack applied in HEVs and EVs, the collective thermal effects of electrochemical process are normally obtained from experiment measurements and therefore treating such battery pack as the heat source in a standalone thermal model is possible [126]. Examples are shown in Table 10, which established 1-3D decoupled thermal models where the heat generation was obtained from experiment. For such thermal model development, the heat is assumed to be generated within the solid domain (conductive heat transfer) and then be transferred to the surrounding medium at boundary surfaces (convection and radiation) (Fig. 14). Four assumptions can be made to estimate the battery thermal behaviour: 1) homogenous internal cell condition; 2) uniform temperature distribution of internal heat source; 3) no convection or thermal radiation exists inside the battery cell; 4) thermophysical properties are independent of temperature. However, the necessity of decoupling needs to be justified since discrepancies in predicting battery cell temperature can be found between thermo-electrochemical coupled and decoupled model. As reported by Gu and Wang [96], no temperature difference was detected under 1C charging and two convective heat transfer conditions (5, 25W/m2K), but discrepancies were noted under 1.5V float charging, especially at high percentage of normal cell capacity (Fig. 15).
Table 10. Standalone thermal models (decoupled) developed in various studies
Refs. Battery type (positive/negative electrode)
Configuration Thermal Model Heat generation method
Chen and Evans [127]
LiV6O13/Li Prismatic 2D ED
Chen and Evans [128]
LiTiS2/Li Prismatic 3D ED
Chen and Evans [129]
LiCoO2/graphite Prismatic 2D ED
Hallaj et al. [130, 131]
LiCoO2/graphite Cylindrical 1D ARC
Chen et al. [132] LiCoO2/graphite Cylindrical 3D ED
Onda et al. [133] LiCoO2/graphite Cylindrical 1D OCP
[image:24.595.54.550.548.749.2]Kim et al. [135, 136]
LiNiCoMnO2
/graphite
Prismatic 2D ED
Taheri et al. [126] Li[NiCoMn2]O2
/graphtie
Prismatic 3D ED
[image:25.595.195.436.179.347.2]Note: ED – Experimental data (such as over-potential and entropic heat coefficients to predict the heat generation rate); ARC – accelerated rate calorimeter; OCP – open-circuit potential;
Figure 14: Heat transfer from internal battery cell to the cell container surface and to the surroundings.
(a) (b)
Figure 15: Comparison of predicted cell temperature between thermo-electrochemical coupled and decoupled model during (a) 1C charging and (b) 1.5V float charging [96].
4.
Battery Thermal Management Strategies
4.1.
Design Considerations
[image:25.595.85.541.406.572.2]temperature higher than 70°C leads to cell failure. Pesaran [137] benchmarked the operating temperature for a variety of batteries including lead-acid, NiMH, and lithium-ion. He pointed out that the suitable range should be between 25°C to 40°C with a maximum of 5°C difference from module to module. He [138] later on demonstrated the temperature impact on life, safety and performance of lithium-ion batteries (Fig. 17) and suggested a range of 15-35°C as desired working temperature. Ladrech [139] also provided a temperature band for lithium-ion batteries obtained from suppliers and divided the range into four sections namely decline of battery capacity and pulse performance (0-10°C), optimal range (20-30°C), faster self-discharge (30-40°C), and irreversible reactions and short-circuit (40-60°C). According to Sato [115], charging efficiency and life cycle can be significantly reduced if the battery temperature exceeds 50°C. Khateeb et al. [140]showed that the thermal runaway of the lithium-ion cells initiates at the temperature range of 70-100°C jeopardising battery safety. Moreover, Lu et al. [141] made a detailed summary of stages that progress to thermal runaway and stated that the SEI breakdown starts at 80°C. These works all imply that the maximum working temperature for lithium-ion batteries should be kept below 40°C; and the minimum, above 15°C.
The heat sources and sinks can be identified from the effects of internal impedance and chemical reactions during charge or discharge. Precautions should be taken to avoid unexpected overheating or temperature rise that leads to cell failure. The cooling/heating methods available for EV and HEV batteries, in addition, are required to be considered separately as EV battery is more subject to low temperature rise, whereas HEV battery is likely to encounter high temperature rise. Fig. 18 explains the thermal problems EV and HEV will face by comparing them at the same battery handling power. EV operates at a deep discharge rate (1C) while HEV tends to operate at a very high rate (10C). As a result, EV battery may still need to be heated up at low temperature while HEV can have overheating problem even though they both dissipate the same amount of heat.
Figure 16: Battery thermal management mapping
Table 11: Suggested operating temperature range for lithium-ion batteries
Ref (s) Advised Temperature
Range for optimal performance (°C)
Battery type
Sato [115] <50 Lithium-ion
Pesaran [137] 25-40 Lead-acid, NiMH, and
Lithium-ion Panasonic [145] 0-45 for charge
-10-60 for discharge
Lithium-ion
Ladrech [139] 20-30 Lithium-ion
Pesaran et al. [138] 15-35 Lithium-ion
Figure 18: EV and HEV thermal & stress issues [146]
4.2.
Thermal Management Strategies
[image:28.595.108.541.161.542.2]C/LiFePO4 lithium-ion batteries. The microchannels were incorporated in either a thick current
collector or into a sheet of inert material which was placed in between a split current collector. Internal battery preheating, in addition, involves the use of self-internal heating and mutual pulse heating [87], or alternating current (AC) heating [92]. It is recognised that the internal BTM for lithium-ion batteries is limited and should be further explored due to the potential for higher temperature uniformity both within an individual cell and among cells in a pack.
BTM external to the batteries will be discussed extensively in this paper. It can be categorised into passive (only the ambient environment is used) or active (a built-in source provides heating and/or cooling), or based on medium [10, 142, 155]: 1) air for cooling/heating/ventilation; 2) liquid for cooling/heating; 3) phase change materials (PCM); 4) heat pipe for cooling/heating; and 5) combination of 1)-4).
4.2.1.
Air
Figure 20: (a) Insight pack [160]; (b) Prius pack [161]; and (c) Highlander pack [162] using air BTM.
[image:31.595.115.536.64.613.2]The 2000 Honda Insight [160, 164], 2001 Toyota Prius [160, 161, 164], and Toyota Highlander [162] utilise conditioned air taken from the cabin and exhausted to the ambient. Each battery pack (NiMH batteries) has unique module arrangement to mitigate temperature mal-distribution across the cells. Insight pack (Fig. 20 (a)) has a configuration similar to an aligned tube-bank and employs a small ‘muffin’ fan to force air convection between modules. Prius pack (Fig. 20 (b)) uses a parallel air flow scheme and the air is drawn by a 12-volt blower installed above the driver’s side rear tire well. The Highlander pack (Fig. 20 (c)), in addition, which is installed with three fans for separate module units help eliminate efficiency loss due to excessive heat. In the test conducted on Prius pack, the observed thermal gradient was 4-8.3ºC dependent on the blower speed and ambient temperature [161]. The surface temperature was monitored in a few discrete locations so the true maximum temperature differential was unknown. However, it is clear that air is not the best heat transfer medium to maintain excellent temperature uniformity for lithium-ion battery packs, which have more inherent safety risks than NiMH battery packs [10].
Improvements towards air BTM have been performed but with encountered difficulties. Nelson et al. [165] discussed that air cooling method was ineffective to cool the battery down to 52°C if initial battery temperature was higher than 66°C. Lou [166] designed a cinquefoil battery pack for NiMH batteries with aim of heat transfer enhancement. For such air thermal control method, making the temperature difference below 5°C seemed to be impossible and a high degree of temperature uniformity could be resulted between the location near and away from the fan. More recently, Mahamud and Park [144] proposed a reciprocating method in order to create a much uniform temperature profile mitigating the temperature gradient and this has been proven to be better than conventional unidirectional air cooling.
4.2.2.
Liquid
Figure 22: Liquid BTM using (a) refrigerant for battery cooling or (b) coolant for battery cooling/heating [163].
Figure 23: Tesla Roadster battery cooling (modified from [28, 62, 171, 172]).
[image:34.595.74.542.429.658.2]cooling system in Tesla Roadster uses water-glycol (1:1) mixture as coolant. A thermal interface (blue) is overmoulded onto the cooling tube forming a base below the battery pack (Fig. 23). This serves as a heat sink as the cooling liquid can be discharged in to provide efficient cooling. Improvements are suggested by Jarrett and Kim [174], who modelled serpentine-channel cooling plates in various geometries and concluded that ‘a narrow inlet channel widening towards the outlet’ is able to equalise the heat transfer achieving uniform temperature. Similarly, Faass and Clough [175] modified the cooling channel pathing geometry which produced an area of high turbulence and an area of low pressure drop. Jin et al. [176] proposed a novel minichannel liquid cold plate with oblique fins at optimised angle and width to cool EV batteries.
[image:35.595.55.546.461.756.2]Table 12 lists strengths and weaknesses offered by air, refrigerant, and coolant BTM. Air BTM is suitable for all type of cells, whereas liquid BTM that usually adopts cooling/heating plates within the assembled battery cells prefers prismatic or pouch cell geometry. To summarise, air cooling takes up more space, adds up more weight due to additional air ducts and blowers, consumes larger compressor, generates potential noise disturbance, and is less effective at maintaining a uniform temperature. If the battery demands a tighter temperature control especially in some hotter environments, air is not as competitive as liquid. However, for refrigerant-based cooling, the battery cannot be heated in winter. Indeed, similar to batter cooling, battery heating seems to be also very important cooling because the performance of a cold battery is sluggish and may directly affect vehicle mobility and driving range. Therefore, using coolant is much preferred in liquid BTM. The trade-offs, however, are requirement of large space, extra weight, and increased complexity due to additional pumps, valves, chiller, and radiators. The ultimate concern is to either invest in an expensive but relatively compact liquid coolant system with higher battery power output, or a cheap but bulky air cooling system with low performance of the same battery size. No surprising, many automobile manufacturers would rather go for a cheaper option, which is to construct a slightly larger battery pack with air cooling system.
Table 12: A comparison among air, refrigerant and coolant BTM
Advantages Disadvantages
Air cooling/heating
Suitable for all cell types Simple
Cheap
Battery heating in winter
Low heat transfer rate Ineffective temperature
uniformity
High space requirements Additional weight
problems
Potential noise disturbance
Refrigerant cooling
High heat transfer rate Allow battery to handle a
larger pulse of power
Effective temperature
uniformity
Low space requirements
No battery warming Electric shortage due to
liquid leakage
Coolant cooling/heating
High heat transfer rate Allow battery to handle a
larger pulse of power
Effective temperature
uniformity
Expensive (the most
costly)
Electric shortage due to
liquid leakage
Battery heating in winter Increased complexity and
weight
4.2.3.
PCM
Figure 24: (a) PCM BTM concept; (b) AllCell hybrid air/PCM system design [177].
[image:36.595.144.536.87.660.2]As an alternative method of direct liquid or air cooling/heating, researchers at Illinois Institute of Technology [140, 143, 178-181] pioneered a new passive BTM solution by using phase change material (PCM) (Fig. 24). A PCM normally has a large latent heat of fusion and a desirable melting point that can store or release large amounts of heat. The heat transfer route starts from the battery, which generates heat, and goes to the PCM and then to the battery case in contact with the ambient air. PCM eliminates the need for active cooling/heating during the majority of operating time because it delays the temperature rise when the ambient is cold and maintains the battery below ambient during hot days (Fig. 25). The battery module used in Fig. 24 was the commercial cylindrical 18650-lithium-ion-cells surrounded in a rectangular enclosure. The PCM is a paraffin wax with a melting temperature range from 40°C to 44°C and a latent heat of melting/solidification of 195 kJ/kg. The wax fills the voids in between the cells with solid and liquid phase densities of 822 and 910 kg/m3, respectively. This reflects the lightweight advantage and material flexibility of the PCM. Rao et al. [182] listed the major criteria in selecting proper PCMs for BTM, and melting point comes to the first. This value should, as a matter of fact, be chosen in the range of the operating temperature that a battery desires. They stated that it is preferable to have a PCM with melting temperature below 45°C and a desired maximum temperature below 50°C to achieve effective heat dissipation and improved temperature uniformity across the whole battery unit.
In the study of Khateeb et al. [180], data showed that using PCM (paraffin wax), the centre cells temperature rised by 26.25-30°C while the edge cells rose only by 18.75-22.5°C. This indicates the poor thermal conductivity of PCM, and hence, it did not melt uniformly. The PCM near the centre cells was completely melted during the first discharge cycle, but those that near the cooled walls did not start melting until the third discharge cycle. If the PCM completely melts, an additional thermal resistance between the cooling fluid and the batteries will be created, leading to a worse situation than direct air cooling. Low thermal conductivity also becomes problematic when it comes to battery preheating in cold environments, and the thermal gradient among the cells can be huge if externally warmed. More importantly, the volume expansion after melting is inevitable, so additional volume spacing between the battery cells is required and leak-proof design to avoid PCM liquid leakage is crucial.
To reduce the thermal gradient inside the battery pack and solve the conflict between large heat storage capacity and low thermal conductivity (0.25 W/mK for paraffin wax), many approaches towards making composite PCMs have been conducted and they include 1) embedding a metal matrix into PCM; 2) impregnating porous materials [183-187]; 3) adding high thermal conductivity substances in paraffin [188, 189]; and 4) developing latent heat thermal energy storage systems with unfinned and finned structures [190-192]. The improved thermal conductivity for the composite PCM (PCM/graphite matrix) from references [140, 180, 181] ranges from 3 W/mK to 16.6 W/mK. Examples of using composite PCM in vehicular applications have been summarised in Table 13. However, the thermal conductivity increases at the cost of decreased latent heat storage capacity. In order to achieve a good performance, a proper thermal conductivity ratio between PCM and battery cells (kpcm:kc) must be ensured [182]. Moreover, with aim of eliminating battery safety risks, PCM properties such as stability, non-poisonous, non-flammable and non-explosive are critical. That is, a stable and stronger PCM based battery module to resist thermo-mechanical effects during operation is required. Alrashdan et al. [193] undertook a systematic experiment analysing the effects of the thermo-mechanical behaviours of paraffin wax/expanded graphite composite PCM for lithium-ion batteries. They observed that the increased percentage of paraffin wax will enhance tensile, compressive and burst strengths at room temperatures, but not so obvious under elevated temperatures.
Applications Ref(s) Composite PCM properties
For a large lithium-ion battery pack targeting at HEV/EV applications
Khateeb et al. [140] (electric scooters)
PCM/aluminium foam:
keff = kpcmε+(1-ε)kal, ρeff = ρpcmε+(1-ε)ρal,
cp = cpε+(1-ε)cp,al, h= 195 kJ/kg Sabbah [181]
PCM/graphite matrix:
keff = 16.6 W/mK, ρeff = 866 kg/m3, cp = 1,980 J/kgK, Tm = 52-55ºC, heff = 181 kJ/kg
AllCell Technologies LLC
(AllCell®) [194]
PCM/graphite matrix module
Kizilel et al. [143]
PCM/graphite matrix:
keff = 16.6 W/mK, ρeff = 789 kg/m3, cp = 1,980 J/kgK, Tm = 42-45ºC, heff = 123 kJ/kg
Li et al. [195] PCM/copper metal foam:
keff = 11.33/6.35/0.8 W/mK from different samples
For a comparison study based on a simulated single
cylindrical battery cell
Duan [196]
PCM 1 provided by the Glacier Tek Inc.:
kpcm = 0.55 W/mK, ρpcm = 840 kg/m3, cp = 2,100 J/kgK, Tm = 18ºC, hpcm = 195 kJ/kg;
PCM 2 by Laird Technologies: kpcm = 2.23 W/mK, cp = 1,390 J/kgK, Tm = 50ºC
For cylindrical NiMH and rectangular lithium-ion batteries
Rao [182, 197, 198]
PCM/graphite matrix:
parameters collected from references – not specified, ρpcm = 910 kg/m3, Tm = 50ºC
4.2.4.
Heat Pipe
The combination of heat pipe and air cooling was adopted in early studies. For instance, Swanepoel [203] proposed to use pulsating heat pipes (PHPs) to thermally manage Optima Spirocell lead acid batteries and control HEV components. Simulation and experiment results showed that a well-designed PHP system required the diameter of the heat pipe to be less than 2.5mm and ammonia as working fluid. Wu et al. [204] suggested to use the heat pipes with aluminium fins to cool a large-scale lithium-ion battery but difficulties in heat dissipatlithium-ion at the battery centre were found if no cooling fan at the condenser section was provided. Jang and Rhi [205] used a loop thermosyphon cooling method which also combined the heat pipe with air cooling. Barantsevich and Shabalkin [206] introduced the testing aspects of ammonia axial grooved heat pipes to thermally control the solar battery drive, and Park et al. [207] obtained a numerical optimisation for a loop heat pipe to cool the lithium-ion battery onboard a military aircraft. More recently, Burban et al. [208] tested an unlooped PHP (2.5mm inner tube diameter) with an air heat exchanger for cooling electronic devices in hybrid vehicles (Fig. 26). Steady state and transient performance with a hybrid driving cycle (New European Driving Cycle) were conducted and various heat pipe working fluids, inclinations, and different air speeds were investigated. Moreover, Tran et al. [209] proposed a flat heat pipe for cooling HEV lithium-ion batteries under natural and forced convection and highlighted the thermal performance under various heat pipe positions (Fig. 27).
The combination of heat pipe and liquid cooling is scarce and the example can only be found in Rao et al. [210], who experimentally examined the heat pipe based battery cooling for commercial prismatic LiFePO4 batteries. The condenser of the heat pipe was cooled by a water bath at 25±0.05°C
[image:39.595.71.496.490.637.2](Fig. 28). It seems that the heat pipe has the potential of handling increased heat flux more efficiently than the conventional heat sink, but the feasibility of applying heat pipes into vehicle batteries needs to be further examined. Factors such as cost, weight, mass production, material compatibility, transient behaviour under high frequency and large amplitude variable input power, and thermal performance degradation influenced by vehicle shock and vibration should be evaluated. Unlike air and liquid BTM, heat pipe BTM is still under initial development. It is therefore encouraged that the research may be extended at pack level such that the impact of thermal accumulation from various cycle performances could be fully understood.
![Table 2. The major components of lithium-ion batteries and their properties [25, 26]](https://thumb-us.123doks.com/thumbv2/123dok_us/8662595.375457/4.595.55.521.573.752/table-major-components-lithium-ion-batteries-properties.webp)
![Figure 4: Lithium-ion battery cell-, module-, and pack-level demonstrated by two vehicle examples: Tesla Roadster [28, 29] and Nissan Leaf [30]](https://thumb-us.123doks.com/thumbv2/123dok_us/8662595.375457/7.595.72.546.417.718/figure-lithium-battery-demonstrated-vehicle-examples-roadster-nissan.webp)
![Table 4: Thermal stability of components used in a lithium-ion battery (values measured with differential scanning calorimetry on electrodes) [26]](https://thumb-us.123doks.com/thumbv2/123dok_us/8662595.375457/10.595.95.501.592.733/thermal-stability-components-measured-differential-scanning-calorimetry-electrodes.webp)
![Figure 6: Illustrating three stages of the thermal response (thermal runaway path) obtained from SONY/GEN1/GEN2 lithium-ion cell [67]: (a) Stage 1-2 in scope; (b) Stage 3](https://thumb-us.123doks.com/thumbv2/123dok_us/8662595.375457/12.595.55.553.402.751/figure-illustrating-thermal-response-thermal-runaway-obtained-lithium.webp)
![Figure 7: Dual lithium-ion insertion cell sandwich structure developed by [99].](https://thumb-us.123doks.com/thumbv2/123dok_us/8662595.375457/16.595.56.543.61.659/figure-dual-lithium-insertion-cell-sandwich-structure-developed.webp)
![Figure 9: Thermal-electrochemical coupled modelling approach [96].](https://thumb-us.123doks.com/thumbv2/123dok_us/8662595.375457/19.595.66.539.146.615/figure-thermal-electrochemical-coupled-modelling-approach.webp)
![Figure 11: Coupled thermal-electrical model for an A123 LiPO4/graphite battery [111].](https://thumb-us.123doks.com/thumbv2/123dok_us/8662595.375457/20.595.152.444.72.240/figure-coupled-thermal-electrical-model-lipo-graphite-battery.webp)
![Figure 12: A comparison of thermal energy generated using local heat generation and lumped thermal models under adiabatic conditions [119]](https://thumb-us.123doks.com/thumbv2/123dok_us/8662595.375457/23.595.51.550.73.718/figure-comparison-thermal-generated-generation-thermal-adiabatic-conditions.webp)
