Contents lists available atScienceDirect
Journal of Controlled Release
journal homepage:www.elsevier.com/locate/jconrel
3D inkjet printing of tablets exploiting bespoke complex geometries for
controlled and tuneable drug release
Mary Kyobula
a, Aremu Adedeji
b, Morgan R. Alexander
a, Ehab Saleh
b, Ricky Wildman
c,
Ian Ashcroft
d, Paul R. Gellert
e, Clive J. Roberts
a,⁎aDivision of Advanced Materials and Healthcare Technologies, School of Pharmacy, The University of Nottingham, NG7 2RD, UK bEPSRC Centre for Innovative Manufacturing in Additive Manufacturing, School of Engineering, UK
cDepartment of Chemical and Environmental Engineering, School of Engineering, UK
dDepartment of Mechanical, Materials and Manufacturing Engineering, School of Engineering, The University of Nottingham, NG7 2RD, UK eAstra Zeneca, Silk Road Business Park, Macclesfield, Cheshire SK10 2NA, UK
A R T I C L E I N F O
Keywords:
3D inkjet printing Hot-melt Solid dosage forms Controlled release
A B S T R A C T
A hot melt 3D inkjet printing method with the potential to manufacture formulations in complex and adaptable geometries for the controlled loading and release of medicines is presented. Thisfirst use of a precisely con-trolled solvent free inkjet printing to produce drug loaded solid dosage forms is demonstrated using a naturally derived FDA approved material (beeswax) as the drug carrier and fenofibrate as the drug. Tablets with bespoke geometries (honeycomb architecture) were fabricated. The honeycomb architecture was modified by control of the honeycomb cell size, and hence surface area to enable control of drug release profiles without the need to alter the formulation. Analysis of the formed tablets showed the drug to be evenly distributed within the beeswax at the bulk scale with evidence of some localization at the micron scale. An analytical model utilizing a Fickian description of diffusion was developed to allow the prediction of drug release. A comparison of ex-perimental and predicted drug release data revealed that in addition to surface area, other factors such as the cell diameter in the case of the honeycomb geometry and material wettability must be considered in practical dosage form design. This information when combined with the range of achievable geometries could allow the bespoke production of optimized personalised medicines for a variety of delivery vehicles in addition to tablets, such as medical devices for example.
1. Introduction
In many societies, especially those with an increasingly elderly population there has been a significant increase in the number of pa-tients suffering from multiple chronic illnesses and hence an increase in treatment regimens where patients are required to take many medicines several times a day[1,2]. Such complex regimes tend to lower patient compliance and adherence to the medicine regime. Most clinical therapies are based on the“one drug, one dosefits all”approach[3], however, due to individual differences such as age, genetic makeup, environmental factors and physiological body conditions, drug response can vary in patients and hence treatment maybe suboptimal[4]. These challenges illustrate the need for the consideration and development of manufacturing approaches for medicines tailored for individual patient needs. 3D printing (or additive manufacturing) has been proposed by a number of authors as being a method that could address this situation [5–9].
Here we demonstrate, for the first time, the use of a 3D inkjet printing (3DP) technique to manufacture a viable and tuneable phar-maceutical dosage form. The use of an ink-jet approach, rather than the more typically used extrusion[7]and powder layering approaches[10] facilitates a spatial resolution of up to 50μm and ability to facilitate the co-deposition of multiple inks contemporaneously[11–13]. The high spatial resolution is attained via the deposition of very small volumes (picolitres) of formulation ink and offers the advantage of accurate delivery and the spatial localization of materials. These capabilities have been exploited in life science, drug delivery and genomics[14,15]. The recent FDA approval of a 3DP powder-layered tablet SPRITAM®in 2015 [16], and recent advances in the printing of medicines with multiple active pharmaceutical ingredients [5,6,17], have already proven 3DP as a key technology in the manufacturing of solid dosage forms. Hence, 3D inkjet printing could enable the delivery of accurate doses, which is highly desirable when handling potent drugs and in the paediatric population where the dose adjustment is required based on
http://dx.doi.org/10.1016/j.jconrel.2017.06.025
Received 6 March 2017; Received in revised form 24 June 2017; Accepted 26 June 2017 ⁎Corresponding author.
E-mail address:[email protected](C.J. Roberts).
Available online 28 June 2017
patient age, body mass and clinical conditions[18].
An additional benefit of such high-resolution control of dosage form composition is the potential customization of release profiles. This would be highly desirable when managing long-term illnesses such as hypertension and anti-depression for optimum therapeutic reasons [19–22]. Traditionally, controlled and variable drug release is achieved through the use of different polymer formulations and the use of barrier
films[23–26]. This can, however, be associated with rather complex multi-component formulations and a burst release of the drug whereby a high release rate is attained initially due to the dissolution of the drug present at the surface, which may cause a negative therapeutic effect and toxicity[27]. 3D printing offers an alternative route where, dosage form geometry and hence surface area alone can be used to control drug release from a solid matrix [28–31]. This would be a relatively straightforward and generic way of achieving customizable release profiles, but geometry control alone has limitations. For example, if we assume that drug elution is dictated by Fickian diffusion through the tablet, then if there are no changes in boundary conditions or geometry, the rate of drug will always decrease as the concentration gradient between the tablet surface and environment decreases. However, on the positive side, when tuning drug release via geometry there is no need to alter the formulation composition, manufacturing process or equipment that could significantly reduce production cost and time. Simple geo-metries can easily be produced using traditional manufacturing routes such as tablet press but this is largely limited by the lack of geometry
flexibility. In comparison 3D inkjet printing offers great geometry
flexibility whilst keeping low marginal costs when design changes are implemented[32–35]. Moreover, 3D inkjet also provides the potential to modify the initial distribution of the drug within the tablet, which can potentially address the issue described above with solely depending on geometry to control drug release rates. Although, it should be noted that to simplify matters, this initial study will investigate the effect of geometry alone, with drug distribution being investigated in future work.
Hence, the primary objective of this study was to develop a 3D hot-melt inkjet printing method suitable for fabricating solid dosage forms with variable complex geometries at high spatial resolution for the achievement of variable and predictable drug release profiles. A sec-ondary objective was to develop an analytical solution to model the drug release profile so that the drug release mechanism could be better understood. Such a model, when developed fully, could in the future be used to define the geometry required to produce a clinically required drug release profile. Honeycomb geometry tablets were printed to de-monstrate our primary objective. Beeswax, a biocompatible, safe and FDA approved excipient was used as the drug carrier[36–38]. Beeswax has been exploited in pharmaceutical formulations, such as nano-particles for controlled drug delivery[39]. Fenofibrate which is prac-tically insoluble and is used for the treatment of hypertriglyceridemia, mixed dyslipidemia and hyper-cholesterolemia was used as an example drug [40]. This is hence a solvent free process. According to the in-ternational conference on harmonisation (ICH) guidelines Q3C [41], only a limited number of solvents meet regulatory requirements due to toxicological reasons[42]. Therefore this solvent-free 3D inkjet printing method eliminates the need for a rigorous solvent selection step.
Whilst 3D printing of tablets has been demonstrated previously using a variety of methods such as extrusion, powder based method and fused deposition modelling [5,28,43], this work represents a novel approach to the use of 3DP for dosage form manufacture.
2. Materials and methods
2.1. Materials
White beeswax was kindly donated by Cornelius Group plc (Stortford, Herts, UK). Fenofibrate, potassium phosphate monobasic (ACS reagent≥99%) and sodium phosphate dibasic were purchased
from Sigma Aldrich, (UK). Sodium lauryl sulphate was purchased from Fisher Scientific UK Ltd.
2.2. Preparation and printing of the mixture
A mixture containing 5% w/w fenofibrate was prepared by melting beeswax (19 g) and fenofibrate (1 g) using a magnetic stirrer hotplate at 90 °C. The melt was immediately transferred to the piezoelectric inkjet printer (PiXDRO LP50, Meyer Burger)fitted with a hot melt chamber and a printing head with 128 nozzles (Spectra® SE-128 AA, Fujifilm Dimatix, Santa Clara, USA). The diameter of the nozzles was 35μm and the nozzle spacing was 508μm. The temperature of the hot melt chamber and printing head was set at 90 °C to maintain the mixture in the molten state and to optimize the printability. Afiring voltage of 90 V was applied. Printing was done on polyethylene terephthalate (PET) substrate with a set temperature of 40 °C.
2.3. X-ray micro computed tomography
X-ray micro-CT scanning was performed using a phoenix v |tome | x m (GE Sensing & Inspection Technologies GmbH, Wunstorf, Germany). The scanner consisted of a 240 kV microfocus X-ray tubefitted with a tungsten transmission target and a DXR-250 detector. A maximum X-ray energy of 65 kV and 130μA was used to scan each sample. Images were acquired using a fast scan mode. A total of 2878 projection images were acquired over a 360° rotation and 250 ms detector exposure time per projection image. 3-D volumetric data sets were obtained by re-construction of the projection images using datos | rec software (GE Sensing & Inspection Technologies GmbH). A volume analyser tool in VG StudioMAX®2.2 (Volume Graphics GmbH, Heidelberg, Germany) was used to visualise the reconstructed CT images.
2.4. Differential scanning calorimetry (DSC)
Standard DSC measurements were performed with a Q2000 DSC (TA instruments, Waters, LLC, USA) at a heating rate of 10 °C/min. The sample mass was between 5 and 10 mg and the analysis was carried out using hermetically sealed aluminium pans with lids. Calibration was with indium (Tm= 156.6 °C ± 0.5 °C), ΔHf= 28.71 ± 5% J/g). Nitrogen was used as a purging gas with aflow rate of 50 mL/min. Data was collected with TA Advantage software and analysed using TA Instruments Universal analysis 2000.
2.5. Time offlight–secondary ion mass spectroscopy (ToF-SIMS)
intensities were normalized to the total ion count of the spectra.
2.6. Raman spectroscopy
Raman spectroscopy was performed using a HORIBA Jobin Yvon LabRAM HR spectrometer equipped with an automated xyz stage (Märzhäuser). Spectra were acquired using a 785 nm laser at 25 mW power, a 50 × objective and a 300μm confocal pinhole. To simulta-neously scan a range of Raman shifts, a 600 lines/mm rotatable dif-fraction grating along a path length of 800 mm was employed. Spectra were detected using a SYNAPSE CCD detector (1024 pixels) thermo-electrically cooled to −60 °C. Before the spectra collection, the in-strument was calibrated using the Rayleigh line at 0 cm−1 and a standard Si (100) reference band at 520.7 cm−1. Raman spectra of the reference materials (pure beeswax and fenofibrate) were acquired from 100 to 4000 cm−1,with 5 s and 16 accumulations per spectral window. During mapping, spectra were collected between 860 and 1540 cm−1 across an area of 250 × 250μm with a grid spacing of 2μm along both the x and y axes, a total of 15,876 spectra per map. As each individual spectrum was collected for 2 s, repeated once in order to automatically remove spikes due to cosmic rays, the whole map required approxi-mately 18 h. Componentfitting was conducting using the classic least squares (CLS) regression analysis functionality in Labspec 6.
2.7. In vitro drug release studies
In vitro drug release studies were undertaken using a United States Pharmacopeia (USP) type 2 apparatus (Dissolution-Erweka Dt600 Dissolution Tester). In each assay the tablet was placed in a vessel containing 0.1 M phosphate buffer (500mls), at pH 7.40, 37 ± 0.5 °C and the dissolution medium was stirred at 50 rpm. The dissolution medium also contained 0.05 M sodium lauryl sulphate to facilitate the wetting process. Samples (5 ml) were withdrawn at hourly intervals for 12 h and a fresh dissolution medium (5 ml) at 37 ± 0.5 °C was re-placed each time to maintain a constant volume in the dissolution vessels. All samples were filtered through a 0.45μm MF-millipore membrane filter (MILLEX ®HA) and analysed by a UV–vis spectro-photometer (DU®800 Series UV/Vis Spectrophotometer, Beckman Coulter, UK) at 290 nm. All dissolution tests were done in triplicate and the average of the percentage cumulative drug release as a function of time was determined.
2.8. Investigating the effect of cell diameter on wetting
The dissolution medium (100μL) containing 0.1 M phosphate buffer (pH = 7.4) and 0.05 M sodium lauryl sulphate was pipetted con-tinuously onto a honeycomb tablet (cell diameter = 0.2 mm) sus-pended on top of an open eppendorf tube to allow the medium toflow freely through the cells. The time it took for the medium to flow through the tablet, onfirst application (before wetting) was recorded. Using the same honeycomb, a fresh medium (100μL) was pipetted and the time it took for the medium to flow through the honeycomb on second application (after wetting) was recorded. The same procedure was repeated for honeycomb tablets with cell diameters 0.41, 0.61, 1.22 and 1.83 mm. All the honeycombs used in this study had the same height of 3.22 mm.
3. Results and discussion
3.1. Printed tablets and their physical characteristics
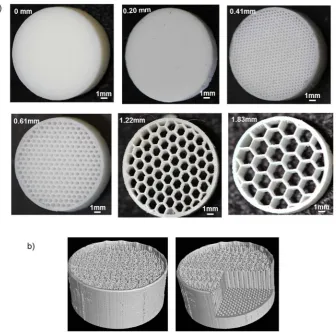
Tablets with honeycomb architecture were printed and the honey-comb cell diameters were varied between 0.20 mm and 1.83 mm (Fig. 1a). Diameters larger than 1.83 mm were also explored, however, beyond this diameter, the honeycomb tablets were relatively fragile and were deemed unacceptable for normal handling. Conventionally shaped
solid (circularly cylindrical) tablets were also printed for comparison purposes (cell diameter defined as 0 mm for modelling purposes). Vi-sually the tablets were well-defined, smooth surfaced and with no ap-parent defects.
Fig. 1b shows the interior structure of the honeycombs visualised using micro X-ray computed tomography. TheμCT scans show that the honeycomb tablets had well-defined and ordered honeycomb channels. Such precision was achieved due to the high spatial resolution attained via the deposition of very small volumes, in the range of picolitres, when using the ink jetting technique[44].
Tablets were printed with a constant weight of 100 mg and afixed tablet diameter of 10 mm, aimed at maintaining the same drug content. Due to this restricted tablet diameter and mass, the height of the tablets varied between 9.73 mm (for the largest cell diameter, 1.83 mm) and 1.98 mm (solid, no cells) (Table 1). This can be explained by the fact that as the cell size decreases, the number of honeycomb channels printed (packed) within the restricted diameter increases. As a result, at smaller cell diameters, tablets were printed with relatively reduced height but the same weight as tablets with larger cell diameter.
In the case of the honeycomb geometry, the open honeycomb channels provide a path for the dissolved drug, the length of the channels will therefore affect the drug delivery surface area (SA) and hence the rate of drug release. In order to investigate this effect a batch of tablets was printed with the length of the channelsfixed by printing tablets with constant height of 3.22 mm, which is a comparable height to tablets on the market. When the tablet height wasfixed, the SA/V ratio (where volume, V, is proportional to mass of drug with afixed concentration) of the honeycomb like tablets increased in a controlled manner with decrease in cell diameter (Table 2). It was noted that the honeycomb cell diameters of the printed tablets did not differ sig-nificantly from the diameters in the geometry design specification. The geometrical properties of the printed tablet with constant mass and height are shown inTables 1 and 2respectively.
3.2. Differential scanning calorimetry
The DSC thermograms obtained for fenofibrate, beeswax, and the printed mixture with 5% w/w fenofibrate are shown inFig. 2. Fenofi -brate thermogram (red) presented a sharp endotherm at 81.4 ± 0.2 °C, consistent with the distinctive melting point previously observed for Form I, which is the most stable crystalline form compared to the me-tastable Forms II and III [45–47]. The beeswax thermogram (blue) showed a broad peak, with complete melting occurring at 63.0 ± 0.1 °C. In addition polymorphic phase transitions between 40 °C and 50 °C were observed in the beeswax thermogram. The ob-served beeswax thermogram trace was in relatively good agreement with data reported in the literature[48,49].
3.3. Time offlight–secondary ion mass spectroscopy surface and depth analysis
In order to understand if the drug was evenly distributed, the mi-croscale distribution of the drug in the beeswax matrix was in-vestigated. Firstly spatial mapping of the drug at the upper most surface (1–2 nm) and within the bulk (near surface) as a function of depth was
achieved using ToF-SIMS. Positive and negative ToF-SIMS spectra were acquired. The negative spectra showed characteristic ion-fragment peaks for the fenofibrate ion C13H8ClO2− at m/z= 231 and for beeswax atm/z= 367 (Fig. 3a). ToF-SIMS images were retrospectively reconstructed to assess the spatial distribution of the C13H8ClO2−ion in the XY coordinate (Fig.3b) and YZ coordinate (Fig. 3c). The XY data in Fig. 3b showed that at the micro-scale level, the fenofibrate fragment ion (C13H8ClO2−) was heterogeneously distributed at the surface. Such microscale localization of a drug is not uncommon in dispersions of drugs in pharmaceuticals[54].
[image:4.595.44.381.55.391.2] [image:4.595.309.556.402.564.2]Fig. 3c illustrates a clear contrast between the upper most surface, with relatively lower drug ion intensity, and the bulk (near-surface), with higher ion intensity. As shown inFig. 3d, the intensity of drug ion Fig. 1.a) Photographs of the printed solid tablet and hon-eycomb -like tablets with varying cell sizes between 0.20 mm and 1.83 mm. b) 3DμCT scan images obtained for the honeycomb architecture tablets, the right hand image has a digital cut-away.
Table 1
Geometric properties of tablets printed (with constant weight = 100 mg).
Geometry Digital design cell diameter [mm]
Printed tablet cell diameter [mm]
Tablet height [mm]
Tablet surface area [mm2]
SA/V ratio
Honeycomb 1.827 1.78 ± 0.08 9.73 ± 0.029 1821 5.25 Honeycomb 1.218 1.17 ± 0.03 7.61 ± 0.01 1970 5.30 Honeycomb 0.609 0.62 ± 0.01 4.82 ± 0.08 2045 5.87 Honeycomb 0.406 0.34 ± 0.02 3.27 ± 0.04 2410 7.07 Honeycomb 0.203 0.19 ± 0.01 2.01 ± 0.04 2108 5.80
Solid tablet 0 0 1.98 ± 0.02 219 1.41
Table 2
Geometric properties of printed tablets (with constant height = 3.22).
Geometry Digital design cell diameter [mm]
Printed tablet cell diameter [mm]
Tablet surface area [mm2]
Tablet diameter [mm]
SA/V ratio
Honeycomb 1.827 1.78 ± 0.08 624 10.13 ± 0.03 5.44 Honeycomb 1.218 1.17 ± 0.03 870 10.12 ± 0.03 6.26 Honeycomb 0.609 0.62 ± 0.01 1574 10.12 ± 0.03 6.76
Solid tablet 0 0 258 10.12 ± 0.03 1.02
increased with increase in depth (over a depth of approximately 2.5μm) and then became constant, suggesting a uniform distribution of the drug ion beyond the immediate surface and therefore for the vast bulk of the tablet. It is anticipated that the depletion of drug at the very surface is due to the formation of crystalline regions of beeswax systems at the surface which occurs during the cooling process (Fig. SI-1). This is typically termed as an efflorescence phenomenon and becomes more apparent in the presence of impurities, in this case drug particles [55,56]. The drug is excluded from the crystalline regions leading to the observed uneven distribution of the drug at the surface. Longer-term stability studies beyond the remit of this work are required to assess whether the microscale heterogeneity observed at the surface infl u-ences the physical instability and crystallisation of the drug, an im-portant consideration when developing commercial dosage forms.
3.4. Raman spectroscopy
Raman spectroscopy was used to gain further understanding of drug distribution. The beeswax Raman spectrum (Fig. 4a) contains promi-nent vibrational modes at 1063 (ν(CC) stretch), 1131 (δ(CH) chain deformations), 1296 (δ(CH2)2deformation), ~ 1440 (δ(CH2) deforma-tions) and ~ 2880 cm−1(ν(CH) stretches), consistent with the complex
composition of beeswax of various saturated and unsaturated hydro-carbons, esters and free fatty acids, including the known major com-ponent triacontanyl palmitate, and is analogous to previous literature reports[57]. The Raman spectrum obtained for fenofibrate (Fig. 4a) contains numerous bands in thefingerprint region and CH stretching regions with diagnostic vibrational modes at ~ 1590 cm−1(ν(C]C) in-plane aromatic ring stretches) and 1650 cm−1(ν(C]O) stretch). The Raman spectrum obtained for the printed beeswax-fenofibrate mixture (Fig. 4a), collected at a single random location, was comprised of a superposition of both beeswax and fenofibrate, dominated by the vi-brational modes of beeswax consistent with its higher concentration in the formulation, with no significant shifts in the position of the com-ponent bands in the mixture relative to the isolated comcom-ponents, in-dicating little to no structural changes to either beeswax or fenofibrate upon mixing and subsequent printing.
[image:5.595.99.494.55.316.2]Furthermore, Raman spectroscopic mapping across an area of 250μm × 250μm of the printed mixture and subsequent chemometric data analysis (Fig. 4b) showed that fenofibrate was uniformly dis-tributed in the bulk (red colour 4–6% of the total composition of the mixture variable as a function of specific location by classic least squares regression analysis within the beeswax (blue). It is important to note that the penetration depth of the laser is of the order of ~ 20μm Fig. 3.ToF-SIMS data. a) ToF-SIMS mass spectrum for the printed beeswax-fenofibrate mixture b) ToF-SIMS chemical map showing the distribution of the fenofibrate fragment ion (C13H8ClO2−) at the surface in the XY coordinate. c) ToF-SIMS chemical map showing the distribution of C13H8ClO2−in the YZ coordinate. d) ToF-SIMS depth profile showing the increase in the intensity of C13H8ClO2−(red) as a function of depth. (For interpretation of the references to colour in thisfigure legend, the reader is referred to the web version of this article.)
[image:5.595.40.389.618.738.2]and thus the displayed chemical map is more representative of the underlying bulk, rather than the surface structure. Therefore Raman spectroscopy and ToF-SIMS depth profile data provide complementary evidence for the uniform distribution of the drug within the bulk of the printed structure.
Fig. 4b provided evidence that at this micron scale, the drop like deposition of material used in 3DP was retained to an extent in the micro-scale architecture of the tablet surface.
3.5. In vitro drug release studies
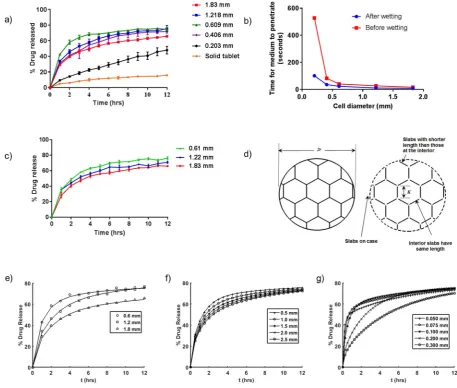
All the printed tablets contained 5% w/w fenofibrate, chosen on the basis of drug release performance. Mixtures with higher drug loading (10–25% w/w) were also printed without compromising geometry, but higher drug loading resulted in relatively slower drug release (Fig. SI-2). This suggests that some of the drug is in its crystalline state at these higher loadings, a commonly observed phenomena in the attempted formation of solid dispersions at higher drug loadings. Some authors have suggested that at such high drug loadings, the dissolution per-formance is mainly governed by the physicochemical properties of the drug (low aqueous solubility and hydrophobicity)[58,59]. The release of fenofibrate from printed tablets into 500 mL of phosphate buffer at pH 7.40, and 37 °C is illustrated in Fig. 5a. The honeycomb tablets
showed higher release rates in comparison to the solid tablet, attributed to the increase in the surface area associated with the geometry. The change in the release profile due to geometry modification from solid (circular disk) to the honeycomb geometry clearly shows the potential to manipulate and define drug release profiles. In the case of the hon-eycombs, the mass of the tablet and the thickness of the walls were kept constant but the cell diameter and the height of the tablets were varied. As shown in Fig. 5a, honeycombs with cell diameters ≥0.41 mm showed similar release profiles, but the optimum (greatest) release was obtained with a cell diameter of 0.61 mm. Since a key variable in de-termining the drug release rate is the available surface area, it was expected that reducing the cell diameter would show an increase in the release rate. However, the release profile obtained for the honeycomb with the smallest cell diameter (0.20 mm) was slower than expected and substantially below that observed for tablets with significantly lower surface area/volume ratios. This is proposed to be due to the effect of poor wetting through the relatively hydrophobic beeswax channels of the smaller pores.
[image:6.595.66.524.312.700.2]To assess this proposed poor wetting effect, the average time for 100μL of the dissolution medium toflow through the honeycomb ta-blets on first application (before wetting) and a second application (after wetting) was determined and this is illustrated inFig. 5b. It was observed that below a certain size (< ca. 0.5 mm), the cell diameter
inhibited wetting. The speed offlow (wetting) remained approximately constant until this critical cell diameter was reached. In comparison to the other honeycombs, the rate offlow through the honeycomb tablet with the smallest diameter (0.2 mm) was significantly reduced and this was more noticeable before wetting. Based on this observation it was inferred that when dry honeycomb tablets with very small cell dia-meters (< ca. 0.5 mm) are immersed in a dissolution media, it takes longer to completely wet their surfaces. For this particular honeycomb architecture, the observed wetting effect is consistent with the reduc-tion in the release rate despite the increase in surface area in the case of smaller cell sizes (0.2 mm and 0.4 mm). It should be noted that the SA/ V for the honeycomb tablet with cell diameter of 0.2 mm was lower than expected. This is attributed to the reduction in the accuracy of the printed geometry (due to the distortion of the hexagonal shape of the cells) which was observed at this smallest cell diameter (Fig. SI-3). This clearly indicates a lower limit of cell size for structural integrity for this material and printer combination.
3.6. Effect of geometry (surface area/volume ratio) on drug release
Fig. 5c shows the effect of surface area to volume ratio (SA/V) on drug release. The investigation was carried out using honeycomb like tablets with a cell diameter above the established critical cell diameter (ca. 0.5 mm). In this study, the height of the honeycombs tablets and the thickness of the cell wall werefixed and the surface area to volume ratio was increased uniformly via a decrease in cell diameter. The rate of drug release increased as expected with increasing SA/V in the order of cell diameter 0.61 > 1.12 > 1.83 mm. This evidence demonstrates that geometry can be used to control the release profile but geometry configurations must be carefully selected. For the honeycomb geo-metry, it appears that both the cell diameter and surface area to volume ratio play a significant role, but if the cell diameter is sufficiently large enough to allow a significant rate offlow of the dissolution medium, SA/V becomes the controlling variable.
3.7. Drug release mechanism and prediction of drug release
In vitro release data obtained for the honeycomb tablet with the highest drug release (0.61 mm) wasfitted tofirst order, Higuchi[60], and Korsmeyer-Peppas kinetic models[61]using Microsoft excel 2013. The most significant fit to the data was observed with Korsmeyer-Peppas model (Eq.(1)), with R2= 0.98 and exponentn= 0.31 (Fig. SI-4). A study of dependent variables from a full factorial design to cal-culate degrees of freedom [62] was not carried out in this work, nevertheless the use of R2as a useful guide is not uncommon in the literature[63].
= ∞ M M Kt t n (1) whereMt/M∞is a fraction of drug released at timet,Kis the release rate constant andnis related to the diffusion mechanism. Additionally it was observed that the tablets remained intact during the dissolution studies, with no observable swelling or change in shape or size occur-ring duoccur-ring the dissolution studies. These observations suggest a Fickian diffusion controlled drug release mechanism, as has previously been observed for similar non-degrading matrices[64].
In order to illustrate how control over geometry can elucidate control over dissolution and enable an element of personalisation, a model was constructed to show how dissolution will vary in relation to changes in key geometrical parameters. This model was aided by the Korsmeye-Peppasfit which indicated diffusion controlled dissolution, allowing the model to be limited to Fickian diffusion models only. The geometry of the honeycomb tablets was approximated by treating it as a composite of semi-infinite plates, with second order corrections to ac-count for overlaps at the joins of intersecting struts (i.e., accom-modating small reductions in the area available for the drug to elute
from). This approach is rather attractive, since it allows the use of analytical predictions of drug release, and thus the model consists of a summation of widely known and well understood solutions[65]given by.
∑
⎡ ⎣ ⎢ ∞⎤⎦⎥= − = + ∞ − + M M π e n 1 8 (2 1) t nD n π t L
2 0
(2 1)
2 2 2 2
(2) for a single slab, whereMtandM∞denote the cumulative amounts of drug released at timetand at infinite time, respectively;Dis the dif-fusion coefficient of the drug within the matrix,Lis the thickness of the slab and n is a dummy variable to allow summation. The unknown inputs to this model, the diffusion coefficient and proportion of drug able to release from the tablet (i.e., D andM∞), were then used as coefficients for a non-linear curve fitting exercise using the intrinsic Matlab function,nonlinlsq, enabling us to identify D andM∞for each tablet tested. This was performed for three tablets, from which the average diffusion coefficient was determined as D = 3.6 ± 0.7 × 10⁻⁷mm2·s−1and the average proportion of drug released as 0.78 ± 0.05. As can be observed fromFig. 5e thefits are close, giving confidence that such a method can capture the main fea-tures of the drug dissolution.
To further understand the mechanisms at work here, the model was then used to predict dissolution trends when varying the cell diameter (and thus number of cells) and the honeycomb wall thickness. The average diffusion coefficient and proportion released determined above were employed. First, using the same structure as that employed for honeycombs inFig. 5a, the cell diameter was systematically varied from 0.5 to 2.5 mm in steps of 0.5 mm, noting that a cell diameter of 2.5 mm is around 50% of the total tablet diameter. In this case it was seen that as the cell diameter increased, the dissolution rate reduced. This can be interpreted by viewing the tablet in two parts–the honeycomb and the shell. Increasing cell diameter reduces the number of cells, making the system more dependent on the properties of the shell. In this case, the shell thickness is relatively thick and thus, the dissolution slows down (Fig. 5f). The model shows that if the shell thickness is made very small, the dissolution becomes invariant with respect to the cell diameter or the number of cells, since the surface area will scale directly with the volume of drug available (Figure not shown). Secondly, the honeycomb wall thickness was increased to give thicknesses of 0.05, 0.075, 0.1, 0.2 and 0.3 mm. Here the dissolution trends are not so simple (Fig. 5g). When the honeycomb wall thicknesses are small the release is initially fast, but then it transitions to a slower release as the drug in the hon-eycomb is depleted but drug in the shell continues to elute, but at a slower rate due to the relatively longer diffusion path in the shell compared to the honeycomb walls. As the honeycomb thickness is in-creased, the period of fast release is extended until the point when the honeycomb thickness is appreciable and the dissolution profile takes on the appearance of a single smooth release.
These observations indicate that through manipulation of the shell thickness, honeycomb wall thickness and the number of cells, it is possible to operate within a window of release rate that approaches a factor of 4 from slowest to fastest, whilst additionally being able to vary the dose independently by changing the height of the tablet.
4. Conclusions
In summary, for thefirst time, it has been shown that drug loaded solid dosage forms with complex geometries can be manufactured using hot-melt 3D inkjet printing and that variation in drug release profiles can be obtained in a controllable manner by combining the geometrical capability of 3D printing with predictive computational approaches. This has implications for controlled release from solid dosage form to support a particular treatment regime. It has been established that geometric parameters such as the cell diameter in the case of honey-comb geometry can be used predictably to alter release, as long as other influencing factors (in this case wettability) are accounted for. Modelling the release profiles of the honeycomb geometry as a sum of the release profiles of its constituent slabs is a promising strategy to facilitate the selection of geometries with suitable configuration. The purpose of this work was not to suggest that the honeycomb geometry is optimal for tablets but to demonstrate the freedom afforded by varying the geometry on the control of drug release. It is anticipated that the development of this technique could provide an alternative manu-facturing route for solid dosage forms with geometry flexibility and complexity suited for advanced drug delivery. Such geometries could, for example, be manipulated to achieve release profiles for personalised medicines or as a generic platform for different drugs, without the need to change the basic formulation composition, the processing parameters or the manufacturing equipment. It is further indicated that the ink jet technique is ideal for printing tablets with highly controlled distribu-tions of drug (or multiple drugs) within a complex geometry, which will further expand the window for designed drug delivery.
Acknowledgments
The authors gratefully acknowledge the PhD sponsorship for Mary Kyobula obtained from EPSRC (Grant EP/I01375X/1) and AstraZeneca at the Centre for Doctoral Targeted Therapeutics and Drug Formulation at the University of Nottingham in collaboration. We thank Dr. Craig Sturrock for the micro CT scan images, Dr. David J. Scurr, for assistance with the acquisition and analysis of the ToF-SIMS data and Dr. Graham Rance of the Nottingham Micro and Nano Research Centre for assis-tance with the acquisition and analysis of the Raman spectroscopy data.
Appendix A. Supplementary data
Supplementary data to this article can be found online athttp://dx. doi.org/10.1016/j.jconrel.2017.06.025.
References
[1] B.K. Kennedy, S.L. Berger, A. Brunet, J. Campisi, A.M. Cuervo, E.S. Epel, C. Franceschi, G.J. Lithgow, R.I. Morimoto, J.E. Pessin, T.A. Rando, A. Richardson, E.E. Schadt, T. Wyss-Coray, F. Sierra, Geroscience: linking aging to chronic disease, Cell 159 (2014) 709–713.
[2] E.R. Hajjar, A.C. Cafiero, J.T. Hanlon, Polypharmacy in elderly patients, Am. J. Geriatr. Pharmacother. 5 (2007) 345–351.
[3] H.-G. Xie, F.W. Frueh, Pharmacogenomics steps toward personalized medicine, Pers. Med. 2 (2005) 325–337.
[4] U.A. Meyer, U.M. Zanger, M. Schwab, Omics and drug response, Annu. Rev. Pharmacol. Toxicol. (2013) 475–502.
[5] S.A. Khaled, J.C. Burley, M.R. Alexander, J. Yang, C.J. Roberts, 3D printing offi ve-in-one dose combination polypill with defined immediate and sustained release profiles, J. Control. Release 217 (2015) 308–314.
[6] A. Goyanes, J. Wang, A. Buanz, R. Martinez-Pacheco, R. Telford, S. Gaisford, A.W. Basit, 3D printing of medicines: engineering novel oral devices with unique design and drug release characteristics, Mol. Pharm. 12 (2015) 4077–4084. [7] S.A. Khaled, J.C. Burley, M.R. Alexander, C.J. Roberts, Desktop 3D printing of
controlled release pharmaceutical bilayer tablets, Int. J. Pharm. 461 (2014) 105–111.
[8] J. Skowyra, K. Pietrzak, M.A. Alhnan, Fabrication of extended-release patient-tai-lored prednisolone tablets via fused deposition modelling (FDM) 3D printing, Eur. J. Pharm. Sci. 68 (2015) 11–17.
[9] J.J. Water, A. Bohr, J. Boetker, J. Aho, N. Sandler, H.M. Nielsen, J. Rantanen, Three-dimensional printing of drug-eluting implants: preparation of an
antimicrobial polylactide feedstock material, J. Pharm. Sci. 104 (2015) 1099–1107. [10] B.M. Wu, S.W. Borland, R.A. Giordano, L.G. Cima, E.M. Sachs, M.J. Cima, Solid
free-form fabrication of drug delivery devices, J. Control. Release 40 (1996) 77–87. [11] M. Ibrahim, T. Otsubo, H. Narahara, H. Koresawa, H. Suzuki, Inkjet printing
re-solution study for multi-material rapid prototyping, JSME Int. J. Ser. C 49 (2006) 353–360.
[12] Y.F. He, R.D. Wildman, C.J. Tuck, S.D.R. Christie, S. Edmondson, An investigation of the behavior of solvent based polycaprolactone ink for material jetting, Sci Rep 6 (2016) 20852–20862.
[13] L.R. Hart, S.W. Li, C. Sturgess, R. Wildman, J.R. Jones, W. Hayes, 3D printing of biocompatible supramolecular polymers and their composites, ACS Appl. Mater. Interfaces 8 (2016) 3115–3122.
[14] A.V. Lemmo, D.J. Rose, T.C. Tisone, Inkjet dispensing technology: applications in drug discovery, Curr. Opin. Biotechnol. 9 (1998) 615–617.
[15] S. Hauschild, U. Lipprandt, A. Rumplecker, U. Borchert, A. Rank, R. Schubert, S. Förster, Direct preparation and loading of lipid and polymer vesicles using in-kjets, Small 1 (2005) 1177–1180.
[16] United States Food and Drug Administration, Highlights of Prescribing Information—Spritam.www.accessdata.fda.gov/drugsatfda_docs/label/2015/ 207958s000lbl.pdf, (2015) (accessed. 01.05.2016).
[17] S.A. Khaled, J.C. Burley, M.R. Alexander, J. Yang, C.J. Roberts, 3D printing of ta-blets containing multiple drugs with defined release profiles, Int. J. Pharm. 494 (2015) 643–650.
[18] I.C.K. Wong, M.A. Ghaleb, B.D. Franklin, N. Barber, Incidence and nature of dosing errors in paediatric medications: a systematic review, Drug Saf. 27 (2004) 661–670. [19] Y. Qiu, N. Chidambaram, K. Flood, Design and evaluation of layered diffusional
matrices for zero-order sustained-release, J. Control. Release 51 (1998) 123–130. [20] S. Andjelić, J. Yuan, D.D. Jamiolkowski, R. Diluccio, R. Bezwada, H. Zhang,
J. Mijović, Hydrophilic absorbable copolyester exhibiting zero-order drug release, Pharm. Res. 23 (2006) 821–834.
[21] L. Yang, R. Fassihi, Zero-order release kinetics from a self-correctingfloatable asymmetric configuration drug delivery systemxd, J. Pharm. Sci. 85 (1996) 170–173.
[22] C.G. Varelas, D.G. Dixon, C.A. Steiner, Zero-order release from biphasic polymer hydrogels, J. Control. Release 34 (1995) 185–192.
[23] P. Giunchedi, U. Conte, L. Maggi, A. Lamanna, Hydrophilic matrices for the ex-tended release of a model-drug exhibiting pH-dependent solubility, Int. J. Pharm. 85 (1992) 141–147.
[24] L.S. Shenouda, K.A. Adams, M.A. Zoglio, A controlled release delivery system using 2 hydrophilic polymers, Int. J. Pharm. 61 (1990) 127–134.
[25] I.J. Hardy, A. Windberg-Baarup, C. Neri, P.V. Byway, S.W. Booth, S. Fitzpatrick, Modulation of drug release kinetics from hydroxypropyl methyl cellulose matrix tablets using polyvinyl pyrrolidone, Int. J. Pharm. 337 (2007) 246–253. [26] C.D. Melia, Hydrophilic matrix sustained-release systems based on polysaccharide
carriers, Crit. Rev. Ther. Drug Carrier Syst. 8 (1991) 395–421.
[27] S. Abdul, S.S. Poddar, Aflexible technology for modified release of drugs: multi layered tablets, J. Control. Release 97 (2004) 393–405.
[28] A. Goyanes, P.R. Martinez, A. Buanz, A.W. Basit, S. Gaisford, Effect of geometry on drug release from 3D printed tablets, Int. J. Pharm. 494 (2015) 657–663. [29] B.K. Lee, Y.H. Yun, J.S. Choi, Y.C. Choi, J.D. Kim, Y.W. Cho, Fabrication of
drug-loaded polymer microparticles with arbitrary geometries using a piezoelectric inkjet printing system, Int. J. Pharm. 427 (2012) 305–310.
[30] C.-j. Kim, Release kinetics of coated, donut-shaped tablets for water soluble drugs, Eur. J. Pharm. Sci. 7 (1999) 237–242.
[31] Y. Sun, S. Soh, Printing tablets with fully customizable release profiles for perso-nalized medicine, Adv. Mater. 27 (2015) 7847–7853.
[32] U. Gbureck, T. Holzel, C.J. Doillon, F.A. Muller, J.E. Barralet, Direct printing of bioceramic implants with spatially localized angiogenic factors, Adv. Mater. 19 (2007) 795–800.
[33] C. Beyer, Strategic implications of current trends in additive manufacturing, J. Manuf. Sci. Eng. 136 (2014) 064701–064708.
[34] M. Gebler, A. Uiterkamp, C. Visser, A global sustainability perspective on 3D printing technologies, Energy Policy 74 (2014) 158–167.
[35] B. Berman, 3-D printing: the new industrial revolution, Bus. Horiz. 55 (2012) 155–162.
[36] A.O. Hanstveit, Biodegradability of petroleum waxes and beeswax in an adapted CO2evolution test, Chemosphere 25 (1992) 605–620.
[37] Food and Drug Administration, Select Committee on GRAS Substances (SCOGS) Opinion: Beeswax (Yellow or White).http://www.fda.gov/food/
ingredientspackaginglabeling/gras/scogs/ucm260869.htm, (1975) (accessed. 01.05.2016).
[38] F. Aguilar, H. Autrup, S. Barlow, L. Castle, R. Crebelli, W. Dekant, K.-H. Engel, N. Gontard, D. Gott, S. Grilli, Beeswax (E 901) as a glazing agent and as carrier for
flavours scientific opinion of the panel on food additives,flavourings, processing aids and materials in contact with food (AFC), EFSA J. 645 (2007) 1–28. [39] H. Amekyeh, N. Billa, K.H. Yuen, S.L.S. Chin, A gastrointestinal transit study on
amphotericin b-loaded solid lipid nanoparticles in rats, AAPS PharmSciTech 16 (2015) 871–877.
[40] Y. Chen, Y. Lu, J. Chen, J. Lai, J. Sun, F. Hu, W. Wu, Enhanced bioavailability of the poorly water-soluble drug fenofibrate by using liposomes containing a bile salt, Int. J. Pharm. 376 (2009) 153–160.
[41] ICH Guideline, Impurities: Guideline for Residual Solvents Q3C (R5).http://www. pmda.go.jp/files/000156308.pdf, (2011) (accessed. 01.05.2016).
[42] K. Grodowska, A. Parczewski, Organic solvents in the pharmaceutical industry, Acta Pol. Pharm. 67 (2010) 3–12.
delivery devices for providing linear release profiles fabricated by 3DP, Int. J. Pharm. 370 (2009) 160–166.
[44] B.J. de Gans, P.C. Duineveld, U.S. Schubert, Inkjet printing of polymers: state of the art and future developments, Adv. Mater. 16 (2004) 203–213.
[45] P. Tipduangta, K. Takieddin, L. Fabian, P. Belton, S. Qi, A new low melting-point polymorph of fenofibrate prepared via talc induced heterogeneous nucleation, Cryst. Growth Des. 15 (2015) 5011–5020.
[46] A. Heinz, K.C. Gordon, C.M. McGoverin, T. Rades, C.J. Strachan, Understanding the solid-state forms of fenofibrate - a spectroscopic and computational study, Eur. J. Pharm. Biopharm. 71 (2009) 100–108.
[47] P. Di Martino, G.F. Palmieri, S. Martelli, Evidence of a metastable form of fenofi -brate, Pharmazie 55 (2000) 625–626.
[48] Y. Gaillard, A. Mija, A. Burr, E. Darque-Ceretti, E. Felder, N. Sbirrazzuoli, Green material composites from renewable resources: polymorphic transitions and phase diagram of beeswax/rosin resin, Thermochim. Acta 521 (2011) 90–97. [49] T. Kameda, Y. Tamada, Variable-temperature C-13 solid-state NMR study of the
molecular structure of honeybee wax and silk, Int. J. Biol. Macromol. 44 (2009) 64–69.
[50] T. Kameda, C-13 solid-state NNIR analysis of heterogeneous structure of beeswax in native state, J. Phys. D Appl. Phys. 38 (2005) 4313–4320.
[51] F.R.L. Schoening, The X-ray-diffraction pattern and deformation texture of beeswax, S. Afr. J. Sci. 76 (1980) 262–265.
[52] E.B. Sirota, A.B. Herhold, Transient rotator phase induced nucleation in n-alkane melts, Polymer 41 (2000) 8781–8789.
[53] I.G.Q.A. (R2), Stability testing of new drug substances and products,http://www. ich.org/home.html, 2003, (accessed.
[54] I. Weuts, F. Van Dycke, J. Voorspoels, S. De Cort, S. Stokbroekx, R. Leemans, M.E. Brewster, D.W. Xu, B. Segmuller, Y.T.A. Turner, C.J. Roberts, M.C. Davies, S. Qi, D.Q.M. Craig, M. Reading, Physicochemical properties of the amorphous drug, castfilms, and spray dried powders to predict formulation probability of
success for solid dispersions: etravirine, J. Pharm. Sci. 100 (2011) 260–274. [55] S. Jana, S. Martini, Effect of high-intensity ultrasound and cooling rate on the
crystallization behavior of beeswax in edible oils, J. Agric. Food Chem. 62 (2014) 10192–10202.
[56] A. Clydesdale, Beeswax: a survey of the literature on its properties and behaviour, SSCR, Journal 5 (1994) 9–12.
[57] A.P. Tulloch, Beeswax - structure of esters and their component hydroxy acids and diols, Chem. Phys. Lipids 6 (1971) 235–265.
[58] Z.A. Langham, J. Booth, L.P. Hughes, G.K. Reynolds, S.A.C. Wren, Mechanistic in-sights into the dissolution of spray-dried amorphous solid dispersions, J. Pharm. Sci. 101 (2012) 2798–2810.
[59] F. Tres, S.R. Coombes, A.R. Phillips, L.P. Hughes, S.A.C. Wren, J.W. Aylott, J.C. Burley, Investigating the dissolution performance of amorphous solid disper-sions using magnetic resonance imaging and proton NMR, Molecules 20 (2015) 16404–16418.
[60] T. Higuchi, Mechanism of sustained-action medication - theoretical analysis of rate of release of solid drugs dispersed in solid matrices, J. Pharm. Sci. 52 (1963) 1145–1149.
[61] J. Siepmann, N.A. Peppas, Modeling of drug release from delivery systems based on hydroxypropyl methylcellulose (HPMC), Adv. Drug Deliv. Rev. 48 (2001) 139–157. [62] S.U. Kushare, A.A. Phatak, P.D. Chaudhari, Development and evaluation of a novel modified release pellet-based system for the delivery of desloratadine and pseu-doephedrine hydrochloride, Asian J. Pharm. 5 (2011) 203–208.
[63] J.C. Gayet, G. Fortier, High water content BSA-PEG hydrogel for controlled release device: evaluation of the drug release properties, J. Control. Release 38 (1996) 177–184.
[64] J.B. Schwartz, A.P. Simonelli, W.I. Higuchi, Drug release from wax matrices I. Analysis of data withfirst-order kinetics and with the diffusion-controlled model, J. Pharm. Sci. 57 (1968) 274–277.