Hepatic elastin content is predictive of adverse outcome in
advanced fibrotic liver disease
Timothy J Kendall,
1,2Grace E Dolman,
3Catherine M Duff,
4Emma C Paish,
3Abed Zaitoun,
3William Irving,
3Jonathan A Fallowfield
2& Indra N Guha
31Division of Pathology,2MRC Centre for Inflammation Research, University of Edinburgh, Edinburgh,3NIHR
Nottingham Biomedical Research Centre (BRC), Nottingham University Hospitals NHS Trust and the University of Nottingham, Nottingham, and4MRC Human Genetics Unit, Institute of Genetics & Molecular Medicine, University of Edinburgh, Edinburgh, UK
Date of submission 1 December 2017 Accepted for publication 17 February 2018 Published onlineArticle Accepted21 February 2018
Kendall T J, Dolman G E, Duff C M, Paish E C, Zaitoun A, Irving W, Fallowfield J A & Guha I N
(2018)Histopathology. https://doi.org/10.1111/his.13499
Hepatic elastin content is predictive of adverse outcome in advanced fibrotic liver disease
Aims: The aim of this study was to determine if elas-tin content in needle core native liver biopsies was predictive of clinical outcome in patients with chronic hepatitis C virus-related chronic liver disease.
Methods and results: Elastin contents in liver biopsies were determined by image analysis, technically vali-dated in an independent centre, and correlated with outcome in patients with advanced (Ishak stage ≥5) chronic hepatitis C virus-related chronic liver disease. Elastin was robustly quantified in an operator-inde-pendent and laboratory-indeoperator-inde-pendent manner, with very strong correlation of elastin staining measured with two methods of image classification (rs= 0.873,
P< 0.00001). Elastin content (but not absolute scar
content or Ishak stage) was predictive for future clin-ical outcomes. In a cohort of patients without sus-tained virological response, the median hepatic elastin content was 3.4%, and 17 patients (57%) progressed to a liver-related clinical outcome; 11 of the 15 patients (73%) with a hepatic elastin content of >3.4% progressed to a clinical outcome, as com-pared with only six of 15 (40%) with an elastin con-tent of <3.4%. The difference in time to outcome was significant.
Conclusions: We describe a simple and reproducible method for elastin quantification in liver biopsies that provides potentially valuable prognostic information to inform clinical management.
Keywords: cirrhosis, elastin, hepatitis C virus, prognosis
Introduction
Although the safety of needle biopsy of the liver is increasing,1 there remain non-zero mortality and morbidity rates, even with image-guided procedures,2 and biopsy remains essential for the diagnosis and assessment of liver disease.3 However, in contrast to the use of biopsy material from other tissues,4
additional evaluation to yield prognostic, personalised information is not undertaken.
Chronic liver disease (CLD) represents a significant global health burden. In progressive liver injury, fibrotic neomatrix production, coordinated by hepatic myofi-broblasts, exceeds native matrix degradation by matrix metalloproteinases (MMPs), resulting in progressive scar accumulation. However, after cessation of injury or treatment of the primary disease, the liver has the capacity for profound recovery. Data from well-charac-terised animal models5,6and studies in human CLD7,8 have demonstrated the potential reversibility of hepatic fibrosis. Moreover, histological regression of fibrosis is associated with a reduction in portal hypertension and Address for correspondence: Dr Tim Kendall, Department of
Pathology, Royal Infirmary of Edinburgh, 51 Little France Crescent, Edinburgh EH16 4SA UK. e-mail: [email protected]
T.J.K., G.E.D., J.A.F. and I.N.G. contributed equally to this work. ©2018 The Authors.Histopathologypublished by John Wiley&Sons Ltd.
improved clinical outcomes.9–11The factors limiting the reversibility of fibrosis are less well understood, particu-larly in human CLD. Such factors could be important in predicting future decompensation events (e.g. variceal bleeding and ascites) or persistent hepatocellular carci-noma (HCC) risk,12,13and in the selection of patients for potential antifibrotic trials.
Elastin is an extracellular matrix (ECM) protein con-ferring elastic recoil to tissues. It is extremely stable in vivo, owing to cross-linking and extreme hydropho-bicity. Elastin is only a minor ECM component in nor-mal liver, but it is actively synthesised as its soluble precursor, tropoelastin, by hepatic myofibroblasts in human fibrotic liver.14Covalent cross-linking of tropoe-lastin monomers results in an insoluble, mature etropoe-lastin polymer that makes accumulated scar ECM more resis-tant to degradation, limiting the reversibility of fibrosis.
Evidence for elastin turnoverin vivocomes from stud-ies showing elevated serum levels of MMP-mediated elastin breakdown fragments15and urinary concentra-tions of markers of degradation of mature cross-linked elastin (desmosine and isodesmosine) in patients with cirrhosis.16Furthermore, these urinary biomarkers cor-related with liver fibrosis scores in biopsies from patients with CLD secondary to hepatitis C virus (HCV) infection and alcohol consumption. Elastin turnover has also been studied longitudinally in liver biopsies from 21 patients with chronic viral hepatitis;17 this indicated that deposition of elastic fibres occurred concomitantly with the formation of thick collagen bands. This is con-sistent with other studies showing that older scars in liver biopsy specimens can be identified by their elastin content.18–20More recently, hepatic elastin content has been shown to be associated with subsequent progres-sion to the development of HCC in a cohort of patients with advanced fibrosis related to HCV.21
We hypothesised that the elastin content of fibrotic ECM in advanced CLD varies between individuals, and that hepatic elastin content may predict the occurrence of adverse clinical events. We have devel-oped a robust, reproducible method that utilises exist-ing biopsy material to quantify hepatic elastin and predict poor clinical outcome. Extracting additional information from biopsy material also favourably shifts the risk/benefit ratio of the procedure.
Materials and methods
P A T I E N T C O H O R T S
Trent HCV biopsies
The study cohort was derived from a single centre (Nottingham) within the Trent Study of Patients with
Hepatitis C Virus Infection, a prospective observa-tional study designed to follow the natural history of HCV infection.22 Patients underwent liver biopsy as part of routine clinical care, and consented for tissue surplus to diagnostic purposes to be used for research. Albumin–bilirubin scores were calculated to assess the severity of liver dysfunction.23 The Trent HCV study was approved by the regional ethics committee (MREC 98/3/55).
To enrich the study for a future endpoint of clinical outcomes, we selected patients who had both advanced liver fibrosis and evidence of progressive disease. The inclusion criteria for elastin evaluation were as follows: active chronic HCV infection without a sustained viro-logical response to therapy before or after biopsy; biopsy performed before 2011, allowing time for clini-cal outcomes to develop; biopsy assessed as Ishak stage ≥5 by an independent histopathologist blinded to other clinical information; adequate tissue remaining in the block available for elastin immunohistochemistry; and no clinical outcome before biopsy.
Lothian explant study samples
For technical validation of elastin staining by the use of samples from a different centre stained in an indepen-dent laboratory, non-hilar sections from human explant liver were obtained by application to the Loth-ian NRS Human Annotated Bioresource (ethical review number 15/ES/0094). Samples were of mixed aetiology: seven cirrhotic (two alcohol-related liver dis-ease, one primary sclerosing cholangitis, two primary biliary cholangitis, one HCV, and one cryptogenic) and one non-fibrotic (acute liver failure without fibrosis, attributed to drug-induced liver injury).
H I S T O P A T H O L O G Y
Quantitative histology and digital image analysis using the Trent HCV study biopsies
Four-micrometre sections from biopsies were stained with picrosirius red (PSR), as described previously,5 for Ishak24 and Laennec25 scoring and quantification of liver fibrosis.
For biopsies from the Trent HCV study cohort, whole-slide images of PSR-stained sections and sec-tions stained for elastin were acquired at920 magni-fication (NanoZoomer; Hamamatsu Photonics, Shizuoka, Japan) and split manually into smaller tiles. Post-acquisition analysis was performed with an
IMAGEJ26 plugin created in-house, employing statistical
colour modelling to threshold images.27 No manual curation or masking of structures was undertaken before analysis.
Quantification of elastin immunopositivity was repeated independently at a second centre with the same raw whole-slide images. Images were split by the use of NDPISPLIT28 into tiles of 95 magnification
before the application of a classifier that had been generated by a specialist liver histopathologist using the machine learning WEKA plugin in FIJI.29,30 All
analysis was undertaken blind to all clinical and his-tological data.
Lothian liver explant samples
Additional work was undertaken at a second UK liver centre with alternative non-automated staining proto-cols. Four-micrometre sections of explanted cirrhotic liver were stained both with (Verhoeff’s) Elastic van Gieson (EVG) and the same elastin primary anti-body at the same dilution (1:200). Antigen retrieval was undertaken by 15 min of microwaving in EDTA pH 9.0 solution; the primary antibody was applied for 1 h at room temperature; and signal amplification was performed with a VECTASTAIN ABC HRP kit (Vector Laboratories, Peterborough, UK), according to the manufacturer’s instructions.
C L I N I C A L O U T C O M E S
A clinical outcome was defined as the first event recorded of: (i) ascites requiring treatment; (ii) vari-ceal bleeding; (iii) overt hepatic encephalopathy; (iv) orthotopic liver transplantation; (v) liver-related death; or (vi) development of HCC. Patients present-ing with new-onset ascites but diagnosed with HCC during investigation were recorded as having HCC. Data collection ceased in 2014, and none of the patients received treatment with direct-acting antivi-ral agents. Data from hospital records were supple-mented with data from the Office of National Statistics on cause of death and cancer registrations. Patients who did not reach a clinical outcome during the follow-up period were censored at either the time when they were last seen alive without evidence of a liver-related clinical outcome, or the time of non-liver-related death.
S T A T I S T I C S
All data were tested for normality with the Shapiro– Wilk test and by examination of Q–Q plots, allowing appropriate parametric or non-parametric tests to be used. Parametric data are described as mean stan-dard deviation; non-parametric data are presented as median with interquartile range (IQR). Spearman’s correlation coefficient (rs) was used to measure the
strength and direction of association between two ranked non-parametric variables. Bland–Altman (BA) plots and intraclass correlation (ICC) coefficients were used for additional comparison of elastin quantifica-tion methods. The difference in time to outcomes was assessed with the log-rank (chi-square) test. Cox regression analysis was used to determine factors associated with time to clinical outcomes. Statistical analysis was performed with IBM SPSS STATISTICS 22
and the RSTUDIO implementation of R.31 A P-value of <0.05 was considered to be statistically significant.
Results
D E V E L O P M E N T , T E C H N I C A L V A L I D A T I O N A N D R E P R O D U C I B I L I T Y O F E L A S T I N S T A I N I N G
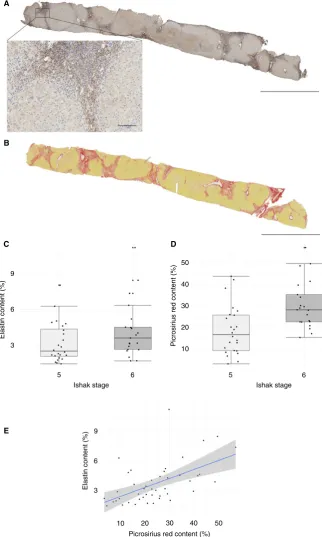
Elastin and PSR contents in the Trent HCV study samples were quantified with the previously described
IMAGEJ plugin27 (Figure 1A,B); patient characteristics
of the cohort are shown in Table 1. The median elas-tin content was higher in biopsies classified as Ishak stage 6 than in those classified as Ishak stage 5 (Fig-ure 1C), although the difference in median content (independent samples median test,P= 0.27) or distri-bution (Mann–Whitney U-test, P= 0.064) was not significant. There was a wide range of elastin content in biopsies from both Ishak categories: Ishak stage 5, median content of 2.51% (IQR 2.07–4.36; minimum of 1.44, maximum of 8.05); and Ishak stage 6, med-ian content of 3.61% (IQR 2.65–4.52; minimum of 1.69, maximum of 11.19).
The difference in PSR content between Ishak stages
5 and 6 was significant (Figure 1D;
18.80%11.52% versus 30.57% 11.24%; Welch two-sample t-test, t = –3.46, degrees of free-dom= 42.46, P= 0.0012). There was a statistically significant, moderate positive correlation between elastin content and collagen content (Figure 1E; rs = 0.58,P= 0.000047).
9
6
3
5
9
6
3
10 20 30 40 50
A
B
C
E
D
Picrosirius red content (%) Ishak stage
Picrosirius red content (%)
6
10
5 6
Ishak stage 20
30 40 50
Elastin content (%)
[image:4.595.142.465.101.639.2]Elastin content (%)
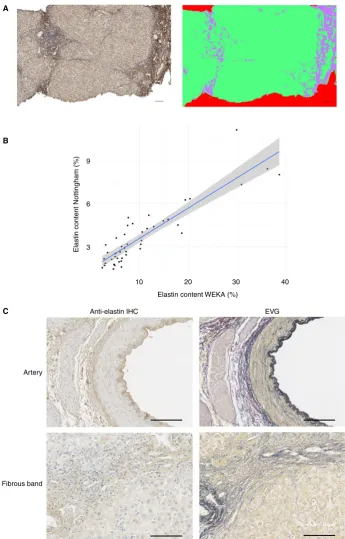
classification (WEKA). There was very strong rank
cor-relation of elastin quantified with both methods (Fig-ure 2A,B; rs= 0.87, P< 0.00001). However, as
expected from the raw values, absolute agreement
between methods showed systematic proportional dif-ferences on the BA plot (Figure S1), and poor agree-ment by ICC [one-way; ICC(1)= 0.098,P= 0.258].
To confirm the reproducibility of immunohisto-chemical detection of elastin in fibrotic liver and supportive tinctorial staining, sections from native explant hepatectomies, from a spectrum of primary aetiologies, and from a single non-fibrotic partial hepatectomy were obtained at a second UK liver centre and stained in a different laboratory with a separate batch of the same primary antibody. A manual protocol that did not require an automated stainer, with alternative signal amplification, was used. In parallel, tinctorial identification of elastin by EVG staining was undertaken on sections from the same block (Figure 2C) to confirm elastin iden-tification.
Elastin was evident and quantified in fibrous scars of cirrhotic explants (median cirrhotic elastin content of 4.7%, IQR 2.2–9.3; non-fibrotic elastin content of 0.2%; Figure S2), with clear histological spatial equivalence between elastin immunopositivity and dark blue/black elastin tinctorial staining by EVG. Staining intensity was reduced as compared with automated staining. This demonstrated broad aetiol-ogy-agnostic relevance and the interlaboratory appli-cability of antibody-based image analysis to quantify elastin.
E L A S T I N C O N T E N T C A N P R E D I C T A D V E R S E C L I N I C A L O U T C O M E I N P A T I E N T S W I T H A D V A N C E D F I B R O S I S
[image:5.595.298.533.114.212.2] [image:5.595.50.281.121.655.2]Seventeen patients (57%) progressed to a liver-related clinical outcome in the follow-up period after liver biopsy (median follow-up of 5.8 years; IQR 3.0–8.3). Recorded outcomes were: ascites (n= 8), variceal bleeding (n= 1), liver-related death (n = 2), and HCC (n =5); one patient presented with ascites and Table 1. Clinical, biochemical and histological
characteris-tics of patients of the Trent HCV study cohort
Variable Median IQR Number
Age (years) 49 42–54 30
Male gender 23 (77%)
BMI (kg/m2) 27 25–30 27
Estimated duration from infection to biopsy (years)
28 20–31 27
Past heavy alcohol use 17 (57%)
Heavy alcohol use (>50 units/week)
9 (30%)
HCV genotype
1 10 (33%)
2 0
3 17 (57%)
4 1 (3%)
Albumin (g/l) 36 38–40 27
Bilirubin (lmol/ml) 12 9–16 29
ALP (u/l) 113 86–220 29
GGT (u/l) 166 82–339 29
ALT (u/l) 127 85–201 29
Ishak stage 5 16 (53%)
Ishak grade
0–6 13 (43%)
7–12 16 (53%)
13–18 1 (3%)
Laennec stage
3 3 (10%)
4A 3 (10%)
4B 10 (33%)
4C 14 (47%)
PSR (collagen) (%) 22.8 15.6–29.9 30
Table 1. (Continued)
Variable Median IQR Number
Elastin (%) 3.4 2.2–4.7 30
Biopsy length (mm) 14.5 11.8–18.0
Number of portal tracts
15 13–20
ALBI score 2.6 2.77 to 2.39 27
Elastin content WEKA (%)
EVG 40 30
20 10
3 6 9 A
B
C
Elastin content Nottingham (%)
Anti-elastin IHC
Artery
[image:6.595.130.476.96.636.2]Fibrous band
encephalopathy simultaneously. None of the patients underwent transplantation.
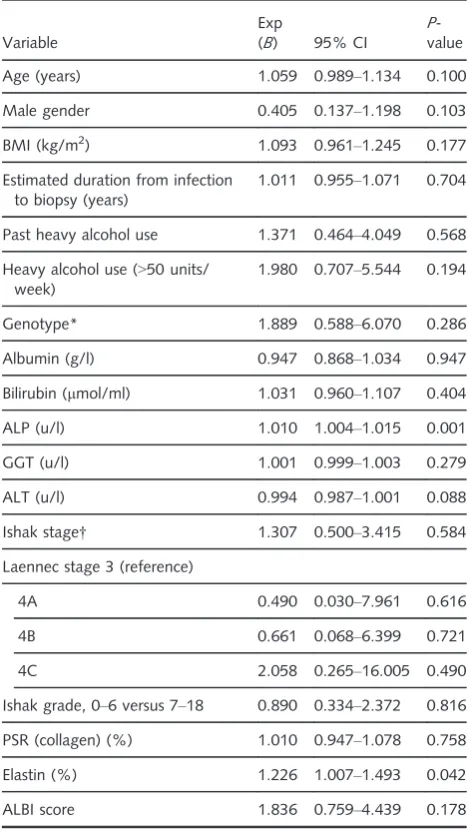
Factors associated with time to subsequent clinical outcomes were determined (Table 2). On Cox regres-sion analysis, only elastin content and alkaline phos-phatase (ALP) were significant in univariate analysis; Ishak stage and PSR (collagen) content were not
predictors of adverse outcome within this cohort. ALP remained significant in multivariate analysis [ALP hazard ratio 1.009, 95% confidence interval (CI) 1.0033–1.015, P= 0.0021; elastin hazard ratio 1.123, 95% CI 0.891–1.402,P= 0.306].
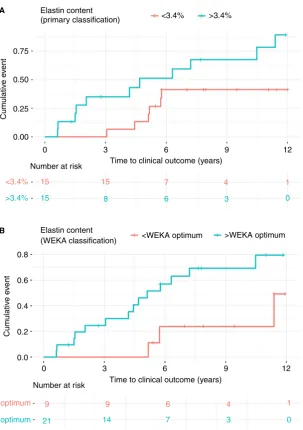
The median elastin content determined with the primary quantification method for the cohort was 3.4% (IQR 2.2–4.7). Eleven of 15 patients (73%) with greater than median elastin content progressed to a clinical outcome, as compared with only six of 15 (40%) of those with elastin content below the group median. The difference in time to outcomes was sig-nificant (log rank: chi-square test 3.98; P =0.046; Figure 3A). Elastin content quantified byWEKA
classifi-cation (median 7.5, IQR 5.9–14.4) was also predic-tive of clinical outcome; a calculated optimum cut-off value of 6.2% also gave a significant difference in time to outcome (log rank: chi-square test 4.6; P= 0.0312; Figure 3B).
We performed a subgroup analysis to ascertain whether elastin was a predictor of HCC as a single outcome in our cohort. Only five patients (17%) developed HCC during the follow-up period. Elastin content was not statistically associated with the development of HCC [Cox regression: exp(B) 1.00 (0.61–1.62);P= 0.99].
Discussion
In this study, we have developed a method to obtain clinically useful prognostic information from existing liver biopsy material, using an elastin primary anti-body and digital image analysis to detect and quantify elastin content in advanced CLD, and confirmed with independent classification methods. Histological equiv-alence in identification of elastin by both immunohisto-chemistry and a well-characterized tinctorial stain (EVG) was demonstrated. The use of an antibody to identify elastin, based on initial animal studies by the Edinburgh group,18,32has the advantage of conferring the specificity that may be needed in antifibrotic studies, but the disadvantage of adding additional complexity and cost as compared with tinctorial stains.
[image:7.595.47.282.248.665.2]As a proof-of-concept, we chose a group of patients with HCV infection and advanced CLD lacking a sus-tained virological response to standard contempory treatment (i.e. pegylated interferon and ribavirin). This restricted cohort was chosen to allow the study of patients with rapid fibrosis progression and the highest rate of adverse clinical outcomes. A recent study demonstrated that elastin content is associated with HCC development21 in patients with advanced Table 2. Predictors of liver-related clinical outcomes;
elas-tin content and serum alkaline phosphatase (ALP) are the only significant predictors of a liver-related clinical event, as determined by univariate Cox regression analysis
Variable
Exp
(B) 95% CI
P -value
Age (years) 1.059 0.989–1.134 0.100
Male gender 0.405 0.137–1.198 0.103
BMI (kg/m2) 1.093 0.961–1.245 0.177
Estimated duration from infection to biopsy (years)
1.011 0.955–1.071 0.704
Past heavy alcohol use 1.371 0.464–4.049 0.568
Heavy alcohol use (>50 units/ week)
1.980 0.707–5.544 0.194
Genotype* 1.889 0.588–6.070 0.286
Albumin (g/l) 0.947 0.868–1.034 0.947
Bilirubin (lmol/ml) 1.031 0.960–1.107 0.404
ALP (u/l) 1.010 1.004–1.015 0.001
GGT (u/l) 1.001 0.999–1.003 0.279
ALT (u/l) 0.994 0.987–1.001 0.088
Ishak stage† 1.307 0.500–3.415 0.584
Laennec stage 3 (reference)
4A 0.490 0.030–7.961 0.616
4B 0.661 0.068–6.399 0.721
4C 2.058 0.265–16.005 0.490
Ishak grade, 0–6 versus 7–18 0.890 0.334–2.372 0.816
PSR (collagen) (%) 1.010 0.947–1.078 0.758
Elastin (%) 1.226 1.007–1.493 0.042
ALBI score 1.836 0.759–4.439 0.178
ALBI, albumin–bilirubin; ALT, alanine transaminase; BMI, body mass index; CI, confidence interval; GGT, c-glutamyl transferase; PSR, picrosirius red.
*Genotype 1 used as reference; analysis performed with compar-ison of only genotypes 1 and 3.
fibrosis. However, this was over a limited follow-up period, and elastin as a predictor of decompensated disease was not evaluated. We demonstrated signifi-cant variation in elastin content in patients with advanced CLD, and showed that elastin content can be used as a tissue biomarker of adverse liver-related outcomes. In contrast, neither Ishak stage nor PSR (collagen) content predicted outcome in this cohort.
Liver biopsy remains an important clinical diagnos-tic tool,3 but there is a clear obligation to extract as
much information from biopsy material as possible, given the associated risks.1 The data provide encour-agement to examine elastin in large, prospective cohorts of advanced liver fibrosis patients with con-tinuing liver injury. The demonstration of elastin in different aetiologies of human disease suggests its potential utility across all CLDs, but this requires evaluation in disease-specific cohorts.
Staging of fibrosis with available ordinal scoring systems is subject to considerable observer variability Elastin content
(primary classification) <3.4% >3.4%
9 12
6 3
0.00
0.8
0.6
0.4
0.2
Cum
ulativ
e e
v
ent
0.0
0 3 6
Time to clinical outcome (years) Number at risk
9 12
0
Number at risk
Elastin content
<WEKA optimum >WEKA optimum (WEKA classification)
<3.4%
<optimum 9 9 6 4 1
>3.4%
>optimum 21 14 7 3 0
15 8 6 3 0
15 15 7 4 1
0.25 0.50 0.75 A
B
Cum
ulativ
e e
v
ent
[image:8.595.156.460.94.525.2]Time to clinical outcome (years)
Figure 3.Elastin content functions as a tissue biomarker predictive of adverse liver-related events.A, Patients whose liver biopsies had elas-tin content greater than the median (3.4%) according to primary classification more rapidly developed an adverse liver-related event than those with biopsies whose elastin content was below this value; the difference in time to outcomes was significant (log rank: chi-square 3.98;P=0.046).B,WEKAquantification indicated that biopsies with elastin content greater than the optimum calculated cut-off (6.2%)
and generates crude ordinal data, indicating a need for alternative methods of evaluation. Quantification of fibrosis from biopsy material by the use of PSR-stained sections addresses some of these problems, but is not routinely undertaken in clinical practice. In our study, establishment of a laboratory-specific stan-dard allowed elastin content to be used as a tissue biomarker predicting individual outcome from the clinically indicated biopsy with minimal operator input once standards had been established. With min-imal cost and from a standard, clinically indicated liver biopsy, quantification of elastin could be incor-porated as part of more nuanced histological assess-ment, e.g. stratifying patients who are unlikely to benefit from putative antifibrotic therapy, or identify-ing those requiridentify-ing earlier referral for assessment for liver transplantation. The ability to obtain this infor-mation from whole-slide images, which can be cen-trally verified and easily accessed, is of additional value to clinical trials wishing to ensure that appro-priate patients are included for investigation of novel therapies.
The resistance of hepatic elastin to degradation suggests that elastin content may influence the bal-ance of fibrogenesis and reversibility in favour of scar accumulation. Progressive scar formation with conse-quent bridging of vascular structures leads to portal hypertension. The non-HCC adverse liver-related out-comes in this proof-of-concept study are related to portal hypertension. Increased hepatic elastin content may be a consequence of aberrant hepatic blood flow and sinusoidal pressure; in the context of liver injury, it has been suggested that elastin is deposited by por-tal fibroblasts to limit damage caused by increased biliary ductal pressure33and that elastin deposition is a result of tensile and shearing effects.34 It is also recognised that a strained ECM leads to greater pro-duction of fibrotic glycoproteins than a relaxed ECM.35–37 Given the focus on predicting clinical out-comes in advanced CLD, the role of elastin in home-ostasis or during earlier stages of fibrogenesis has not been examined.
This was an initial proof-of-concept study, and therefore has inherent limitations. A single-aetiology cohort has been studied; there is evidence that matrix composition or amount may vary between diseases,38 so further work with additional cohorts of alternative aetiologies and similarly prolonged follow-up is required. The Cox regression analysis should be inter-preted cautiously, given that the size of the pilot cohort studied meant that recognised prognostic fac-tors were not identified as significant by univariate analysis. Additionally, it is clear that interlaboratory
differences in staining protocols and performance, as demonstrated by the differences between manual and automated staining in our study, mean that prescrip-tive application of the cut-off value derived from this study is inappropriate, and further work to allow lab-oratory protocol harmonisation would be required before routine application in practice. Quantifying elastin from EVG-stained sections that are more read-ily and reproducibly available is an obvious means of minimising interlaboratory staining variation in order to develop a more broadly applicable tool.
Elastin accumulates in fibrotic livers regardless of the underlying aetiology, and is a key determinant of irreversibility; its presence may predict the develop-ment of clinical outcomes independently of collagen fibres. Hepatic elastin quantification should be evalu-ated further in larger studies to establish its potential role in clinical decision-making and the selection of patients for therapeutic trials.
Acknowledgements
The authors would like to thank Jie Shu for providing guidance on the initial automated digital analysis, and the Lothian NRS Human Annotated Bioresource for the provision of explant tissue sections. J. A. Fal-lowfield was funded by an NHS Research Scotland/ Universities Scottish Senior Clinical Fellowship (http://www.cso.scot.nhs.uk/scaf17/). Funding and support were received from , Pfizer, and MRC Not-tingham Molecular Pathology Node. No funding agency was involved in data collection, analysis, or manuscript preparation.
Author contributions
intellectual content. J. A. Fallowfield: analysis and interpretation of data; drafting of the manuscript; and critical revision of the manuscript for important intel-lectual content. I. N. Guha: study concept and design; analysis and interpretation of data; drafting of the manuscript; critical revision of the manuscript for important intellectual content; and study supervision.
Conflicts of interest
J. A. Fallowfield has received consultancy fees from Novartis and Merck, and research grant funding from GlaxoSmithKline and Intercept Pharmaceuticals for work unconnected with that reported in this article. The other authors state that they have no conflicts of interest.
References
1. West J, Card TR. Reduced mortality rates following elective per-cutaneous liver biopsies. Gastroenterology 2010; 139; 1230– 1237.
2. Howlett DC, Drinkwater KJ, Lawrence D, et al.Findings of the UK National Audit evaluating image-guided or image-assisted liver biopsy. Part II. Minor and major complications and proce-dure-related mortality.Radiology2013;266; 226–235. 3. Rockey DC, Caldwell SH, Goodman ZD, et al. Liver biopsy.
Hepatology2009;49; 4.
4. Rakha EA, Pinder SE, Bartlett JMS, et al. Updated UK Recom-mendations for HER2 assessment in breast cancer. J. Clin. Pathol.2015;68; 93–99.
5. Iredale JP, Benyon RC, Pickering J, et al.Mechanisms of spon-taneous resolution of rat liver fibrosis. Hepatic stellate cell apoptosis and reduced hepatic expression of metalloproteinase inhibitors.J. Clin. Invest.1998;102; 538–549.
6. Issa R, Williams E, Trim N, et al.Apoptosis of hepatic stellate cells: involvement in resolution of biliary fibrosis and regulation by soluble growth factors.Gut2001;48; 548–557.
7. D’Ambrosio R, Aghemo A, Rumi MG, et al. A morphometric and immunohistochemical study to assess the benefit of a sus-tained virological response in hepatitis C virus patients with cirrhosis.Hepatology2012;56; 532–543.
8. Marcellin P, Gane E, Buti M,et al.Regression of cirrhosis dur-ing treatment with tenofovir disoproxil fumarate for chronic hepatitis B: a 5-year open-label follow-up study.Lancet2013; 381; 468–475.
9. Manolakopoulos S, Triantos C, Theodoropoulos J, et al. Antivi-ral therapy reduces portal pressure in patients with cirrhosis due to HBeAg-negative chronic hepatitis B and significant por-tal hypertension.J. Hepatol.2009;51; 468–474.
10. Roberts S, Gordon A, McLean C,et al.Effect of sustained viral response on hepatic venous pressure gradient in hepatitis C-related cirrhosis.Clin. Gastroenterol. Hepatol.2007; 5; 932– 937.
11. George SL, Bacon BR, Brunt EM,et al.Clinical, virologic, histo-logic, and biochemical outcomes after successful HCV therapy. Hepatol. Baltim. Md2009;49; 729–738.
12. Janjua NZ, Chong M, Kuo M, et al. Long-term effect of sus-tained virological response on hepatocellular carcinoma in
patients with hepatitis C in Canada.J. Hepatol.2017;66; 504– 513.
13. van der Meer AJ, Feld JJ, Hofer H,et al.Risk of cirrhosis-related complications in patients with advanced fibrosis following hep-atitis C virus eradication.J. Hepatol.2017;66; 485–493. 14. Kanta J, Velebny V, Mergancova J, et al. Elastin content in
human fibrotic and cirrhotic liver.Sb. Vedeckych Pr. Lek. Fak. Karlovy Univ. V Hradci Kralove1990;33; 489–494.
15. Leeming DJ, Karsdal MA, Byrjalsen I, et al. Novel serological neo-epitope markers of extracellular matrix proteins for the detection of portal hypertension. Aliment. Pharmacol. Ther. 2013;38; 1086–1096.
16. Afdhal NH, Keaveny AP, Cohen SB, et al. Urinary assays for desmosine and hydroxylysylpyridinoline in the detection of cir-rhosis.J. Hepatol.1997;27; 993–1002.
17. Bedossa P, Lemaigre G, Paraf F, et al. Deposition and remod-elling of elastic fibres in chronic hepatitis. Virchows Arch. A Pathol. Anat. Histopathol.1990;417; 159–162.
18. Issa R, Zhou X, Constandinou CM,et al.Spontaneous recovery from micronodular cirrhosis: evidence for incomplete resolution associated with matrix cross-linking. Gastroenterology 2004; 126; 1795–1808.
19. Scheuer PJ, Maggi G. Hepatic fibrosis and collapse: histological distinction by orcein staining.Histopathology1980;4; 487–490. 20. Thung SN, Gerber MA. The formation of elastic fibers in livers with massive hepatic necrosis. Arch. Pathol. Lab. Med. 1982; 106; 468–469.
21. Yasui Y, Abe T, Kurosaki M,et al. Elastin fiber accumulation in liver correlates with the development of hepatocellular carci-noma.PLoS ONE2016;11; e0154558.
22. Mohsen A, Group TH. The epidemiology of hepatitis C in a UK health regional population of 5.12 million. Gut 2001; 48; 707–713.
23. Johnson PJ, Berhane S, Kagebayashi C, et al. Assessment of liver function in patients with hepatocellular carcinoma: a new evidence-based approach—the ALBI Grade. J. Clin. Oncol. 2015;33; 550–558.
24. Ishak K, Baptista A, Bianchi L,et al.Histological grading and staging of chronic hepatitis.J. Hepatol.1995;22; 696–699. 25. Kim SU, Oh HJ, Wanless IR,et al.The Laennec staging system
for histological sub-classification of cirrhosis is useful for strati-fication of prognosis in patients with liver cirrhosis.J. Hepatol. 2012;57; 556–563.
26. Schindelin J, Rueden CT, Hiner MC,et al. The ImageJ ecosys-tem: an open platform for biomedical image analysis. Mol. Reprod. Dev.2015;82; 518–529.
27. Shu J, Dolman GE, Duan J, et al. Statistical colour models: an automated digital image analysis method for quantifica-tion of histological biomarkers. Biomed. Eng. OnLine 2016; 15; 46.
28. Deroulers C, Ameisen D, Badoual M, et al. Analyzing huge pathology images with open source software. Diagn. Pathol. 2013;8; 92.
29. Arganda-Carreras I, Kaynig V, Rueden C, et al. Trainable Weka Segmentation: a machine learning tool for microscopy pixel classification.Bioinformatics2017;33; 2424–2426. 30. Schindelin J, Arganda-Carreras I, Frise E, et al. Fiji: an
open-source platform for biological-image analysis. Nat. Methods 2012;9; 676–682.
31. R Core Team.R: a language and environment for statistical com-puting. Vienna: R Foundation for Statistical Computing, 2016. 32. Pellicoro A, Aucott RL, Ramachandran P, et al. Elastin
macrophage metalloelastase (MMP-12) during experimental liver fibrosis.Hepatology2012;55; 1965–1975.
33. Wells RG. The portal fibroblast—not just a poor man’s stellate cell.Gastroenterology2014;147; 41–47.
34. Liban E, Ungar H. Elastosis in fibrotic and cirrhotic processes of the liver.Arch. Pathol.1959;68; 331–341.
35. Chiquet M, Matthisson M, Koch M, et al.Regulation of extra-cellular matrix synthesis by mechanical stress. Biochem. Cell Biol. Biochim. Biol. Cell.1996;74; 737–744.
36. Schuppan D, Porov Y. Hepatic fibrosis: from bench to bedside. J. Gastroenterol. Hepatol.2002;17; S300–S305.
37. Lorena D, Darby IA, Reinhardt DP,et al.Fibrillin-1 expression in normal and fibrotic rat liver and in cultured hepatic fibrob-lastic cells: modulation by mechanical stress and role in cell adhesion.Lab. Invest.2003;84; 203–212.
38. Hall A, Germani G, Isgro G, et al. Fibrosis distribution in explanted cirrhotic livers.Histopathology2012;60; 270–277.
Supporting Information
Additional Supporting Information may be found in the online version of this article:
Figure S1. Bland–Altman plot comparing elastin quantification by primary andWEKAmethods.
Figure S2. Elastin contents of cirrhotic explant and non-fibrotic resection cases, determined byWEKA