ISSN Online: 2327-5227 ISSN Print: 2327-5219
DOI: 10.4236/jcc.2019.710013 Oct. 16, 2019 136 Journal of Computer and Communications
Container Networking Performance Analysis
for Large-Scale User Behavior Simulation
Yifang Ji, Guomin Zhang, Shengxu Xie, Xiulei Wang
Command & Control Engineering College, Army Engineering University of PLA, Nanjing, China
Abstract
Accurately simulating large-scale user behavior is important to improve the similarity between the cyber range and the real network environment. The Linux Container provides a method to simulate the behavior of large-scale users under the constraints of limited physical resources. In a container-based virtualization environment, container networking is an important compo-nent. To evaluate the impact of different networking methods between the containers on the simulation performance, the typical container networking methods such as none, bridge, macvlan were analyzed, and the performance of different networking methods was evaluated according to the throughput and latency metrics. The experiments show that under the same physical re-source constraints, the macvlan networking method has the best network performance, while the bridge method has the worst performance. This result provides a reference for selecting the appropriate networking method in the user behavior simulation process.
Keywords
Linux Container, Networking Mode, Network Performance, User Behavior Simulation
1. Introduction
In recent years, with the continuous development of network attack and defense confrontation technology, the network security situation has become more and more severe, and higher requirements have been put forward for the evaluation of the security performance of network information systems and the training of high-level network security protection personnel. The cyber range is an impor-tant infrastructure for network attack and defense drills and new network tech-nology evaluation. It can be used to verify the security performance of network
How to cite this paper: Ji, Y.F., Zhang, G.M., Xie, S.X. and Wang, X.L. (2019) Con-tainer Networking Performance Analysis for Large-Scale User Behavior Simulation. Jour-nal of Computer and Communications, 7, 136-146.
https://doi.org/10.4236/jcc.2019.710013
DOI: 10.4236/jcc.2019.710013 137 Journal of Computer and Communications
information systems, and provide a support platform for network attack and de-fense drills. At present, many countries in the world attach great importance to the construction of cyber range, and use it as an important means to support cyberspace security technology verification, network weapon testing, attack and defense confrontation drills and network risk assessment [1].
During the process of building the cyber range, in order to enhance the fideli-ty of the cyber range environment, it is necessary to simulate and generate large-scale user behaviors that are consistent with the real network environment. To this end, it is necessary to establish a behavior model of a typical user and generate multiple virtualized instances in the cyber range network through vir-tualization technology. Here, each virtualized instance is essentially a virtual machine in which a test program is deployed to perform operations in accor-dance with a specific user behavior model, including interacting with real busi-ness systems in the network, and communicating between different virtual ma-chines etc., so as to generate high-fidelity user behavior traffic on demand in the cyber range environment.
In order to support large-scale user behavior simulation, two key issues need to be solved: 1) how to build a lightweight virtualization instance to support the gen-eration of a larger number of virtualization instances under the same physical re-source constraints, so as to eliminating the bottleneck of large scale user behavior simulation; 2) how to improve the networking performance between virtualiza-tion instances and eliminate the communicavirtualiza-tion bottlenecks for large-scale user behavior simulation.
In recent years, the development of container technology has provided sup-port for solving the above problems. Typical container technologies include LXC [2], Docker [3], etc. Compared with the traditional virtualization technologies such as virtual machines, containers are isolated by namespaces, and different containers share the same physical operating system kernel, which makes it more lightweight.
Although more and more researchers use the lightweight virtualization tech-nology such as Linux Container to solve the practical problems of high cost, low efficiency and inflexibility of the current user behavior simulation technology [4], the network performance difference caused by different network modes be-tween containers is also obvious. In order to verify the impact of different net-working modes on network performance, and to establish an efficient container networking model for user behavior simulation, this paper analyzes the three most common network modes of LXC: none mode, bridge mode and macvlan mode. Throughput and network latency are used as indicators to verify the dif-ferences in performance between the three, and to provide technical support for building a container networking model for large-scale user behavior simulation.
2. Typical Networking Mode Analysis
DOI: 10.4236/jcc.2019.710013 138 Journal of Computer and Communications
uses virtualization technology to form a lightweight independent space, and lays a foundation for implementing multiple virtualized network functions [5]. This technology is based on two kernel features: namespaces and Cgroups. The na-mespace is used to control the isolation of resources between different processes. Each group of resources has a namespace type associated with it. For example, each network namespace has its own independent network stack, and processes in the namespace can only see the network stack, and cannot access network de-vices in other namespaces. Cgroups, on the other hand, is another mechanism of the kernel that consolidates (or separates) a series of system tasks and their sub-tasks into different groups that are ranked by resources according to require-ments, thus providing a unified framework for system resource management. In general, namespaces restrict the resources that a process can see, while Cgroups restrict the resources that a process can use. With these features, the entire sys-tem can be hidden in a set of processes. These processes are then run in a con-tainer.
Related studies show that under the same number of virtual nodes, compared with traditional virtual machines, container technology can save a lot of CPU and storage resources [6]. Therefore, using LXC for user behavior simulation can effectively meet the constraints of lightweight virtualization instances. On this basis, how to establish an efficient networking mode between different Li-nux Containers become a key issue.
For the Linux Container, its network mode mainly includes: none mode, bright mode, macvlan mode, phys mode, etc. [7].
None mode: none mode is the easiest way to deploy. The container does not have its own independent network stack, but shares the network stack of the physical host. There is no network isolation between the host and the container.
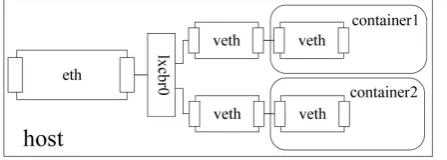
Bridge mode: bridge mode is the default network mode when creating LXC. As shown in Figure 1, it mainly creates a virtual bridge lxcbr0 on the host. When a new container is created and connected to the network, a new pair of virtual veth interfaces are created. One segment is connected to lxcbr0 and the other end is connected to the container, as shown in Figure 1. The container is assigned a private IP address and communicates with the outside world through an address translation protocol.
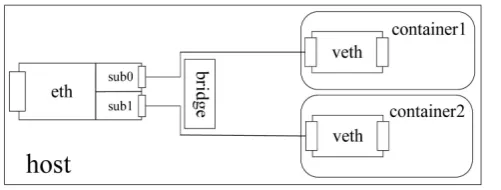
[image:3.595.264.488.627.707.2]Macvlan mode: As shown in Figure 2, the macvlan mode creates multiple virtual sub-interfaces on the physical interface. Each sub-interface is assigned a random MAC address and an IP address in the subnet of the physical interface.
DOI: 10.4236/jcc.2019.710013 139 Journal of Computer and Communications Figure 2. Macvlan mode.
The container can use such an IP address to communicate with the outside world. Although macvlan supports four different modes, here we only consider the bridge-based macvlan mode.
Phys mode: If the host has multiple physical NICs, we can leave one for the host and the rest for each container. The number of containers that this model can support is limited by the number of physical NICs, so it only makes sense when there is a small amount of container networking requirements, and it is difficult to apply to large-scale container networking environments.
3. Related Work
Claassen et al. compared the network performance of the Docker container’s bridge mode, macvlan mode, and ipvlan mode [8]. They deploy 1 to 128 con-tainer pairs on a single physical host and send continuous TCP traffic between different container pairs. The throughput test results for TCP show that for all containers on a host, the throughput rate of macvlan mode and ipvlan mode is equivalent, which is about 2.5 to 3 times higher than that of bridge mode.
Morabito et al. [9] used Netperf to test the throughput and latency of Docker containers and LXC in bridge mode. The results show that Docker and LXC can saturate 10Gbps links under TCP traffic, but the throughput of both uses UDP. The rates dropped by 42.97% and 42.14% respectively. The TCP latencies of Docker and LXC increased by 19.36% and 17.35%, respectively. The latency of UDP increased by 12.13% and 10.82%. The results show that LXC is slightly bet-ter than Docker.
Kozhirbayev et al. [10] also performed similar tests using Netperf. Compared to physical hosts, Docker’s UDP throughput was reduced by approximately 7.5%, while TCP throughput was reduced by approximately 10.0%. The LXC test results show that the UDP throughput rate is reduced by 24.9% compared to the physical host, and the TCP throughput rate is reduced by 25.8% compared to the physical host. However, when testing with the iperf tool, different experimental results appeared. Docker’s TCP throughput was reduced by 43.9%, and LXC’s throughput was down by 18.4%. The authors suspect that the size of the TCP buffer may be the cause of the difference between the two tools.
DOI: 10.4236/jcc.2019.710013 140 Journal of Computer and Communications
comprehensive, which makes it difficult to evaluate the performance differences of different networking models. In this regard, this paper analyzes the perfor-mance difference of LXC in different networking modes from the perspective of latency and throughput, and then provides support for selecting efficient con-tainer networking mechanisms.
4. Experimental Setup
4.1. Experimental Environment
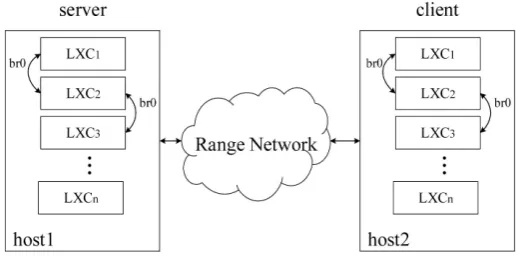
As shown in Figure 3, we use one host as the server and one host as the client, and each host has 10 LXCs deployed. The configuration is shown in Table 1.
We tested the inter-container communication between containers in the same physical host, in different physical hosts using different networking modes and different packet sizes (28 bytes, 1024 bytes). The test time was set to be 180 seconds, and the network latency and throughput rate were evaluated. The final results are averaged by 10 individual tests.
The test tool we used is the sockperf 3.5, which is a socket API-based network benchmarking utility evaluation tool, and can be used to evaluate the network system performance (such as throughput and latency) [11].
4.2. Results Description Throughput
[image:5.595.243.505.467.595.2]The throughput of the average packet per second (pps) is firstly determined by sending UDP traffic. The reason for not using TCP traffic during the experi-ment is that the TCP buffer may have an impact on the experiexperi-mental results. To avoid this effect, we use UDP traffic for testing.
Figure 3. Experimental deployment.
Table 1. Hardware configuration.
Server Client
Host system Ubuntu 16.04
CPU Inter (R) Core (TM) i5-3470 (3.2 GHz 4 Cores) Inter (R) Core (TM) i7-6700 (2.6 GHz 8 Cores)
DOI: 10.4236/jcc.2019.710013 141 Journal of Computer and Communications
Scenario 1: container networking mode performance comparison on the same host
First, deploying two containers in the same host as the server and client re-spectively, so as to test the throughput of the single container pairs; then dep-loying 20 containers (10 servers and 10 clients), so as to evaluate the communi-cation throughput of multiple container pairs.
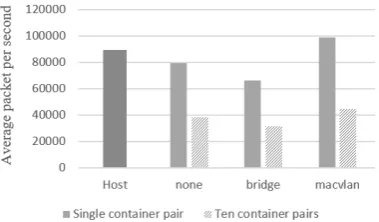
As shown in Figure 4, the pps of the physical host is firstly tested and ana-lyzed. The experimental results show that when the packet size is 1024 bytes, the pps of the host itself can reach 87,263, and when the packet is 28 bytes, it can reach 89,533. Although the packet size is reduced by about 40 times, the pps is not significantly increased, mainly because the CPU becomes a bottleneck in packet processing.
Then we give an analysis on the performance of the container networking mode. In the case of large packet transmission (here the packet size is 1024 bytes), the pps of the none mode, bridge mode, and macvlan mode are 78,308, 64,698, and 96,692 respectively for a single container pair; and the pps of the none mode, bridge mode, and macvlan mode are 37,375, 31,186, and 42,462 re-spectively for 10 container pairs.
[image:6.595.279.468.430.541.2]In the case of using small packet transmission of 28 bytes, as shown in Figure 5, for a single container pair: pps of the none mode, bridge mode, and macvlan mode are 79,355, 66,310 and 99,204 respectively. For 10 container pairs, the pps of the none mode, bridge mode, and macvlan mode are 38,446, 31,361, and 44,924 respectively.
Figure 4. Packets per second for large packet transmission between different containers in the same physical host.
[image:6.595.279.469.585.696.2]DOI: 10.4236/jcc.2019.710013 142 Journal of Computer and Communications
It can be seen from the above experimental results that as the number of con-tainers increases, the throughput of per container is significantly reduced. The main reason is that the parallel processing of the traffic increases the CPU over-head. At the same time, whether it is a single container pair or multiple contain-er pairs, the macvlan mode has the highest throughput, while the bridge mode has the lowest. The performance difference between the two is about 26% to 33%.
Scenario 2: networking mode performance comparison between containers in different physical hosts.
Firstly, deploying a container on each of the two physical hosts to form a con-tainer pair across the host, and evaluating the network throughput between them; and then deploying 10 containers on each of the two physical hosts to evaluate the network throughput between multiple containers.
The experimental results show that, without using the container, the experi-ment is directly performed on the server and the client hosts. When the packet is 1024 bytes, the pps is 3801, and when the packet is 28 bytes, the pps is 8244.
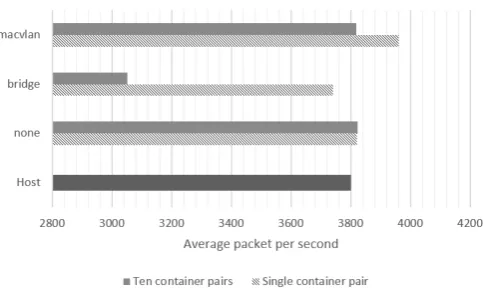
When using a large packet of 1024 bytes for cross-host transmission, as shown in Figure 6, for a single container pair: the pps of the none mode, bridge mode, and macvlan mode are 3821, 3741 and 3960 respectively; and for 10 container pairs, the pps of the none mode, bridge mode, and macvlan mode are 3823, 3052 and 3819 respectively.
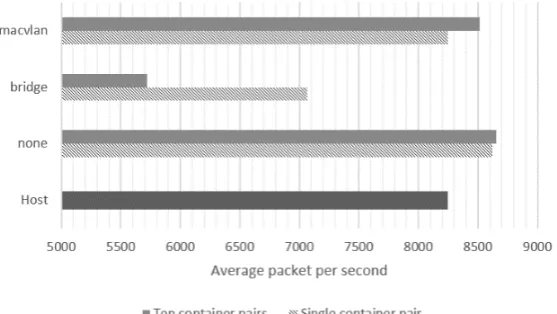
When using a small packet of 28 bytes for the cross-host transmission, as shown in Figure 7, for a single container pair, the pps of the none mode, bridge mode, and macvlan mode are 8624, 7064 and 8248 respectively; and for 10 con-tainer pairs, the pps of the none mode, bridge mode, and macvlan mode are 8654, 5717 and 8515 respectively.
In the cross-host packet transmission, when the number of parallel packets increases, the default bridge mode requires considerable overhead due to the need to forward through the NAT protocol and lxcbr0, especially in the small packet scenario of 28 bytes. The performance of the none mode and macvlan mode is almost the same, which is much better than the bridge mode.
[image:7.595.253.495.550.694.2]DOI: 10.4236/jcc.2019.710013 143 Journal of Computer and Communications Figure 7. Packets per second for small packet transmission between different physical hosts.
Latency
Here, we mainly test the average end-to-end latency of the packets transmis-sion.
Scenario 1: Comparison of the container networking mode in the same host The experimental method is similar to the method of Scenario 1 of the throughput. Firstly, the latency of the host itself is evaluated. The result shows that when using the large packet size, the latency can reach 5.690 ms, and when the packet size is small, it can reach 5.545 ms.
When the packet is a large packet of 1024 bytes, as shown in Figure 8, in a single container pair, the latencies of the none mode, the bridge mode, and the macvlan mode are 6.339 ms, 7.685 ms, and 5.130 ms, respectively; When there are 10 containers pairs, the latencies of the three are 10.800 ms, 13.395 ms, and 8.956 ms, respectively.
When grouped into small packets of 28 bytes, as shown in Figure 9, in a single container pair, the latencies of the three are 6.256 ms, 7.497 ms, and 4.994 ms respectively; and when 10 container pairs are deployed, The latencies of the three are 10.441 ms, 13.151 ms, and 8.705 ms, respectively.
The results of the two experiments are similar in terms of latency, but as the number of containers increases, the latency also increases accordingly, which mainly because the amount of data that needs to be processed in parallel in-creases, resulting in data being queued by the CPU. In the comparison of the three modes, the latency of the bridge mode is still the largest, while the latency of the macvlan is the smallest, which is even less than the latency in the bare state.
Scenario 2: Comparison of the container networking mode across different physical hosts.
[image:8.595.236.515.74.231.2]DOI: 10.4236/jcc.2019.710013 144 Journal of Computer and Communications Figure 8. Large packet transmission latency between different containers in the same physical host.
Figure 9. Small packet transmission latency between different containers in the same physical host.
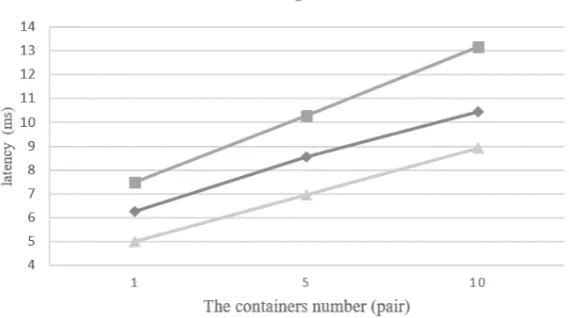
In the case of the 1024 bytes large packet transmission, as shown in Figure 10, in a single container pair, the latencies of the none mode, bridge mode, and macvlan mode are 130.486 ms, 133.299 ms, and 125.934 ms respectively. When deploying 10 container pairs, these latencies are127.104 ms, 158.864 ms, and 128.053 ms respectively.
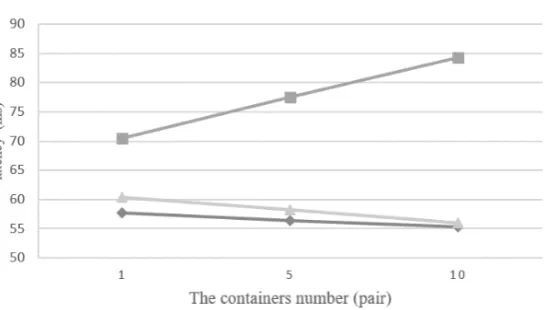
In the case of the 28 bytes small packet transmission, as shown in Figure 11, in a single container pair, the latencies of the none mode, bridge mode, and macvlan mode are 57.738 ms, 70.508 ms, and 60.409 ms respectively. While when deploying 10 container pairs, these latencies are 55.283 ms, 84.277 ms, and 56.050 ms respectively.
[image:9.595.233.518.296.455.2]DOI: 10.4236/jcc.2019.710013 145 Journal of Computer and Communications Figure 10. The latency of large packet transmission between different hosts.
Figure 11. The latency of small packet transmission between different hosts.
bridge mode has the largest network latency, which is about 17% - 25% larger than the other two. Besides, as the number of containers increases, the perfor-mance of the bridge mode becomes worse.
5. Conclusion
[image:10.595.240.513.280.435.2]DOI: 10.4236/jcc.2019.710013 146 Journal of Computer and Communications
network stack share method, which has serious security problem. Besides, the none mode cannot satisfy the large-scale container deployment requirement. Therefore, the macvlan networking mode is an optimal one for container based large-scale user behavior simulation.
Conflicts of Interest
The authors declare no conflicts of interest regarding the publication of this pa-per.
References
[1] Fang, B.X., Jia, Y., Li, A.P. and Zhang, W.Z. (2016) Cyber Ranges: State-of-the-Art and Research Challenges. Journal of Cyber Security, 1, 1-9.
[2] Docker. http://www.docker.com/ [3] LXC. https://linuxcontainers.org/
[4] Wang, K., Zhang, G.X. and Zhou, X.M. (2015) Research on Virtualization Tech-nology Based on Container. 25, 138-141.
[5] Felter, W., Ferreira, A., Rajamony, R., et al. (2015) An Updated Performance Com-parison of Virtual Machines and Linux Containers. 2015 IEEE International Sym-posium on Performance Analysis of Systems and Software (ISPASS).
https://doi.org/10.1109/ISPASS.2015.7095802
[6] Seo, K.T., Hwang, H.S., Moon, I.Y., et al. (2014) Performance Comparison Analysis of Linux Container and Virtual Machine for Building Cloud. Networking and Com-munication, 105-111. https://doi.org/10.14257/astl.2014.66.25
[7] Li, D.W. (2014) LXC-Based Large Scale IP Network Emulation and Configuration.
Journal of Nanjing Normal University (Engineering and Technology Edition), 4. [8] Claassen, J., Koning, R. and Grosso, P. (2016) Linux Containers Networking:
Per-formance and Scalability of Kernel Modules. NOMS 2016-2016 IEEE/IFIP Network Operations and Management Symposium, 713-717.
https://doi.org/10.1109/NOMS.2016.7502883
[9] Morabito, R., Kjllman, J. and Komu, M. (2015) Hypervisors vs. Lightweight Virtua-lization: A Performance Comparison. 2015 IEEE International Conference on Cloud Engineering, 386-393. https://doi.org/10.1109/IC2E.2015.74
[10] Kozhirbayev, Z. and Sinnott, R.O. (2017) A Performance Comparison of Contain-er-Based Technologies for the Cloud. Future Generation Computer Systems, 68, 175-182. http://www.sciencedirect.com/science/article/pii/S0167739X16303041
https://doi.org/10.1016/j.future.2016.08.025