Detecting High Speed Railway Subsidence and Geometry Irregularity with Terrestrial
Laser Scanning
By
Chun Liu1,2, Nan Li 1, Hangbin Wu 1 and Xiaolin Meng3
1 College of Surveying and Geo-informatics, Tongji University, 1239 Siping Road, Shanghai,
2 Key Laboratory of Advanced Engineering Surveying of NASMG, 1239 Siping Road, Shanghai,
3 Nottingham Geospatial Institute, The University of Nottingham, Nottingham, UK-
Submitted to
ASCE Journal of Surveying Engineering
Jan 2013
Detecting High Speed Railway Subsidence and Geometry
Abstract: The settlement and geometry deformation monitoring is an essential issues for the safe transportation of high speed railway. Due to the Terrestrial Laser Scanning(TLS) can acquire high
precise and density of point cloud of the survey scene based on the measurement of the
time-of-flight of an infrared pulse emitted, TLS is considered as one of most promising surveying
techniques for railway track geometry deformation monitoring. The paper proposes an approach
that using TLS to detect subsidence and irregularities of track by fitting boundary of cross section
of track. And an outdoor experiment was performed to ascertain the feasibility and accuracy of
this method, deformation parameters based on TLS has been compared with field measurement of
local railway administer, comparing result shows subsidence difference between TLS and
precise leveling is 2-3mm, difference of geometry parameters of tracks is 1-2mm. furthermore, the cause of error of TLS has been discussed.
Key words: terrestrial laser scanning, railway deformation monitoring, fitting boundary
1 Introduction
Railway track is the most important infrastructure to support the stably running of high-speed
train. Actually, safety is one of the key issues of public transportation in railways. The quality of
railway track contour dimension and geometry alignment plays an important role for rail
administrations to control safety and track maintenance. Since rail track are bearing long-term
repeated wheel power action, and track cumulative deformation caused by subgrade or ground
regional subsidence (Al Shaer, 2008)during its operation, track geometry state stability have to be
periodically checked on.
Almost all domestic and international rail administrations today make use of traditional
solution with precise level, total station, and automatic track recording cars to collect track
elevation and geometry information (Li, 2011). Periodic monitoring of the rail tracks for
settlement detection using manual precise leveling, it is carried along railway tracks to get
elevation data at every 8 sleepers, the advantage of precise leveling is the high accuracy of
millimeter magnitudes that could totally meet requirement of high-speed railway survey, but an
important limitation of the manual precise leveling is the fantastic amount of time and labor cost
For the geometry irregularities monitoring, railway branches use static and dynamical
detection solution to detect the track geometry condition so as to ensure trains run on it safely
(Cremona, 2004). Track recording trolley is a main kind of static detection method, it is
hand-pushed along the track to measure various parameters and provide instant record of track
condition and geometry(Engstrand, 2011). The main method for dynamical detection is the track
geometry car, which is an automated track inspection vehicle carried variety sensors used to test
several geometric parameters of track without obstructing normal railroad operation (Naganuma,
2008). The detective parameters of both static and dynamical methods include rail gauge, track
alignment, curvature, smoothness and the cross level of the two rails. The primary benefits of
track geometry car are the time and labor saved when compared to doing manual inspections by
track recording trolley (Ren, 2008). As track geometry car are full-sized rail cars, it can also
provide a better picture of the geometry of the track under loading. However, the principal
problem of track geometry car is that the mileage measure precision is not as well as track
recording trolley, that is to say track geometry car can’t provide correct sleeper position in
deformation area.
Besides regular method for railway track surveying, some new approaches have been
appeared to detect deformation of railway track, with rapid development of D-InSAR (satellite
Differential Interferometric Synthetic Aperture Radar technology) was applied to detect subgrade
deformation over permafrost regions(Tan Qulin, 2010). For the railway status checking, an
efficient composite technique with real-time image processing has been represented (Alippi.,C, et
al, 2000). Obviously, some new no-touch detection solution shall be developed for the railway
track deformation. So this paper proposes a method using TLS (Terrestrial Laser Scanning) for
track subsidence and geometry deformation detection. TLS is an emerging technology that offers
an opportunity to collect dense 3D point data over an entire object or surface of interest in a few
minutes. Benefit from the key advantages of TLS, such as remote measurement, a permanent
visual record and high spatial data density, without the requirement of targets, the TLS becomes a
new measurement for surface deformation in engineering geodesy field (Fröhlich, 2004). There
has been several research about TLS used into deformation monitoring, such as sea lock, tunnel
and landside. Tsakiri describe a deformation measurement of a sea lock using a laser scanner
in the convergent deformation of existing metro tunnel(Li, Jian, et al, 2012). Meanwhile, TLS also
can be applied into landslide monitoring through directly comparing Digital Elevation Model from
different TLS campaigns (Bitelli, 2004).
Since the railway track irregularity is very important for railway transportation. Traditional
manual monitoring method cost too much time and labor to finish whole railway line survey,
although track geometry car can obtain track geometry information by running on the track, it
cannot provide accuracy mileage position. Due to the terrestrial scanner can achieve high-precise
three dimensional data in a short time, this paper presents the workflow for processing raw TLS
data collected by Leica scanner and analyses the method of calculating the settlement and
irregularity of railway track using discrete laser points. As a case study experiment, TLS data has
been applied to detect track deformation over the regions of Tianjin-Beijing intercity high-speed
rail in China at Wuqing railway station. The result of a test under outdoor conditions which aimed
at determining the sensitivity of laser scanning in order to detect track deformations is presented.
Meanwhile, the detect result using TLS data is compared with the data measured by leveling and
track recording trolley.
2 Data Capture based on TLS
2.1 Observation Environment
The test railway track belongs to the Beijing-Tianjin intercity rail line, which was the first
high-speed railway in China and start its operating since 2008. As speeds of trains over 300km/h
on this railway section, long time loaded running may cause the track settle down or geometry
deformation. Furthermore according to the usual monitoring data, obvious settlement has been
occurred in the test section of intercity railway, which means this area need intensive monitor in
order to ensure train running safety and stability.
The scan experiment was performed at Wuqing Railway Station at midnight when the trains
stop running. The selected area in figure1 identify the location of test area in the Beijing-Tianjin
intercity rail line, and detail surrounding environment of test area can be seen from the satellite
image in the figure1. Railway tracks in this experiment begin at railway mileage of JJK4+745.2,
Figure 1. Position and environment of test area
2.2 Instrument
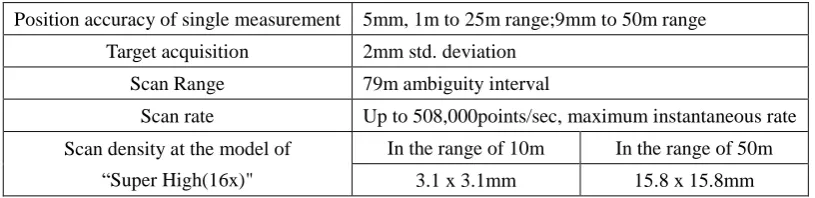
The terrestrial laser scanner Leica6100 was chosen for the measurements. Table1 presents the
key performance specifications of the Leica 6100 scanner. According to specifications, the
position accuracy of single measurement is less than 5mm in the range of 25m, which is
acceptable in the study, but the position accuracy becomes too low out of the range of 50m which
mean the scan points cannot be used in the research in this paper. Another important parameter of
scanner is the scan density, which vary a lot at different scan mode. The best result of scan density
can reach 1.6 x 1.6mm in the range of 10m and 7.9 x 7.9mm in the range of 50m in the model of
“Ultra High”, but it take nearly 30 minutes to finish whole scene scanning which cost too much time
on scan. Given that consideration, scan model of “Super High” is chosen in the outdoor survey, 360°x
310°field of view scanning only needs 6-7minutes, both the time costing and point density is available
for further processing.
Table1. Key Performance Specifications by using Leica HDS6100
Position accuracy of single measurement 5mm, 1m to 25m range;9mm to 50m range
Target acquisition 2mm std. deviation
Scan Range 79m ambiguity interval
Scan rate Up to 508,000points/sec, maximum instantaneous rate
Scan density at the model of “Super High(16x)"
In the range of 10m In the range of 50m
3.1 x 3.1mm 15.8 x 15.8mm
2.3 Data collection
TLS has been carried out along the railways. Laser scanner was positioned on the ground in
the middle of two tracks. Black and white planar target is placed on the tracks surface and CPIII
(Third-Class Control Points) bench mark. Figure1a has described the scanner position and targets
of multi-period scan points located in the same mileage, scan points would be orientated to the
local project coordinate system based on the CPIII coordinates. To ensure the registration accuracy,
there are at least 3 targets placed on the CPIII in a scanning station. Meanwhile, the targets on the
tracks are used to identify the mileage of track, so that the position of track could be recognized.
[image:6.595.90.501.195.358.2]Figure1b and figure1c are the image of target on the track and target on the CPIII bench mark.
Figure 2. Scanner and targets position plan of scanning outside
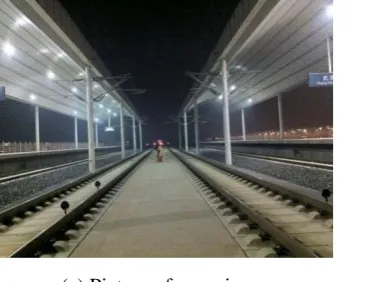
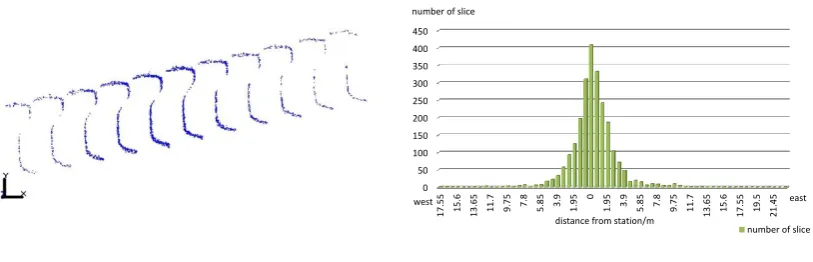
Scanning result can be seen as following figure3. Figure 3(a) is the real image of scanning
field and figure 3(b) is scan points drawn by intensity, the scanning points density is 3-4mm
within the range of 10m, but points becomes very sparse out the range of 15m.
(a) Picture of scanning scene (b) Point cloud of scanning scene Figure 3. Field scanning with TLS at case study area
3 Deformation Analysis on High-speed rail
3.1 Flow of the Processing
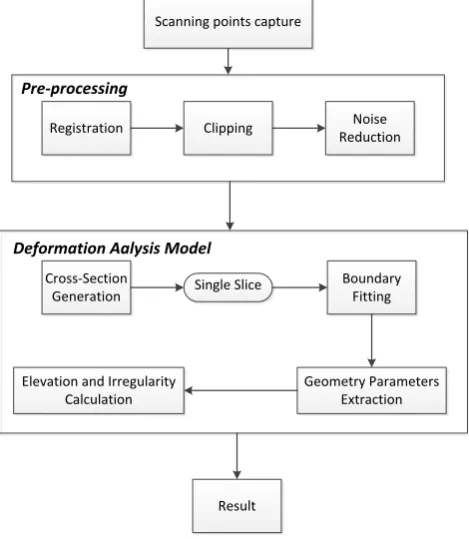
From the above, procedure to obtain subsidence and irregularities concluded as following
steps, firstly, raw TLS data need to be pre-processed in order to reduce noise and unify coordinate
system. Then multi-slices of railway track is generated, meanwhile, boundary of cross section of
[image:6.595.112.299.452.593.2]estimated according to the fitting boundary of track. And the flowchart can be seen as figure4.
Scanning points capture
Registration Clipping ReductionNoise
Cross-Section Generation
Boundary Fitting
Elevation and Irregularity Calculation
Geometry Parameters Extraction
Result
Pre-processing
Deformation Aalysis Model
[image:7.595.180.415.103.373.2]Single Slice
Figure 4. Work flow of processing
3.2 Pre-processing on the observation
Pre-processing is the first step of whole processing which contains three main steps: scan
point registration, clipping and noise reduction. Since the coordination of raw points collected by
laser scanner is independent from each other, first of all, raw point need to unify coordinate in
order to obtain settlement in the same area. The registration is operated in the software of
“Cyclone” which is the accompanying software of Leica laser scanner. “Common points method”
is used in this software for multi station points registration, common points method uses three
common points both in two different scan stations to calculate coordinate transformation
parameters (Dold, 2006). As this registration method is simple and reliable, it has been applied in
many kinds of TLS scanner’s software (Wang, 2009). There are at least 3 black and white target
placed in the CPIII at each scan station in order to ensure registration operation. Since the CPIII is
a permanent surveying marker, meanwhile, the plane coordinates and elevation of CPIII is
measured by connecting base point far away from the test area every month, that is to say,
although the CPIII is nearby the monitoring railway track, CPIII still could be considered as the
stable position. Therefore the center of target can be used as comment point among multi-period
The main purpose of clipping is to delete redundant points. As it is the 360°field of view
scanning, raw point cloud contains various objects such as railway tracks, trees and telegraph
poles et al, only railway tracks points is useful for this experiment, the rest of points should be
delete to reduce data size, and track points remain to research study.
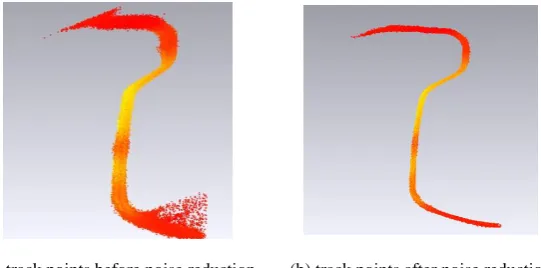
Noise reduction is also an essential procedure in order to obtain precise points of railway
tracks. The effect factors of surveying error by TLS can be include as the precise of instrument,
material of reflector, environment(Sylvie, 2007). In this case, error points are mainly caused by
laser random error, smooth surface of track, dust in the air and other inevitable factors. Most
incident laser light are reflected as the high reflection of track surface (Zhen, 2005), so there are
lots of noise points on the surface of track which can be shown as figure5(a). Furthermore track
surface is also the essential part to estimate elevation and geometry parameters. Using the
software of ”Geomagic” with manual intervention to reduce those noise points, isolated points that
far away from main points of track surface would be selected to delete in the Geomagic, but there
are still remnant noise points on the surface or other parts of track, using manual selection to clear
noise point and smooth points of track are obtained which shown as figure 5(b).
[image:8.595.164.435.425.559.2](a) track points before noise reduction (b) track points after noise reduction
Figure 5. Noise reduction on track points cloud
3.3 Deformation Analysis Model
(1) Cross-section Generation
The cross-section generation is that cutting track points into multi slices in the direction that
parallel with track vertical plane as well as along the track extending direction. Half vertical shape
of track can be represented from single slice which means vertical boundary of track is fitted
based on every single slice. Considering the interval of track sleeper is 0.65m and track elevation
is measured on the location of sleepers which used to identify the mileage of track in precise
defined at interval of 0.65 with the thickness of 1mm. Too large thickness would cause fitting error,
and the value of 1mm is the best based on repeated test. The result of cross-section is as figure6
shown.
[image:9.595.95.502.154.285.2](a) Cross-section generation result (b) The distribution of point number in single slice
Figure 6. Result of cross-section from track points cloud
According to the figure6(a), the points of slice are very dense nearby the scanner and the
points become sparse where far away from scanner. Fitting boundary needs at least 20 points in
the slice based on fitting test. For this reason, slices located out a certain range of scanner are not
effective to fit boundary. In order to verify effective distance range, the distribution of point
number in every slice in one scan station is shown as figure6(b). The points are very dense within
2.5m of scanner, the points number are more than 100, but the points become very few and sparse
outside 8m of scanner. Thus the effective distance can be considered as about 15m in one scan
station.
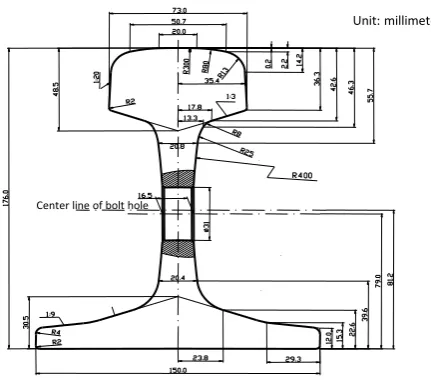
(2) Boundary Fitting
Since the discrete of scan points and sampling interval of laser scanning, measurement
directly from points causes lots of error. Fitting the track vertical boundary could reduce those
errors, Elevation and various geometry parameters could also be estimated from the vectorial
boundary. As the shape of cross section of track is not regular curves or lines, the fitting method is
based on the given design cross section drawing of track, which has been shown in figure7.
0 50 100 150 200 250 300 350 400 450
17
.55 15.6
13
.65 11.7 9.75 7.8 5.85 3.9 1.95 0 1.95 3.9 5.85 7.8 9.75 11.7
13
.65 15.6
17
.55 19.5
21
.45
number of slice distance from station/m
number of slice
west east
Figure 7. Given design of cross section in high –speed rail track
The cross section of track is consist of curves of different curvature, for this reason, slice
points of cross section should be classified into several kinds of groups that belong to the same
curvature curves. Under the condition of only half cross section of track points are achieved,
points of different kind of curves can be obtained by horizontal and vertical size. The
classification method involves three steps, the first step is to divide slice point into two parts
according the point elevation, first part is upon the center line of bolt hole in the figure 7, we call it
partⅠ. Another is under the red line, we call it partⅡ. The second step is the classification of part
Ⅰ, finding the rightmost points as base point, partⅠ is divided to 2 group with different
curvature curve according to the horizontal size. Finally, the partⅡ can be easily divided into 4
kinds of curves or lines by the vertical size. Result of classification has been shown as figure8(a),
points of different color represent various parts of cross section of track.
After the classification, points of each segmentation are fitted to curves or lines by using
Least Square in the three dimensional space(Pan, 2008). As the curve radium is given, all
unknown parameter are three dimensional coordinate of the center of curve. This paper has taken
indirect adjustment with conditions method to resolve the parameters of space curve, and
co-planarity equation of slice points is considered as the condition. The fitting result is shown as
figure8(b), the fitting line are very close to points, furthermore, shape of track is well drawn
through fitting boundary of cross section of track. Center line of bolt hole
(a) Classification of cross-section of track (b) Boundary fitting result of cross-section of track
Figure 8. Classification result of the track point cloud
(3) Elevation and Irregularities Calculation
The elevation and irregularities of track are calculated based on the fitting cross section of
track. As the green curve in the figure8b represents the surface of track, elevation and coordinate
of center of track can be estimated by finding the center of the green curve. After that, the
difference elevation between right and left tracks is super elevation. Coordinate of center of
multi-period can also be calculated. Finally, distance of the yellow lines between right and left
tracks is considered as gauge based on the Chinese High-Speed Survey Specification.
4 Case Study
4.1 multi-period elevation data of study rail
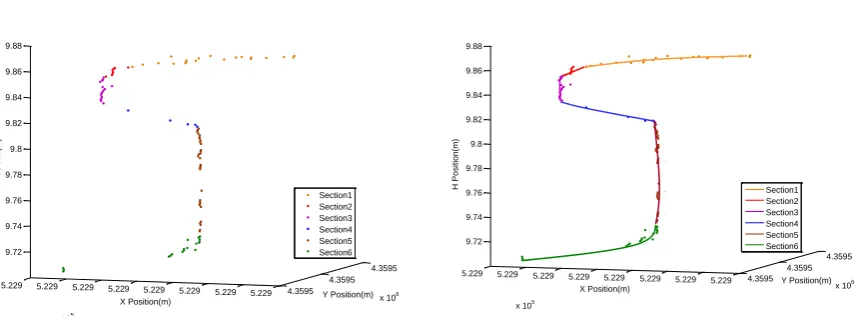
Figure 9 is the result of multi-period elevation calculated from TLS from mileage
JJk84+745.2 to JJK85+083.5, the gap between every data line is due to the fact that these area is
too far away from scanner to get enough points to estimate elevation. Average distance of gap is
about 15m long between every scanning station. Besides that, the elevation increases gradually
along the mileage in three periods with increment of 1-3cm. According to the figure9, the
elevation from July to September doesn’t change much, but it happen obvious settlement from
September to November, the subsidence even reach 6-7cm.It owing to the test area has occurred
regional subsidence, related to the elevation of substructure of monitoring high-speed railway
track descent largely, the track elevation charges very much as well.
5.229 5.229 5.229 5.229 5.229 5.229 5.229 5.229
x 105
4.3595 4.3595
4.3595
x 106
9.72 9.74 9.76 9.78 9.8 9.82 9.84 9.86 9.88
Y Position(m) X Position(m)
H Positio
n(m)
Section1 Section2 Section3 Section4 Section5 Section6
5.229 5.229 5.229 5.229 5.229 5.229 5.229 5.229
x 105
4.3595 4.3595
4.3595
x 106
9.72 9.74 9.76 9.78 9.8 9.82 9.84 9.86 9.88
Y Position(m) X Position(m)
H Positio
n(m)
[image:11.595.302.520.77.229.2]Figure 9.Multi-period elevation detected by TLS
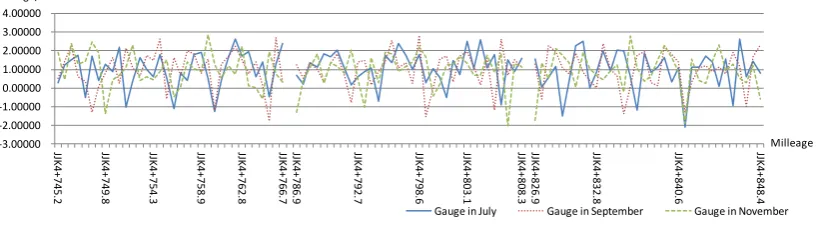
4.2 Irregularities Detective
The irregularities refer to detection of various geometry parameters of track, which includes
gauge irregularities, superelevation, coordinate difference between measured and design et al.
Gauge irregularities is the difference between measured and design gauge. The detection result of
gauge has been shown in figure 10. The gap between data is due to the few scanning data as
described in 4.1, and gauge detected along mileage changes relatively variable in the range of
-2mm to 2.8mm. The tolerance of gauge detection in Chinese high-speed survey standard is less
than 2 mm, and most of gauge detected by TLS are within the standard tolerance. However, there
are still a few gauges irregularities beyond 2mm, the maximum gauges irregularities within 3mm.
Figure10. Multi-period gauge irregularities detected by TLS
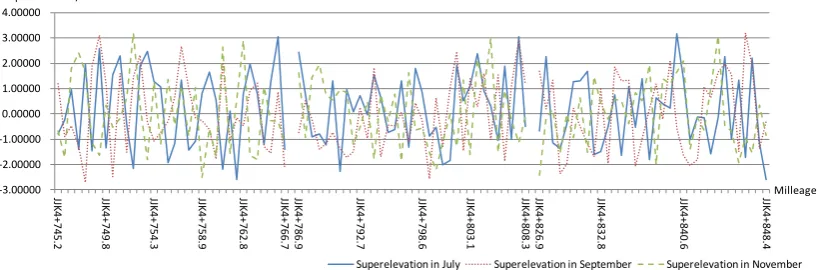
Superelevation is the elevation difference between right and left track in the same sleeper.
According to Chinese high-speed survey standard, the tolerance of superelevation is 2mm. From
result of superelevation estimated by TLS which shown as figure11, superelevation estimated
from TLS data change more variable compared to the gauge result, it changes in the range of
-5mm to 3mm. 89% of superelevation calculated by TLS are within 2mm, only few superelevation
9.72 9.74 9.76 9.78 9.8 9.82 9.84 9.86 9.88 9.9 JJK 4 + 7 4 5 .2 JJK 4 + 7 5 1 .1 JJK 4 + 7 5 7 .6 JJK 4 + 7 6 4 .1 JJK 4 + 7 6 9 .3 JJK 4 + 7 8 4 .3 JJK 4 + 7 9 0 .1 JJK 4 + 7 9 6 .6 JJK 4 + 8 0 3 .1 JJK 4 + 8 0 8 .3 JJK 4 + 8 2 4 .3 JJK 4 + 8 3 0 .2 JJK 4 + 8 3 6 .7 JJK 4 + 8 4 3 .2 JJK 4 + 8 4 8 .4 JJK 4 + 8 6 3 .4 JJK 4 + 8 6 9 .2 JJK 4 + 8 7 5 .7 JJK 4 + 8 8 2 .2 JJK 4 + 8 8 7 .4 JJK 4 + 9 0 2 .4 JJK 4 + 9 0 8 .3 JJK 4 + 9 1 4 .8 JJK 4 + 9 2 1 .3 JJK 4 + 9 2 6 .5 JJK 4 + 9 4 1 .5 JJK 4 + 9 4 7 .3 JJK 4 + 9 5 3 .8 JJK 4 + 9 5 9 .7 JJK 4 + 9 6 3 .6
Elevation in July Elevation in September Elevation in November
Elevation/mm Milleage -3.00000 -2.00000 -1.00000 0.00000 1.00000 2.00000 3.00000 4.00000 JJK 4 + 7 4 5 .2 JJK 4 + 7 4 9 .8 JJK 4 + 7 5 4 .3 JJK 4 + 7 5 8 .9 JJK 4 + 7 6 2 .8 JJK 4 + 7 6 6 .7 JJK 4 + 7 8 6 .9 JJK 4 + 7 9 2 .7 JJK 4 + 7 9 8 .6 JJK 4 + 8 0 3 .1 JJK 4 + 8 0 8 .3 JJK 4 + 8 2 6 .9 JJK 4 + 8 3 2 .8 JJK 4 + 8 4 0 .6 JJK 4 + 8 4 8 .4
Gauge in July Gauge in September Gauge in November Gauge/mm
at the edge of scanning range is unreasonably large, such as one or two values reach -5mm, three
values reach 3mm. However, these values above tolerance are mainly caused the point discrete
and sampling interval on the surface track. Compared to the gauge detection, the discrete of
superelevation is more obviously, which due to material of track surface is too smooth and noise
[image:13.595.113.523.202.337.2]points will increase on that material.
Figure 11. Multi-period superelevation detected by TLS
The displacement of center of track is also an essential parameter of railway irregularities,
center coordinate of track that calculated by TLS in July are taken as reference, the displacement
of track center coordinate from July to September and displacement from September to November
are estimated by comparing to the reference coordinate. Result of center coordinate displacement
has been shown in figure12. It turns out the offset have a very variable value, offset values are quit
small in the middle of each data line, however, offset value become large in the beginning and end
of each data line. That due to points on the surface of track becomes fewer in those positions far
away from scanner compared to the position nearby scanner, number of points isn’t enough to get
precise center coordinate of track.
The offset value mostly below 2mm in September result chart, and reach 4-6mm in edge
position. Offset value is bigger in November result chart compared to result in September, which
mainly caused by the regional settlement. -3.00000
-2.00000 -1.00000 0.00000 1.00000 2.00000 3.00000 4.00000
JJK
4+
74
5.2
JJK
4+
74
9.8
JJK
4+
75
4.3
JJK
4+
75
8.9
JJK
4+
76
2.8
JJK
4+
76
6.7
JJK
4+
78
6.9
JJK
4+
79
2.7
JJK
4+
79
8.6
JJK
4+
80
3.1
JJK
4+
80
8.3
JJK
4+
82
6.9
JJK
4+
83
2.8
JJK
4+
84
0.6
JJK
4+
84
8.4
Superelevation in July Superelevation in September Superelevation in November Superelevation/mm
Figure 12. Coordinates displacement of track center detected by TLS
4.3 Result Analysis
(1) Settlement Comparison
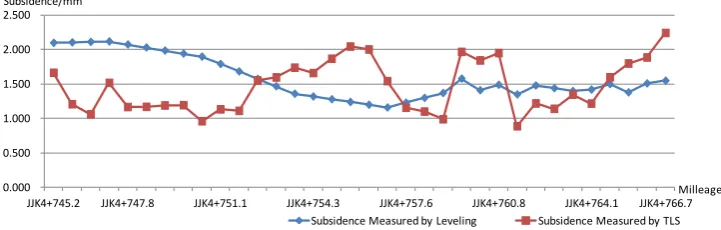
Figure13shows the cumulative subsidence results measured by precise leveling and TLS in
the mileage range of JJK84+744 to JJK84+753. Figure13a is subsidence from July to September,
while figure13b is subsidence from September to November in 2011. These sections of railway
track have a minor subsidence of less than 2mm base on the precise leveling data from July to
September, the slope of subsidence detected by TLS is relatively large compared to the leveling
data, which mainly due to discrete and sampling interval of laser data. According to the figure13a,
the subsidence from TLS changes around the red line which represents precise leveling
measurement result, the subsidence difference between precise leveling and TLS is about 1mm.
Subsidence is relatively large from September to November based on figure13b, the difference
between measurement of precise leveling and TLS is relatively big at the mileage of JJK752.0 to
JJK752.4, that mainly caused by inaccurate elevation calculated by few points in the location
where far away from scanner.
(a) Settlement result comparison at scanning station1 in September
-6 -4 -2 0 2 4 6 JJK 4 + 7 4 5 .2 JJK 4 + 7 4 9 .8 JJK 4 + 7 5 4 .3 JJK 4 + 7 5 8 .9 JJK 4 + 7 6 2 .8 JJK 4 + 7 6 6 .7 JJK 4 + 7 8 6 .9 JJK 4 + 7 9 2 .7 JJK 4 + 7 9 8 .6 JJK 4 + 8 0 3 .1 JJK 4 + 8 0 8 .3 JJK 4 + 8 2 6 .9 JJK 4 + 8 3 2 .8 JJK 4 + 8 4 0 .6 JJK 4 + 8 4 8 .4
Displacement of X in September Displacement of Y in September Displacement of X in November Displacement of Y in November Displacement/mm Milleage 0.000 0.500 1.000 1.500 2.000 2.500
JJK4+745.2 JJK4+747.8 JJK4+751.1 JJK4+754.3 JJK4+757.6 JJK4+760.8 JJK4+764.1 JJK4+766.7 Subsidence Measured by Leveling Subsidence Measured by TLS Subsidence/mm
(b) Settlement result comparison at scanning station1 in November
Figure13. Cumulative subsidence results measured by precise leveling and TLS
Figure14 presents the statistic error of subsidence compared to leveling data. The most of
error values are below 2mm of data in September and 3mm of data in November, but there are
some big errors of 4-8mm which gathering in the same scanning station. These scanning stations
with big errors are during the mileage of JJK4+866.0 to JJK4+887.4 both in subsidence result of
September and November. The main reason for error increase is that the CPIII mark is damaged a
little in these stations. That is to say, elevations of targets positioned on the damaged CPIII mark is
different from other targets on the CPIII bench mark, these problem targets’ elevation need to be
reassessed by manual label line inscribed on the target which brings lots of error in coordinate
registration of scanning data.
(a) Subsidence error in September
(b) Subsidence error in November
64.000 64.500 65.000 65.500 66.000 66.500 67.000 67.500 68.000 68.500
JJK4+745.2 JJK4+747.8 JJK4+751.1 JJK4+754.3 JJK4+757.6 JJK4+760.8 JJK4+764.1 JJK4+766.7
Subsidence Measured by Leveling Subsidence Measured by TLS Subsidence/mm Milleage -3.00 -2.00 -1.00 0.00 1.00 2.00 3.00 4.00 5.00
Subsidence Error in September
JJK 4+7 86 .9 JJK 4+8 26 .9 JJK 4+8 08 .3 JJK 4+8 48 .4 JJK 4+7 66 .7 JJK 4+7 45 .2 JJK 4+9 07 .6 JJK 4+8 87 .4 JJK 4+8 66 .0 JJK 4+7 98 .6 JJK 4+7 54 .3 JJK 4+9 62 .9 JJK 4+9 42 .8 JJK 4+9 26 .5 JJK 4+9 51 .9 JJK 4+9 16 .7 JJK 4+8 77 .7 JJK 4+8 36 .0 Subsidence Error/mm Milleage -4.00 -2.00 0.00 2.00 4.00 6.00
Subsidence Error in November
Figure 14 Statistic error of subsidence compared to leveling data
(2) Irregularities Comparison
Take the irregularities of gauge and superelevation detected by track inspection car as the
standard data, the comparison is shown as following figure15 and figure16. Offset between
method of TLS and track inspection car is about 1-2mm. The gauge calculated by using TLS
changes variable as same as the standard data along railway mileage, however, the change of
superelevation of standard data is much more smooth than superelevation calculated by using TLS.
That mainly owns to the discrete and few points on the surface of track, elevation also turn out
with discrete.
Based on the comparison result, gauge irregularities result is better than superelevation result,
superelevation changes much more variable than standard data which is not agree with practice
situation. Superelevation is related to the elevation calculation. The main reason for error of
elevation calculation is that smooth material of surface of track may cause more noise points and
scanner achieves less point on this kind of material, noise reduction processing cannot eliminate
error points completely, thus there are more errors in elevation calculation.
Figure15 Gauge irregularities comparison
Figure16 Superelevation comparison
-3.00000 -2.00000 -1.00000 0.00000 1.00000 2.00000 3.00000 JJK 4+7 45 .2 JJK 4+7 49 .8 JJK 4+7 54 .3 JJK 4+7 58 .9 JJK 4+7 62 .8 JJK 4+7 66 .7 JJK 4+7 86 .9 JJK 4+7 92 .7 JJK 4+7 98 .6 JJK 4+8 03 .1 JJK 4+8 08 .3 JJK 4+8 26 .9 JJK 4+8 32 .8 JJK 4+8 40 .6 JJK 4+8 48 .4
Gauge measured by TLS Gauge measured by track inspection car Gauge/mm Milleage -3.00000 -2.00000 -1.00000 0.00000 1.00000 2.00000 3.00000 4.00000 JJK 4+7 45 .2 JJK 4+7 49 .8 JJK 4+7 54 .3 JJK 4+7 58 .9 JJK 4+7 62 .8 JJK 4+7 66 .7 JJK 4+7 86 .9 JJK 4+7 92 .7 JJK 4+7 98 .6 JJK 4+8 03 .1 JJK 4+8 08 .3 JJK 4+8 26 .9 JJK 4+8 32 .8 JJK 4+8 40 .6 JJK 4+8 48 .4
Superelevation measured by TLS Superelevation measured by track inspection car Superelevation/mm
5 Conclusion
An experiment using TLS is presented in order to detect the subsidence and irregularities of
railway track, in this paper. To identify the accuracy of this method, results of TLS are compared
to the leveling and track inspection car data. It turns out the elevation error is 2-3mm, gauge and
superelevation error is 1-2mm. these errors are mainly due to discrete of TLS, laser sampling
interval and material of track surface. An obvious limitation of TLS in this paper is the gap of
points between every scanning station caused by scanning range and precise of this scanner. With
the development of scanner, the limitation will be solved, meanwhile precise of laser points can be
improved.
In summary, with low cost and little field surveying work, TLS technology can improve
efficiency and work condition for railway track deformation monitoring. It has very important
engineering significance for railway infrastructure long-term deformation monitoring. The unique,
continuous subsidence or irregularities information of points
Acknowledge
This work is supported by “973” National Basic Research Program of China (No:
2013CB733204), and the authors would like to thank German Society for Tianjin Railway Survey
Design Institute Group Corp for providing admission to surveying high-speed track and give
assistance to field laser scanning.
References
Al Shaer, A., Duhamel, D., Sab, K., et al.,2008. Experimental Settlement and Dynamic Behavior of a Portion of
Ballasted Railway Track under High Speed Trains[J]. Journal of Sound and Vibration, 316, pp211-233.
Alippi, C., Casagrande, E., Scotti, F., et al, 2000. Composite Real-Time Image Processing for Railways Track
Profile Measurement[J]. Instrumentation and Measurement, 49(3), pp.559-564.
Brochure for Leica-HDS6100
Cremona, C., 2004. Dynamic Monitoring Applied to the Detection of Structural Modifications: A High-Speed
Railway Bridge Study[J]. Progress in Structural Engineering and Materials,v6(3),147-161.
Ding, J.H., 2009. Surveying Characteristics of High-Speed Railway Engineering[J]. Railway Investigation and
Survey, 35(5),1-4.
Dold, C., Brenner, C., 2006. Registration of Terrestrial Laser Scanning data Using Planar Patches and Image
Data[J]. In: IAPRS, XXXVI, 5, Dresden, Germany, 78–83.
Engstrand, A., 2011. Railway Surveying- A Case Study of the GRP5000[M]. Sweden: Royal Institute of
Technology, Division of Geodesy and Geoinformatics.
InternationalArchives of Photogrammetry,Remote Sensing and Spatial Information Sciences 36(Part 8/W2),
7–13.
Li, S.W., 2011. Application Discussion on Settlement Monitoring Methods for High-speed Railways[J]. Railway
Investigation and Surveying, 37(6), pp.16-19.
Naganuma, Y., Kobayashi, M., Nakagawa, M., Okumura, T., 2008. Condition Monitoring of Shinkansen Tracks
using Commercial Trains, International Conference on Railway Condition Monitoring 2008
Tan, Q,L,. Xie, C,. Yang, S,L,. 2010. A New Surveying Technology for Railway Subgrade Settlement Deformation
Monitoring: A Case Study[C]. International Conference on Railway Engineering.
Taskiri, M., Lichit, D., Pfeifer, N.,2006. Terrestrial Laser Scanning for Deformation Monitoring[C]. Proc. 12th FIG
Symposium on Deformation Measurement and 3rd IAG Symposium on Geodesy for Geotechnical and
Structural Engineering, Baden, Austria,22-24 May.
Bitelli, G., Dubbini, M., Zanutta, A., 2004. Terrestrial Laser Scanning and Digital Photogrammetry Techniques to
Monitor Landslides Bodies[J]. International Archives of Photogrammetry, Remote Sensing and Spatial
Information Sciences 35(Part B5),246-251.
Li, J., Wan Y.C., Gao, X.J., 2012. A New Approach for Subway Tunnel Defaomtion Monitoring: High-Resolution
Terrestrial Laser Scanning. International Archives of the Photogrammetry, Remote Sensing and Spatial
Information Sciences, Volume XXXIX-B5, 2012 XXII ISPRS congress,25 August-01 september 2012,
Melboune, Australia.
Pan, G.R., Chen, X.L., 2008. A New Method for 3D Circular Object Fitting[J]. Journal of Geodesy and
Geodynamics, v28(2), 92-94.
Ren, Z.Q., 2008. The Application of GJ-5 Type High-Speed Track Inspection Car In the Track Irregularity Test[M].
China: Southwest Jiaotong University, Road and Railway Engineering.
Sylvie S., Jane V. R., Alexander B., Roderik L., 2007. Error budget of Terrestrial Laser Scanning: Influence of the
Incidence Angle on the Scan Quality. In: Proc. in the 3D-NordOst 2007, Berlin, Germany.
Specifications for Survey Engineering of High Speed Railway
Technical Specification for Steel Rail of 60kg/M of Beijing-Shanghai High Speed Railway
Wang, L., Li, G.Y, 2009. Registration of Multiple View for Terrestrial Laser Scanner[J], Infrared and
Engineering,v38 Supplement,417-420.
Zhen, D.H., Shen Y.Z., Liu C., 2005. 3D Laser Scanner and Its Effect Factor Analysis of Surveying Error[J].