for the Detection of Fluorescent Solution Flow
Fuhong Cai1, *, Meng Zhao1, and Dan Wang2
Abstract—Light sheet microscope is a versatile imaging tool for high imaging speed and signal to noise ratio (SNR). In this type of system, the illumination is perpendicular to the direction of detection. Due to its structural feature of perpendicular detection, the SNR is comparable to total internal reflection fluorescence (TIRF) microscopy. Therefore, the perpendicular detection system is of great application prospect. In this paper, we develope a compact optical perpendicular detection system, which can not only be utilized to measure fluorescence with high SNR, but also capture a fluorescent image of flow fluorophore.
1. INTRODUCTION
Light sheet microscopy (LSM) is a fluorescence microscopy technique with excellent optical sectioning feature [1, 2]. Meanwhile, LSM is a CCD-based imaging tool and is found capable of high-speed imaging [3]. At present, LSM has a very wide range of applications. Combined with optical clarity technology, LSM can be used to carry out rapid whole body imaging for mice [4]. LSM is becoming an important imaging platform for super-resolution imaging for photoactivation localization microscopy (PALM) and structure imaging microscopy (SIM) [5, 6]. However, the LSM system is still a developing optical system. How to develop an optical system to meet the needs of life-science scientists is still a research focus. For example, the imaging samples are mounted in a transparent cylindrical glass rod. However, in the conventional imaging microscope, the samples are placed on the stage. This difference has caused great inconvenience to the life-science scientists.
In this paper, a compact perpendicular detection system is developed. The sample can be placed horizontally. We are going to illustrate the details of the optical system; therefore, readers can gain a better understanding of our work. Someone can easily set up their own detection system based on the information about this paper. By using this system, fluorescent spectrum detection and light sheet imaging are performed. Through the fluorescent spectrum detection experiment, the high signal to noise ratio (SNR) can be illustrated. This LSM system is also found to possess rapid imaging ability.
2. THE PERPENDICULAR DETECTION SYSTEM
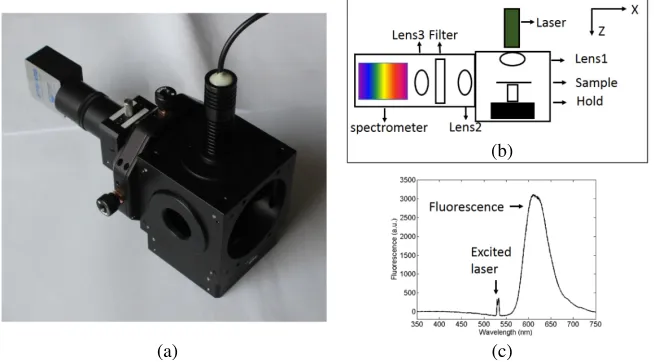
The perpendicular detection system (shown in Fig. 1) consists of three modules: 1. Excitation laser module, 2. Fluorescent detection module and 3. Sample holding module. Most of the elements in the system are purchased from Thorlabs, whose optical and optomechanical elements can be easily connected through their special adapters. In the excited laser module, the SM1L10 (Thorlabs) tube is utilized to hold a doublet lens (Lens1 in Fig. 1) and a laser. The lens focuses the laser on the sample. In fluorescent
Received 2 February 2017, Accepted 31 March 2017, Scheduled 18 April 2017
* Corresponding author: Fuhong Cai ([email protected]).
(a)
(b)
(c)
Figure 1. (a) The system diagrams for perpendicular detection system. (b) Structural sketch diagram, the laser propagations along Z axis. Lens1 is utilized to focus the laser on the sample, and the focal spots of Lens1 and Lens2 are coincident. The fluorescence goes through Lens3 and focus on the slit in spectrometer. (c) The detection fluorescent spectrum, as the filter is removed (see the text), which illustrate perpendicular detection system can avoid the interference from excited laser.
detection module, the divergent fluorescence is collimated by another doublet lens (Lens2) and passes through a filter to block the scattering excited laser. Then the fluorescence is focused on the slit inspectrometer (STS, Ocean Optics) by Lens3. It is worth mentioning that a fiber-based spectrometer is transformed into a traditional spatial optical detection module. If a fiber is used, its length is at least 60 mm (the length of the fiber adapter is about 30 mm; there are two adapters in one fiber). In our system, a lens with a focal length of 20 mm can realize the collection of light beams. In this way, the detection module can work without a fiber, which is a slender line and reduces system compactness. However, not using fiber increases the difficulty of system adjustment. Therefore, a CXY2 (Thorlabs), which can provide±2 mm of travel perpendicular to the optical axis, is used to aim the focal spot on the slit in the spectrometer. In addition, a CFH2 (Thorlabs) is used to hold a filter. The reason for choosing CFH2 is that the filter can be manually changed conveniently. The sample hold module is based on a C6W (Thorlabs). An SM05L10 is served as a sample hold, which is connected to C6W by SM1A6 and SM2A6. The excited laser module and fluorescent detection module are connected to C6W by SM2A6 and ER1-P4, respectively.
In order to demonstrate high SNR of the perpendicular detection system, a fluorescent detection experiment is performed without a laser blocking filter. The fluorescence emitted from a rhodamine (CAS ID:81-88-9) can be efficiently collected by the spectrometer. The detection spectrum is shown in Fig. 1(c). Commonly, the absence of the filter will lead to CMOS saturation due to the detected laser (In STS spectrometer, a line CMOS is served as the detection) [7]. However, only a small laser peak present at the detection spectrum in Fig. 1(c), which is the scattering laser light from the glass plate. The high SNR of the perpendicular detection system can be testified through this experiment. Because laser has the characteristic of good direction, in the perpendicular detection system, only scattering light can interfere the measurement. The scattering coefficient of the solution is almost zero; therefore, the SNR of this perpendicular system is very high. When a filter is inserted to the CFH (the filter holder), the interference from laser can be thoroughly cleared, and the detection spectrum is shown in Fig. 2(a).
(a) (b)
Figure 2. The detected fluorescent spectrum for (a) rhodamine and (b) chlorophyll. The integrate time is 100 ms and the laser power is 5 mW.
(a)
(b)
Figure 3. The light sheet microscope. (a) The system diagram; (b) Structural sketch diagram. The laser is reflected by a 2D galvo scanner, and focus on the sample by a doublet lens. The depth of field of the lens is larger enough, therefore, a light sheet can be generated at the sample. The imaging plane of objective2 is coinciding with the light sheet, and lens (f = 100 mm) is utilized as tube lens and the CCD can capture the image with high speed and high SNR. The inset in (a) is the imaging result for the 4X objective.
3. THE PERPENDICULAR IMAGING SYSTEM
(a) (b)
(c) (d)
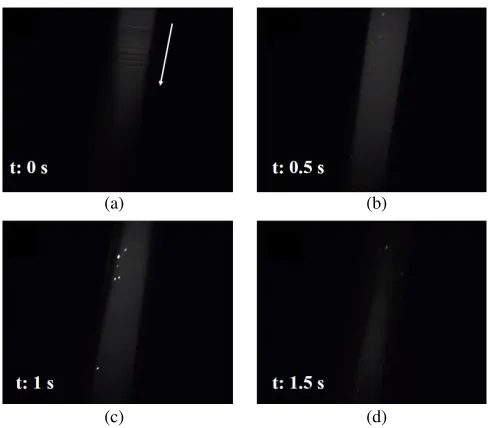
Figure 4. The imaging results for a capillary with a flowing fluorescent solution (rhodamine).
lens is served as a tube lens, to focus the image on the CCD chip. An imaging result of this microscope is shown in the inset of Fig. 3(a).
As discussed before, the perpendicular detection system has a high SNR. When there is no any sample, the CCD captures a black image. This light sheet microscope can record the flow process of fluorescent [9, 10] solution (rhodamine) in capillary, as shown in Fig. 4. The images are captured at 0–1.5 s, with 0.5 second intervals. The image is very clear, and there is no shadow, indicating the rapid imaging ability. The background is almost black, indicating the high SNR.
4. CONCLUSION
In this paper, a compact perpendicular detection and imaging system is built. Based on this system, a high SNR fluorescent detection can be fulfilled. Even when the laser blocking filter is absent, an available spectrum can be derived. This system can be used to measure the fluorescence for chlorophyll in leaf. Furthermore, this compact perpendicular detection system can be improved to a light sheet imaging system. Based on this imaging tool, a rapid imaging result can be acquired for a flowing fluorescent solution in a capillary. On the other hand, the details of the optical and optomechanical elements are introduced in this paper. Readers who are interested in this system can build their own perpendicular detection and imaging module based on the above information.
ACKNOWLEDGMENT
This work is partially supported by the Natural Science Foundation of Hainan Province (617022), Scientific Research Fund of Hainan University (kyqd1653) and Changshu Innovative and Entrepreneurship Fund (CSRC1535).
REFERENCES
1. Keller, P. J., A. D. Schmidt, J. Wittbrodt, and E. H. Stelzer, “Reconstruction of zebrafish early embryonic development by scanned light sheet microscopy,”Science, Vol. 322, No. 5904, 1065–1069, 2008.
J. Lippincott-Schwartz, L. Fritz-Laylin, R. D. Mullins, D. M. Mitchell, J. N. Bembenek, A. C. Reymann, R. Bohme, S. W. Grill, J. T. Wang, G. Seydoux, U. S. Tulu, D. P. Kiehart, and E. Betzig, “Lattice light-sheet microscopy: Imaging molecules to embryos at high spatiotemporal resolution,”Science, Vol. 346, No. 6208, 1257998, 2014.
6. Betzig, E., G. H. Patterson, R. Sougrat, et al., “Imaging intracellular fluorescent proteins at nanometer resolution,”Science, Vol. 313, No. 5793, 1642–1645, 2006.
7. Cai, F., J. Qian, L. Jiang, and S. He, “Multifunctional optical imaging using dye-coated gold nanorods in a turbid medium,” Journal of Biomedical Optics, Vol. 16, No. 1, 016002-016002-8, 2011.
8. Hoge, F. E. and R. N. Swift, “Airborne simultaneous spectroscopic detection of laser-induced water Raman backscatter and fluorescence from chlorophyll a and other naturally occurring pigments,”
Applied Optics, Vol. 20, No. 18, 3197–3205, 1981.
9. Weston, S. A. and C. R. Parish, “New fluorescent dyes for lymphocyte migration studies: Analysis by flow cytometry and fluorescence microscopy,”Journal of Immunological Methods, Vol. 133, No. 1, 87–97, 1990.