Bridge Detection in High-Resolution X-Band SAR Images
by Combined Statistical and Topological Features
Meng Yang* and Zhihua Jian
Abstract—This article takes account of the radiation feature of rivers in high-resolution airborne X-band synthetic aperture radar (SAR) images and proposes a novel automatic approach to detect highway bridges by combining statistical and topology features. The proposed method consists of two steps. In the river-extraction stage, the classification techniques are applied to water extraction according to the statistical and gray-leveled features. In the bridge-extraction stage, bridges are then detected in this binary image by using a topology-based approach. Experiments, undertaken on high-resolution X-band SAR images, confirm that the proposed method can be implemented with high-precision highway-bridge extraction, feature analysis, and bridge recognition.
1. INTRODUCTION
Automatic synthetic aperture radar (SAR) image processing has received increasing attention recently due to the development of the sensor techniques [1, 2]. Automatic detection of bridges from SAR imagery is useful in many important applications such as maintaining geographical databases, assessing the extent of damages in the case of natural disasters such as floods or earthquakes, and in military applications. In particular, the improved resolution of SAR images and the large amounts of SAR data available nowadays promote the development of new automatic bridge detection tools in time.
Many algorithms have been developed for bridge detection in SAR images. In general, the bridge-detection process consists of two major parts: 1) the river-extraction step, and 2) the bridge-extraction step. In [3], fuzzy support vector machine (FSVM) was used to find out water areas, and the bridges were located based on the distance between two river regions through setting some threshold values. [4] proposed an automatic bridge detection in optical remote sensing images. For the proposed method, neural networks were utilized to recognize the bridge. However, the resolution of most SAR images is often not high enough to extract detailed bridge information because of the electromagnetic scattering characteristics of the target objects. Therefore, some difficulty exists in applying to this method. [5] suggested an automatic bridge detection scheme based on double-step constant false alarm rate (CFAR) detector and river extraction method. In [5], bridge candidates were first extracted by using double-step CFAR detector. Then, the river area extracted using the global threshold was used to mask the bridge candidates, which did not exist on the river area. [6] suggested a detection technique based on the characteristics of the bridges in high-resolution SAR images. In [6], water regions were first segmented. Then, the potential bridge regions were segmented by line-fitting algorithm and double parameter CFAR method. Finally, the bridges were detected according to perimeter and the direction of principal axis. The difficulty of CFAR detector is to choose the design parameters to achieve a desired false-alarm rate. These parameters, especially when the taken detectors are not CFAR for the SAR images, are often set empirically. Only the detection problem at hand can give hints about distribution and parameter choices. [7] suggested a bridge detection algorithm in SAR imagery by feature analysis.
Received 8 March 2017, Accepted 26 May 2017, Scheduled 4 June 2017
* Corresponding author: Meng Yang ([email protected]).
For the proposed method, region growing and mathematical morphology were used to extract water areas. The target was identified according to feature extraction of potential bridges and certain rules. [8] proposed a method for bridge detection in airborne multiband high resolution SAR images based on principal component analysis (PCA) fusion. [9] suggested a river channel extraction from SAR images based on combined gray and morphological features. In [9], the background noises were removed by using the gray threshold-based image segmentation method. Morphological models were used to identify and prune the river channel and correct final results. Among these, traditional morphology technologies for bridge detection have their own strengths and weaknesses, which are expected to improve their performance by investigating algebra structure, sequence structure and topological structure of SAR image space.
The aim of this study is to show the benefits of an object-based representation suitable for river/bridge extraction in SAR imagery and based on statistical and topology properties of objects. The main contributions in the proposed method are as follows: 1) the gray and the statistical features of the river channel are jointly used for correctly extracting the river channel; 2) a tunable algorithm to calculate barycentric coordinates by using a topology-based approach is used for correctly detecting the bridges.
2. PROPOSED ALGORITHM
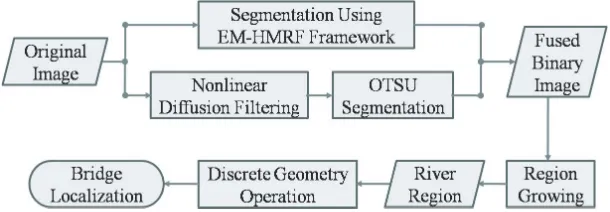
The application of SAR imagery to the detection of bridges is constrained by geometric and radiometric effects caused by variable terrain. This article proposes a novel bridge detection method by combining statistical and topology features. The features are successively input into the multistage operators. The framework for the bridge detection procedure is described in Fig. 1.
Figure 1. Framework of the proposed bridge detection method.
2.1. River Extraction Technique
Strong scatterers of highway-bridge in high-resolution airborne SAR image are mainly from ladders, fences, street lamps, and so on. Meanwhile, scattering from bridge surface is not dominant because of flat and smooth bridge surface. Since reflected wave from water surface is weak, water in SAR image is dark. Therefore, highway bridges in SAR images are strips composed by discrete or continuous strong scatterers across dark water. For this reason, the bridge-detection algorithm can be divided into two basic steps: river-extraction and bridge-extraction. The key to success is effective segmentation of river in SAR images, and the use of that segmentation as available priori information to the next detection of highway-bridge. In this section, we focus on research and application of segmentation methods based on fusion framework, according to the geometrical and gray-leveled features.
For the input SAR image I, we want to infer a configuration of labels Γ, where Γ(x, y) ∈L and
The initial segmentation provides the initial labels Γ for the maximum a posteriori (MAP) algorithm and the initial parameters Θ for the EM algorithm. According to the MAP criterion, we seek the labeling ˜
Γ which satisfies
˜
Γ = arg max
Γ {P
(I|Γ,Θ )P(Γ)} (1)
The prior probabilityP(Γ) is a Gibbs distribution, and the joint likelihood probability is
P(I|Γ,Θ ) =
(x,y)
P(I(x, y)|Γ (x, y), θx,y) (2)
whereP( ˜I(x, y)|Γ(x, y), θx,y) is a Gaussian distribution with parametersθx,y = (μx,y, σx,y). Θ ={θx,y} is the parameter set, which is obtained by the EM algorithm. The EM algorithm includes two steps: E step, Q(Θ|Θ(t)) =E[lnp(I,Γ|Θ)|I,Θ(t)]; M step, Θ(t+1) = arg max
Θ Q
(Θ|Θ(t)) [12]. Here, Θ(t) denotes
the parameter set at thetth iteration. The EM-HMRF algorithm can be briefly described below [12]: Step 1) Start with initialised parameter set Θ(0);
Step 2) Estimate the likelihood distributionp(t)(I|Γ,Θ);
Step 3) Using current parameter set Θ(t) to estimate the labels by MAP estimation Γ(t) = arg max{p(I|Γ,Θ(t))p(Γ)};
Step 4) Estimate the posterior distribution p(t)(Γ|I); Step 5) Update the parameters by usingp(t)(Γ|I).
In airborne high resolution SAR image, water surface is usually flat and smooth, which causes incident wave are reflected and echo to radar is weak. So scattering from water surface is not dominant. For this reason, water in SAR image is dark. Then we adopt gray levels to identify the river sections, and the resulting label configuration will be a refined binary image which is denoted byIb.
The following subsection presents the nonlinear diffusion (NLD) filtering algorithm and OTSU method [13]. The method based on NLD filtering and OTSU are both simple and extensible for segmentation of the input SAR imageI.
Complex ground scenes of various types cause the high non-homogeneity of ground clutter in the SAR images and can reduce the effect of statistical segmentation algorithms. NLD filtering [14] does not shift the locations of scene from beginning to convergence. It weakens strong scatterers of special objects. NLD filtering process makes clutter scatter values diffuse from high value to low value, and effectively filters out most clutter information. Let I(x, y, t) be the grey value at position (x, y), where t is the diffusion time (iteration). The SAR image diffusion filtering is defined by the diffusion equation [15]
⎧ ⎨ ⎩
I(x, y, t) =I(x, y) t= 0
∂
∂tI(x, y, t) =div[D(x, y, t)∇I(x, y, t)] t >0
(3)
where I is the input SAR image, div the divergence operator, D(x, y, t) the diffusion conductance or the diffusivity of the equation, and ∇the gradient operator
∇= ∂ ∂x, ∂ ∂y (4)
In this article, we consider the following diffusivity function
D(x, y, t) =
∇(Gσ∗I)2+λ2 −κ/2 (5)
whereκ∈(1,2),λ >0 is the conductance parameter separating forward from backward diffusion areas in the diffusion process, ∗the convolution operation, and Gσ a Gaussian filter
Gσ(x, y) = 2πσ1 2 exp
|x|2+|y|2
2σ2
(6)
Then, background is removed from the river image by OTSU segmentation method in the filtered imageI(x, y, T). We denote the segmented image byIb (a binary image).
Finally, the results are combined to obtain a fused binary image. Here, we consider the fusion rule
Ib(x, y) = min{Ib(x, y), Ib(x, y)} (7) After candidate water regions are found, we extract each section of the river from segmented images one by one, according to discrete geometry and region-growing methods. For the segmented binary imageIb, we calculate barycentric coordinates (xk0, yk0) (integer coordinates of the largest region with
a path-connected interior) according to equations
ρk =
i∈Ω,k=i
(xk−xi)2+ (yk−yi)2 −1/2
(8)
k0 = arg max
k∈Ω {ρk}
(9)
where each ρk is a measure using the Euclidean metric, k0 an index, and {(xi, yi)|i ∈Ω} are the row
and column indices of the nonzero entries inIb. We adopt the region-growing model for achieving path-connected region according to the initial point (xk0, yk0). The region is iteratively grown by comparing
all unallocated neighboring pixels to the region. The difference between a pixel’s intensity value and the region’s mean value are used as a measure of similarity. The pixel with the smallest difference measured in this manner is allocated to the respective region. This process stops when the intensity difference between region mean and new pixel becomes larger than a certain threshold. Here, the threshold can be set to 0.2 for the binary image Ib.
2.2. Bridge Extraction Technique
After water regions are found, extraction of the highway bridges is the second step within the process of bridge detection. We define a bridge as a narrow concrete structure that connects two water bodies, and the grayscale of a bridge is similar to the land. Based on the statistical and topological features, discrete geometry method can be used to extract bridges. One way to localize region of interest (ROI) is by padding array with mirror reflections of rivers’ edge pixels. A mask image Im can be achieved by using region boundary intersection method.
We define
It(x, y) =I(x, y)Im(x, y) (10)
whereI denotes the original SAR image. Then, the ROIs are located.
3. RESULTS AND DISCUSSION
To test the effectiveness of the approach, we use the real SAR image, taken by a domestic airborne SAR system. The imagery has a resolution of 1m. In this section, a set of meaningful experimental results is shown and discussed.
3.1. Experimental Results
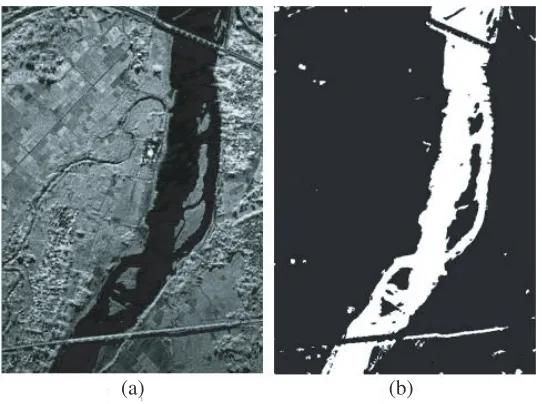
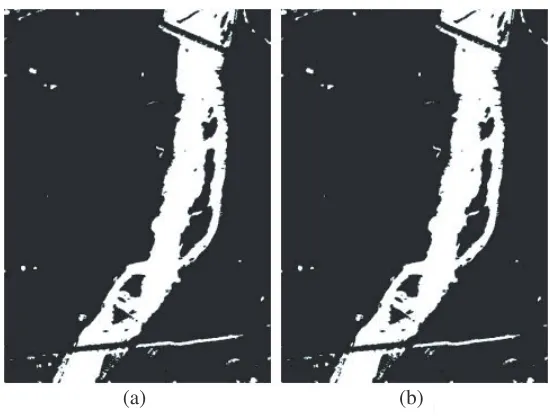
During the experiments, Fig. 2(a), with band X-VV and resolution 1 meter, is used as a test image. For the river-extraction step, the segmented images are produced by using EM-HMRF and NLD-OTSU methods according to the statistical and gray-leveled features.
(a) (b)
Figure 2. (a) Real SAR image with a size of 730×522 pixels. (b) Segmented image based on fusion framework.
shows the segmentation by using NLD-OTSU. Final result (as shown in Fig. 2(b)) shows that the fusion method separates the water class well.
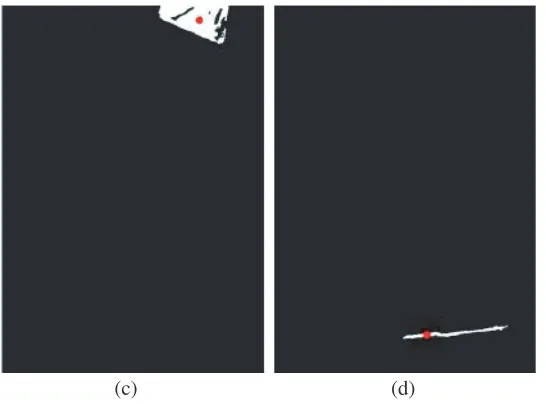
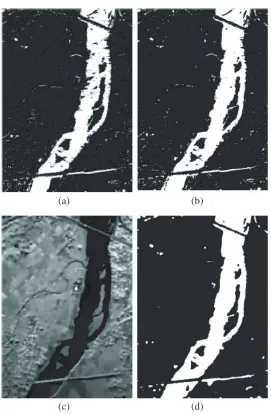
Figures 3(a), 3(b), and 3(c) show its achieved barycentric coordinates and path-connected regions by using discrete-topological method and region-growing method. Here, each section of the river is extracted from segmented binary images one by one, according to topology methods. Moreover, it should be noted that sporadic waters are regarded as false objects in our task.
As shown in Fig. 3(d), a false object has a smaller regional area. It can be enveloped by the minimum exterior rectangular window, and regarded as a false object according to its regional area. We note that [16] suggested techniques to reduce the false-alarm rate that rely on the connectivity constraint of the bridge with road. Moreover, many algorithms have been developed for road extracted in SAR images [17–19]. In the bridge-detection stage, these methods can be used as a part of our approach to identify rivers/bridges.
A bridge divides the river into two parts and is surrounded by water on both sides. To exploit this feature, one way to localize ROI is by padding array with mirror reflections of rivers’ edge pixels.
(c) (d)
Figure 3. Achieved barycentric coordinates and path-connected regions by using discrete-topological method and region-growing method.
(a) (b)
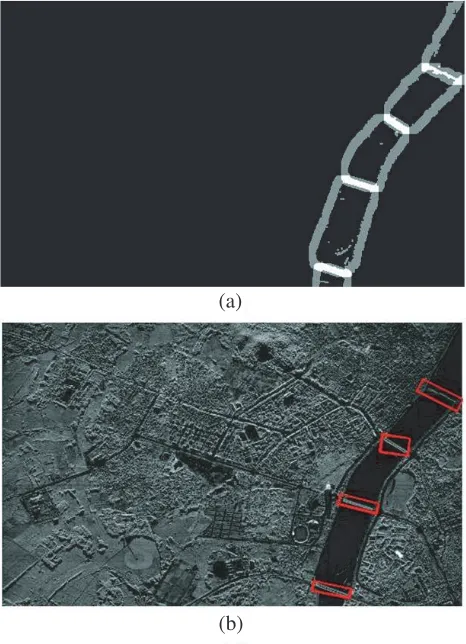
Figure 4. (a) Region boundary intersection for bridge localization, indicated by the white pixels. (b) Detected bridges.
ROI can be extracted by using region boundary intersection method (as shown in Fig. 4(a)). The final output of the bridge-extraction stage is shown in Fig. 4(b).
(a)
(b)
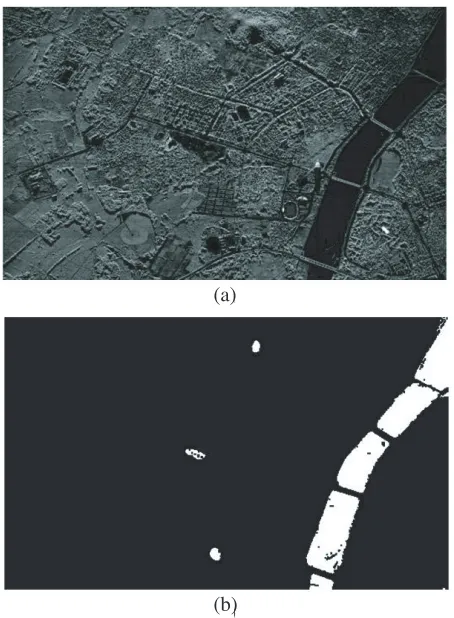
Figure 5. (a) Real SAR image with a size of 328×533 pixels. (b) Segmented image based on fusion framework.
(c) (d)
(e) (f)
Figure 6. Achieved barycentric coordinates and path-connected regions by using discrete-topological method and region-growing method.
(a)
(b)
Figure 7. (a) Region boundary intersection for bridge localization, indicated by the white pixels. (b) Detected bridges.
3.2. Qualitative Discussion
Figure 8. Histogram of the input image data.
(a) (b)
(c) (d)
(a) (b)
Figure 10. Segmented results by using fusion framework. (a) Six-class. (b) Eight-class.
properties of an object and focuses mainly on the unsupervised and accurate extraction of bridges from high-resolution airborne X-band SAR images. The experimental results show that this method can avoid clutter interference in the detection process, and improve the exactness performance of river/bridge extraction in airborne SAR system.
Image segmentation plays an efficient role in bridge detection which discriminates the objects from its background in pixel level. For the river-extraction stage, we model the joint distribution of gray features with a mixture of Gaussians. Fig. 8 displays histogram of image data (Fig. 2(a)). Gray histogram is a statistics measurement of pixel gray value in image. It is apparent that the statistical properties are significantly different due to the differences of radiation characteristics between the water surface and the land surface of its surrounding regions. Actually, it is found by a lot of experiments that the SAR image has usually two peaks character in its histogram. So, the first trough point of histogram can also be selected as the threshold of river segmentation.
Furthermore, we have examined the performance of the compared methods to the segmentation of SAR image, which are shown in Fig. 9. Actually, SAR images are usually degraded by multiplicative speckle noise of varying strength. In MRF feature space, Fig. 9(b) shows that the corruption is more intense as no filtering eliminates part of multiplicative speckle noise because of the limitation of the traditional statistical model. This is why we have preferred to use the fusion features instead of only statistical description. Moreover, because NLD filtering process preserves scene information and filter out most clutter information and OTSU segmentation is approximated to the optimum in the condition that the object figure is larger than 25% of the whole image, we choose them to meet the request.
Moreover, as the number of clusters increases, the segmentation performance is not significantly changed due to the differences of radiation characteristics between the water surface and the land surface of its surrounding regions in high-resolution X-band SAR images. In the segmentation example in Fig. 10, the scene is classified into six and eight different land cover classes by using the proposed algorithm, respectively. It is apparent that the final segmentation provided by the fusion framework, at six-class and eight-class, is not significantly changed.
4. CONCLUSION
patches according to the topology features. It must meet the requirements of accuracy and reliability in the practical application. Experimental results show that the proposed method can be implemented with high-precision bridge extraction, feature analysis, and bridge recognition.
In addition, the approach described here must be applied in the target area according to priori knowledges and is tuned to the highway bridge detection in high-resolution X-band SAR image. Future study will be devoted to improving the accuracy and practicability by integrating more prior information such as existing geographic maps and highway networks, and by improving this model for different types of SAR sensors.
ACKNOWLEDGMENT
This study was supported in part by the National Natural Science Foundation of China (No. 61501152, 61201301).
REFERENCES
1. Isernia, T., A. Massa, A. F. Morabito, and P. Rocca, “On the optimal synthesis of phase-only reconfigurable antenna arrays,” European Conf. Antennas and Propagation, 2074–2077, 2011. 2. Qin, F., S. Gao, Q. Luo, C. Mao, C. Gu, G. Wei, J. Xu, J. Li, C. Wu, K. Zheng, and S. Zheng, “A
simple low-cost shared-aperture dual-band dual-polarized high-gain antenna for synthetic aperture radars,”IEEE Trans. Antennas Propagation, Vol. 64, No. 7, 2914–2922, 2016.
3. Lv, W., W. Yu, J. Wang, and K. Wang, “Automatic bridge detection in SAR images based on fuzzy support vector machine and distance space,”IEEE CIE Int. Conf. Radar, Vol. 2, 1847–1849, 2011.
4. Zhang, J. and G. Sun, “Recognition of bridge over water in remote sensing image using discrete hopfield neural network,”IEEE Int. Conf. Transportation, Mechanical, and Electrical Engineering, 439–442, 2011.
5. Song, W. Y., S. H. Rho, and Y. K. Kwag, “Automatic bridge detection scheme using CFAR detector in SAR images,”Proc. Int. Asia-Pacific Conf. on Synthetic Aperture Radar, 1–4, 2011.
6. Xiong, W., J. Zhong, and L. Cao, “An approach of bridge detection over water in high resolution SAR image,” IET Int. Radar Conf., Vol. 5, 1–4, 2013.
7. Yin, D. and R. Zhang, “Research on the recognition method of bridge target in SAR image,”IEEE Int. Conf. Comput. Inf. Technol., 1403–1406, 2010.
8. Wu, T., Q. Ren, X. Chen, L. Niu, and X. Ruan, “Highway bridge detection based on PCA fusion in airborne multiband high resolution SAR images,” Int. Symposium on Image and Data Fusion, 1–4, 2011.
9. Zhu, H., C. Li, L. Zhang, and J. Shen, “River channel extraction from SAR images by combining gray and morphological features,” Circuits Systems Signal Process., Vol. 34, No. 7, 2271–2286, 2015.
10. Carson, C., S. Belongie, H. Greenspan, and J. Malik, “Blobworld: Image segmentation using expectation-maximization and its application to image querying,” IEEE Trans. Pattern Anal. Mach. Intell., Vol. 24, No. 8, 1026–1038, 2002.
11. Nguyen, T. M. and Q. M. Wu, “Gaussian-mixture-model-based spatial neighborhood relationships for pixel labeling problem,”IEEE Trans. Syst., Man, Cybern. B, Cybern., Vol. 42, No. 1, 193–202, 2012.
12. Kwon, O., “Single image dehazing based on hidden Markov random field and expectation-maximisation,” Electron. Lett., Vol. 50, No. 20, 1442–1444, 2014.
13. Chen, Q., L. Zhao, J. Lu, G. Kuang, N. Wang, and Y. Jiang, “Modified two-dimensional Otsu image segmentation algorithm and fast realisation,” IET Image Process., Vol. 6, No. 4, 426–433, 2012.
15. Yang, M. and G. Zhang, “A novel ship detection method of SAR images based on nonlinear diffusion filtering and Gaussian curvature,”Remote Sens. Lett., Vol. 7, No. 3, 211–219, 2016.
16. Chaudhuri, D. and A. Samal, “An automatic bridge detection technique for multispectral images,”
IEEE Trans. Geosci. Remote Sens., Vol. 46, No. 9, 2720–2727, 2008.
17. Hedman, K., U. Stilla, G. Lisini, and P. Gamba, “Road network extraction in VHR SAR images of urban and suburban area by means of class-aided feature-level fusion,” IEEE Trans. Geosci. Remote Sens., Vol. 48, No. 3, 1294–1296, 2010.
18. He, C., Z. Liao, F. Yang, X. Deng, and M. Liao, “Road extraction from SAR imagery based on multiscale geometric analysis of detector responses,” IEEE J. Sel. Topics Appl. Earth Observ., Vol. 5, No. 5, 1373–1382, 2012.
19. Lu, P., K. Du, W. Yu, R. Wang, Y. Deng, and T. Balz, “A new region growing-based method for road network extraction and its application on different resolution SAR images,” IEEE J. Sel. Topics Appl. Earth Observ., Vol. 7, No. 12, 4772–4783, 2014.