* Correspondence: [email protected] (N.B); [email protected] (C.M); Tel.: +66-099-421-7492
Abstract: Human detection from Unmanned Aerial Vehicles (UAV) is gaining popularity in the field of disaster management, crowd counting, people monitoring. Real time human detection from UAV is a challenging task, because of many constraints involved. This study proposes a system for real time detection of humans on videos captured from UAVs addressing three of these constraints namely, flying height, computation time and scale of viewing. The proposed method integrated an android application with a binary classifier based on Haar-features to automatically detect human / non-human class from UAV images. The video frames were parsed and detected humans from image frames were geo-localized and visualized on Google Earth. The performance was evaluated for geo-localization accuracy, computation time and detection accuracy, considering human coverage – pixel size relationship for various heights and scale factor. Based on flying height - human size relationship and tradeoff between detection accuracy vs computation time, the study came up with optimal parameters for OpenCV’s cv2.cascadeClassifier. detectMultiScale function. This paper establishes a strong ground for further research relating to real time human detection from UAV.
Keywords: Unmanned Aerial Vehicle (UAV), Haar-like features, real time, Geographic Information Systems (GIS), human detection, geolocation error, OpenCV
1. Introduction
In recent years, there has been a rapid increase in the use of Unmanned Aerial Vehicle (UAVs) in various applications including, search and rescue (SAR) operations, disaster management, and many more areas where information about the location of human beings are important. Optical sensors based human detection is one of the important application that can be carried out from the UAV’s platform because of its low price and commercial availability. However, this task is immensely challenging due to variable imaging conditions, distortions in image due to motion of UAVs, small target identification, computationally demanding algorithms implementation, and more [1]. Among many, real time human detection is of primary concern in situations such as disaster-stricken situations, searching lost humans in wilderness or difficult terrain, detecting abnormal human behaviors, studying distribution of people, counting people density in crowd, managing people flow during evacuation and so on. A self-sustained real time human detection system can be particularly useful for these applications, where time is a scare resource and early identification of trapped people and knowledge about their distribution is of primary importance.
This paper presents the process of system development for real time human detection from UAV and visualization on a GIS platform. Unlike previous methods where custom-built UAV were used [2–4] in the detection of human from aerial platform, the technique presented here utilizes commercial UAV namely DJI Matrice 100 to accomplish this task. The mobile Software Development Kit (SDK) provided by the manufacturer is used in the development of android application specific to the need. The benefits of using such commercial products and platforms are ease of availability and stability in terms of both hardware and software side. This work is extended from the proposed
work in [5] where a real time system for human detection and localization from UAV was proposed using optical and thermal Sensor. However, here we present human detection using optical sensor only at different flying heights.
Further, the performance of the developed system was assessed through three different experimental setups for (1) Geolocation error calculation, (2) estimating human size and pixel size relation for various heights and (3) optimizing parameters for cv2.CascadeClassifier.detectMultiScale function and accuracy assessment for different heights. Based on the flying height, the detection accuracy and size of the pixel covering the human will vary. This study therefore considers human size as a function of flying height and tries to establish a relationship among them. Finally, the study proposes optimal parameters for OpenCV’s cv2.cascadeClassifier.detectMultiScale function. The main issue addressed is the tradeoff based on detection tolerance and computation cost.
2. Related Work
In the field of computer vision, human detection through images and videos is not new. There are various methods available to accomplish the task. One of them is by frame differencing where the algorithm performs calculations to check the difference in pixel intensity between consecutive frames. If the difference is substantial it can be said that there is something in the image [6]. The method of Mikolajczyk, Schmid, & Zisserman relies on identifying humans based on parts. The model of the human is defined as assemblies of parts which are then separately detected [7]. Dalal & Triggs used Histogram of Oriented Gradients (HOG) feature descriptors along with linear SVM model to detect humans in the image. They have tried their method on the pedestrian database [8,9]. Zhu, Avidan, Yeh, & Cheng modified the Dalal &Triggs method using cascade-of-rejectors with variable size blocks of HOGs for more robust detection [10].
Viola & Jones used Haar-like feature descriptors and machine learning boosting technique called AdaBoost to train the classifiers for rapid detection rate. Their work was primarily concerned with face recognition. Use of Haar-like features is most commonly used method for feature extraction in case of object detection. Haar-like features takes neighboring rectangular regions at specific location in a detection window then adds up the pixels values in these regions and find the differences between sums [11]. This paper adopts the method of Viola & Jones because this algorithm could be implemented in real time.
Human detection from the aerial platform is also gaining popularity. Both optical and thermal sensors are used in the detection process [1] [12–15]. Rudol & Doherty have utilized the UAV platform to detect human beings using thermal and optical sensor. They used thermal camera to limit the search space and then using optical camera to detect humans. Furthermore, they have geo-localized human in the image using GPS mounted on the UAV [15]. The problem with their method is the use of expensive helicopter that can carry heavy pay load and high quality infrared camera. In addition to that, their method also requires mounting of two cameras at the same time on the UAV. They have demonstrated that human detected from UAV platform could be geo-localized using telemetry data from the GPS onboard. Further, a real-time object tracking system from drones is proposed in [16]. They proposed a lightweight object detection algorithm on a drone for feature extraction under outdoor environment and k-nearest neighbor to match image descriptors. The main contribution of this research was an object tracking method that fused object detection results, Euclidian space equations, inertial measures and GPS to calculate the relative position between coordinate systems of the drones and object.
adapting threshold to be applied to the UAV system. However, as they also mentioned, they assumed the scales of camera and world coordinates to be similar which can increase the target errors. Further, there is a lack of literature in exploring different flying heights and establishing parameters based on different flying heights.
3. Methods
The study proposes a system that can detect humans from UAV video in real time using onboard telemetry data, and visualize the results in a GIS platform. Furthermore, the study tried to assess the accuracy of human geolocation calculated from images and compared the performance of human detection algorithm for images taken from various heights.
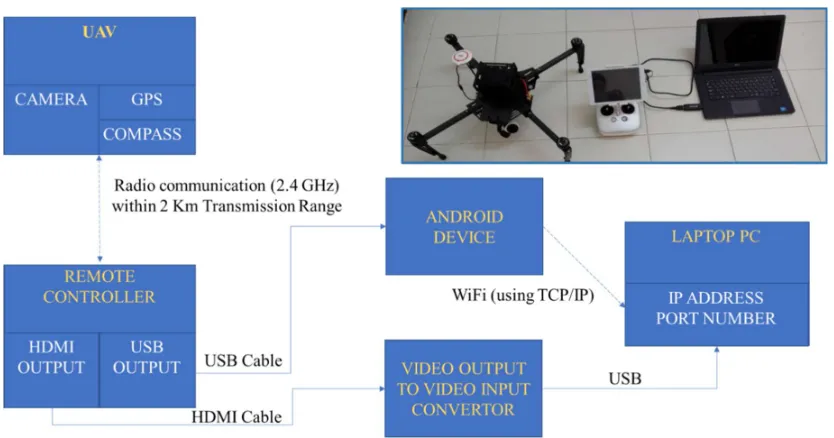
The hardware that were used in the study includes UAV (Matrice100, supplementary 1) and remote controller, android device, computer (Intel® Core™ i5-6200U Processor,64-bit Operating System with 8 Gb installed RAM), USB cable, mini HDMI cable and HDMI output to input convertor (1280 x 720 px @60fps). The UAV can be fully programmed by using DJI’s Software Development Kit (SDK). Its lightweight frame allows greater flexibility for additional payload in terms of other sensors. The X3 camera onboard UAV has a focal length of 20 mm, F value 2.8 and field of view 94 degrees. The GPS onboard has hovering accuracy as per the specification of 0.5 m vertical (barometer + satellites) and horizontal accuracy of 2.5 m (satellites). OpenCV functions were used for training and detection of human. OpenCV functions are flexible which is quite fast since the library is written in C/ C++. It uses a low RAM (approximately 60-79 MB) and interoperable in many devices that can run C.
3.1. UAV telemetry data reception and transmission
Firstly, an android application capable of transmitting and receiving UAV telemetry data was developed using DJI mobile Software Development Kit (SDK). The transmission of data from android device and reception of the data on the laptop PC was achieved using Sockets (IP address and Port Number). Specifically, latitude, longitude, height of drone, compass heading was combined as a single stream of string data. For example, “14.079648 100.609598 40.1 10.7” represented latitude: 14.079648, longitude: 100.609598, altitude from ground: 40.1 and compass heading: 10.7 respectively. The IP address of the computer and port number from which to send the data were assigned in the android application. The PC server received the data via same port number. Then the information from the string of data were stored in appropriate variables. This data streamed continuously as the UAV changed location, height and orientation.
Figure 1. Schematic diagram of fully connected system.
3.2. Training and Creation of Human Detection Classifier
3.2.1. Procedural Details
The own boosted cascade of weak classifier was trained using OpenCV tools [21,22]. The original algorithm was based on [11] which consist of two stages: training and detection. The objective of training is to come up with a set of features that is descriptive of the object of interest. Furthermore, to find some threshold value that accepts or rejects the features that describes the object.
The algorithm shrinks the image into 24x24 pixels. Then it looks for different Haar-like features for which many positives and negatives are supplied to the learning algorithm. The algorithms picks up the important features for the object to detect. In most cases, the number of features and their variations in a 24x24 pixels image is more that 180,000+. To solve this issue, the algorithm uses Adaptive Boosting (AdaBoost) technique, where a strong classifier is created from a set of weak classifiers multiplied by weights as shown in Equation 1. The performance of the classifier is augmented (error rate on training set is minimized) as more number of good features are added after every training stage. This step significantly reduces the number of features to be used i.e. approximately from 180,000 to couple of thousand with acceptable accuracy.
𝐹(𝑥) = 𝑎 ∗ 𝑓 (𝑥) + 𝑎 ∗ 𝑓 (𝑥) + 𝑎 ∗ 𝑓 (𝑥) + ⋯ (1)
Where, F(x) = Final Strong Classifier, ai = weight of ith feature, fi(x)= ith Haar-like feature (weak classifier).
To speed up the processing further, the algorithm utilizes idea of cascading, where the sub-window is instantly rejected in that stage if the first most likely features are not found.
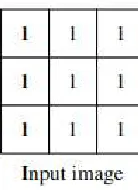
In the detection stage, the image is turned into gray scale. A sub window (detector) of fixed size capable of detecting object is scanned all over the image several times. The detector is made up of scalable Haar-like features. Next, the likelihood of detection is calculated for each window based on which, the detector classifies each sub-window as an ‘object’ or ‘not object’. Here, to reduce the computational cost, the concept of integral image is used here. The integral image is obtained by summing the value of pixel of an original image to the left and above. The value of intensity of an integral image at location (x, y) is given by Equation 2, where i (x’, y’) is the intensity at location (x’, y’) of the original image. An example is shown in Figure 2.
i (x, y) = 𝑖 (𝑥′, 𝑦′)
,
Figure 2: Integral image creation from input image.
3.2.2. Implementation
The main steps of training and creation of human detection classifier are: 1. Preparation of training dataset
2. Annotating and labeling of dataset 3. Training of Cascade
In this work, the standard dataset (images) like MIT pedestrian dataset and INRIA dataset for positive human images could not be utilized, because all the standard datasets are from the ground perspective whereas this work demanded images from aerial perspective. Therefore, experiments were done to collect human images from various heights. Again, the next question to pose is the right number of images. According to the OpenCV documentation [21], the number of negatives must be approximately twice the number of positives and the number must be in the range of thousand. For the training of classifier 1500 experimentally collected positive images were used, and for negative data, 3000 randomly chosen non-person images were taken from INRIA dataset [9]. Figure 3 shows sample of images used in the training process. It is worth mentioning that, the first step of the algorithm, both in training and detection is that they covert RGB image to grayscale. In training process, features are learnt from grayscale image and also in case of detection, features are searched in grayscale image only. The color of parent image is added afterwards, giving an illusion of algorithm working with RGB images/videos. Next, a binary classifier in the form of XML file was generated. This classifier was used in the detection algorithm. The classifier gave results as human or non-humans as a list of rectangles. The overlapping rectangles are removed using Non-Maximum Suppression (NMS) [23]. Each rectangle represented a possible human. The centroid of rectangle was taken as the actual location of the individual in terms of pixel coordinates. These pixel coordinates were transformed to the world coordinates based on the UAV telemetry data that was being received for each image frame.
3.3. Coordinates Calculation
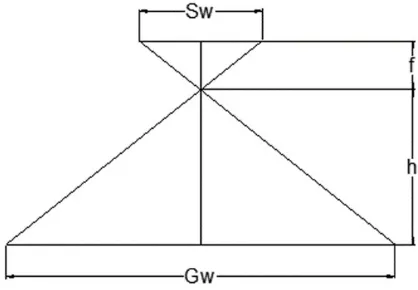
This section describes the procedure to determine the equations for calculating the detected human coordinates in world units. The world coordinates are defined in Universal Transverse Mercator (UTM) zone 47N, on a datum of WGS 1984. The method presented here considered only vertically downward looking image view. Figure 4 shows vertically down looking camera from the UAV. From geometry of similar triangles, equations 3, 4, 5 [24] were derived.
Figure 4. Vertically downward looking camera from the UAV platform. Sw: sensor width of camera, f: real focal length of camera, h: height of flying of UAV, Gw: ground coverage, GSD: ground sampling distance, N: image width in pixels
Gw =Sw ∗ h
f . 3)
N ∗ GSD =Sw ∗ h
f (4)
GSD =Sw ∗ h
f ∗ N (5)
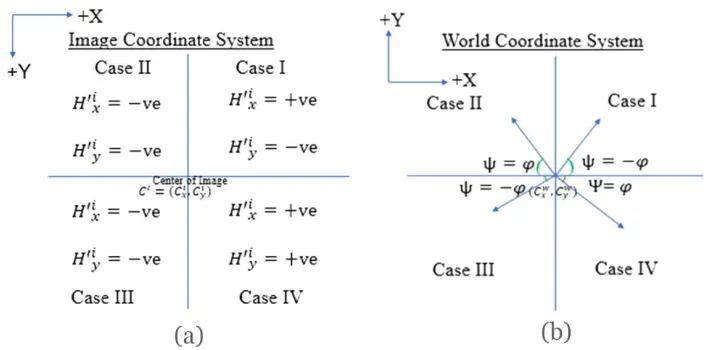
Figure 5 (a) exemplifies a vertical image with its properties where ∅= Angle True North makes
with the vertical. Origin of the image is at top left corner. Positive X axis is defined rightwards, and positive Y axis is defined downwards for image. Center of image in image coordinate frame is
𝐶 = (𝐶 , 𝐶 )= (image width / 2, image height / 2), center of image in world coordinate frame is given
by, 𝐶 = (𝐶 , 𝐶 ). The coordinates Cw was estimated from the GPS installed on the UAV directly.
The GPS receiver and the camera are aligned to the UAV coordinates mechanically, therefore any offset if exists can be neglected. The detected Human Coordinates are H = (𝐻 , 𝐻 ). The vector from
center of Image to Human location (Equation 6) and length of vector in world units (Equation 7) are as follows.
𝐶𝐻⃗ = (𝐻 − 𝐶 )𝚤̂ + 𝐻 − 𝐶 𝚥̂ (6)
Figure 5. (a) Vertical image with center pixels, width, height, and detected human location (b) Image rotated such that the true north is aligned to the top.
Now, the image is rotated by angle ∅ such that North is aligned at top i.e. same as world
coordinate system (figure 5 (b)). Anti-clock wise rotation is considered positive. In this case, the New Human Coordinates H’ = (𝐻′ , 𝐻 ).
𝐶𝐻′⃗ = Rotated Vector (8)
cos ∅ sin ∅
− sin ∅ cos ∅
𝐻 − 𝐶
𝐻 − 𝐶 =
𝐻′
𝐻 (9)
There will be four cases depending on the sign of 𝐻′ and 𝐻 . Based on where the rotated
vector will land in the 4 quadrants. Figure 6(a) shows the four cases. Now in case of world coordinate system Y is positive upwards and X axis is positive rightwards. To make angle of vector acute and positive, a new angle 𝜓 (Equation (10)) was introduced. Figure 6(b) shows the world coordinate
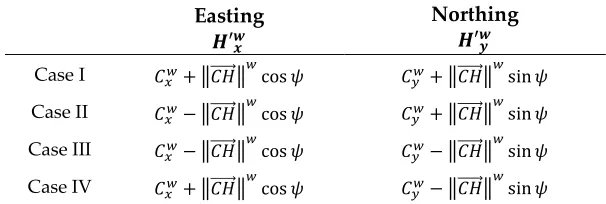
system. Finally, the detected human coordinates in the world coordinate systems is shown in Table 1.
𝜓 = −𝜑, 𝑥 < 0
𝜑, 𝑥 ≥ 0 (10)
Table 1. Equations for Calculating Human Coordinates in World Units
Easting
𝑯′𝒙𝒘
Northing
𝑯′𝒚𝒘
Case I 𝐶 + 𝐶𝐻⃗ cos 𝜓 𝐶 + 𝐶𝐻⃗ sin 𝜓
Case II 𝐶 − 𝐶𝐻⃗ cos 𝜓 𝐶 + 𝐶𝐻⃗ sin 𝜓
Case III 𝐶 − 𝐶𝐻⃗ cos 𝜓 𝐶 − 𝐶𝐻⃗ sin 𝜓
Figure 6. (a) Four cases where the rotated vector could land (b) Four cases for detected humans in world coordinates system.
3.4. Dynamic Geospatial Visualization
Finally, after the world coordinates of the human locations were determined, they were visualized on GIS platform, namely Google Earth. For that, a network link was created on computer which was linked with a KML file. The same KML file got updated programmatically based on the detection of humans on each image frame. In this way a dynamic geo-spatial visualization of humans was accomplished. This network link updated every four second resulting in a dynamic real time visualization of humans on Google Earth along with their detection.
3.5. Experimental setups for performance evaluation
In order to assess the performance of developed system 3 different experimental setups were designed.
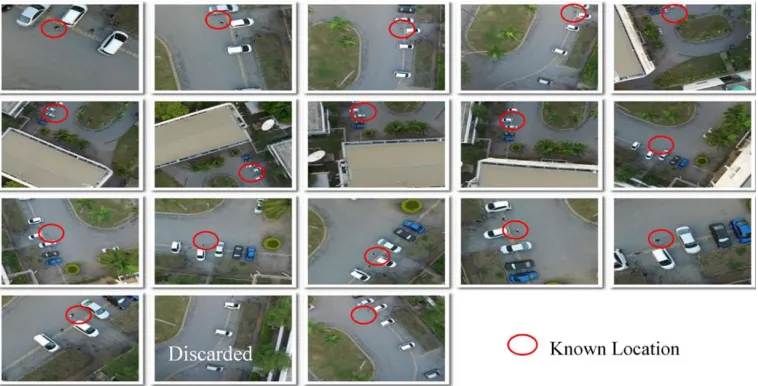
First, human stood on known location i.e. points established with higher order accuracy. Then 16 at nadir images were taken from the various height and ranges. Then detected human coordinates were calculated from each photograph and compared with actual known coordinates. These known coordinates were established using high grade survey instrument like Total Station by Geoinformatics Center (GIC), Asian Institute of Technology. The accuracy was within 1 cm. Figure 7 shows the experimental setup for the geolocation calculation. A total of 17 images were collected for the experiment, one was discarded as it was out of the frame extent.
Second, UAV took a standard 1280 x 720 pixels Grayscale image for a standing human at 8 different heights. For each height, average numbers of pixels to cover a fully upright standing human were counted. Figure 8 illustrates the pictures that were used. After that a regression equation was used to model the flying height and pixel size relationship. The confidence interval for the mean of predicted y | x is given by the Equation 11, where, Yi is the predicted value for the ith data point by
the regression equation. The t((n-2)) is t-value for 95 % confidence interval for n-2 degree of freedom, √(〖MS〗 error ) is the standard error and 〖SS〗 error is sum of squared error. Xi and X are the ith and
mean of data values. The values obtained were utilized in fine tuning of the function parameters that was used in the detection algorithm.
CI = Y ± t( ) MS 1
n+ X − X
Figure 7. Experimental setup for the calculation of geolocation error.
Third, the parameters of OpenCV’s cv2.CascadeClassifier.detectMultiScale parameters were evaluated. (image[,scaleFactor[, minNeighbors[, minSize[, maxSize]]]]]) was evaluated. This function notated as cv2.CascadeClassifier.detectMultiScale(image[, scaleFactor[, minNeighbors[, minSize[, maxSize]]]]]) (OpenCV, 2014) detects object of different size in the given image and outputs the detected object as rectangles list. Here,
image – image from which objects are to be detected.
scaleFactor – how much the image size is reduced at each stage of processing.
minNeighbors – specifies the number of neighboring rectangles to have for the candidate rectangle to retain itself.
minSize – minimum size of the detected object. Object with values smaller than this are ignored.
maxSize – maximum size of the detected object. Object with values larger than this are ignored.
For each test images from various height 10m 20m, 40m, 50m (Figure 9), precision, recall, F1-score and average computation time for single run of the classifier was calculated for varying scale factor. Average computation time was normalized between 0 and 1 to compare with the F1 score. Absolute difference between normalized computation time and F1 score was taken as the performance score (Equation 12-15).
Precision = 𝑇𝑃
TP + FP (12)
Recall = TP
TP + FN (13)
F =2 ∗ Precision ∗ Recall
Precision + Recall (14)
Performace score = ‖𝑛𝑐𝑡 − 𝐹 ‖ (15)
Where, TP= True Positive, FP = False Positive, FN = False Negative and nct = normalized computation time.
Figure 10. Final user interface with real time detection and visualization on Google Earth.
The geolocation error for the above results were computed from the image coordinates based on the telemetry data of UAV. The method and symbols of obtaining the results are explained in Section 3.3. Table 2 shows the coordinates calculated for human standing on a known location when the UAV was flown at 50 m height. The calculated coordinates were compared with the actual coordinates and the differences are plotted in figure 11. From this plot of geolocation error, it is evident that the buffer of 4.15 m was able to encapsulate all the calculated coordinates. To account for the unforeseen error, this value can be rounded to 4.5 m. Probable loss in accuracy is attributed to assumptions made during the study (flat ground assumption, camera limitations, satellites signal received, wind, and other factors that were not considered in the study). Nevertheless, the geolocation accuracy was 4.5 m which is standalone and the GPS accuracy can be attributed to the specific GPS used for the study.. In other words, for UAV flying within 50 m height, the system is sufficient for assessing human position within 4.5 m radius.
Table 2. Coordinates Calculation of Human Standing on Known Location.
Given Calculated
Diff X Diff Y 𝑪𝒙𝒘(m) 𝑪𝒚𝒘(m) h (m) ∅ (degrees) 𝑯𝒙𝒊(px) 𝑯𝒚𝒊 (px) 𝑯′𝒙𝒘(m) 𝑯′𝒚𝒘(m)
674225.5 1557192 22.4 0.6 1569 1612 674221.4 1557191 0.47 -0.15 674224.3 1557192 19.5 -58.5 1934 1904 674221.1 1557191 0.17 -0.15 674224.1 1557192 16.3 70.2 1728 1161 674221.2 1557191 0.27 -0.15 674224 1557189 13.2 -26.1 1452 1476 674221.3 1557191 0.37 -0.15
674211.7 1557195 25.5 -130.2 1835 571 674220.6 1557190 -0.33 -1.15 Actual Co-ordinates = 674220.93 m, 1557191.15 m
Figure 11. Geolocation error calculation.
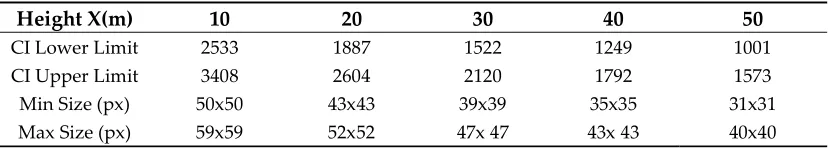
Figure 12 depicts the scatterplot of average pixel size covering human at different flying height. Here, the pixel size correspond to a fully upright standing human on an vertical image of fixed size, in this case it was 1280 x 720. A logarithmic trend line fitted the best with this data and hence a logarithmic regression equation was computed. This equation was used to predict the value of standing human from different height. Table 3 shows the confidence interval values for heights 10, 20, 30, 40, 50 m using the equations described in section 3.4. For n = 8, X = 10, 20, 30, 40, 50 m 95% confidence interval value was obtained which was used as minimum and maximum size of the human for that height. These results were used to fine tune the human detection parameters in OpenCV object detection algorithm in the next phase. This result is highly dependent on the size of the image used. As the real time processing was done for 1280 x 720 frame, the human sizes were obtained in pixels for the image of the same size.
Table 3. Minimum and Maximum Human Size in Pixels for Various Heights.
Height X(m) 10 20 30 40 50
Figure 12. Scatter plot of between flying height of UAV and average pixel size of human.
To analyze performance of function cv2.CascadeClassifier.detectMultiScale, all parameters described in section 3.4 were explored. This function can take a huge range of values. For real time application, the key concern is the processing time with respect to the detection accuracy which must be within acceptable limits. Therefore, it is important to explore the trade-off between the processing time and accuracy and find the optimal parameters. From the results explained in table 3, the ranges for parameters minSize and mazSize are set with the assumption that for a given height humans cannot be larger than certain pixels and cannot be smaller than certain pixels. minNeighbors did not significantly affect the processing time but it affected the accuracy of detection. Higher minNeighbors meant many false negatives and smaller minNeighbors meant many false positives.
Figure 13. Scale factor and processing time is inversely related.
Figure 14. Tradeoff between scale factor, detection accuracy and computation time.
This study sought to find the tradeoff between computation time, scaleFactor and accuracy of detection. Figure 15 shows sample performance calculation of a 40 m high image. Here TP = 23, FP = 3, FN = 2, Precision = 0.88, Recall = 0.92, Scale Factor = 1.10, computation time = 0.14 secs, normalized computation time (nct) = 0.11, F1 score = 0.90 and Performance Score = 0.79. With similar logic and reasoning, the performance score of 10m, 20m, 40m, 50m high images were calculated for all changing scale factor and size parameters. The results are illustrated on Figure 16. Here, the F1 score is the representation of detection accuracy whereas processing time is the representation of cost of processing. For optimum solution, the desired combination will be a higher F1 score and smaller processing time. Thus, the value with the highest performance score can be considered as optimum for the particular parameter at particular height. For example, at 10 m of flying height, scale factor of 1.2 and 1.5 gives the highest performance score. Here we choose the scale factor of 1.2 as optimum as higher scale factor also indicates high detection accuracy as discussed earlier. For flying heights of 20, 30 and 50 m, the optimum scale factors are 1.2, 1.1 and 1.1 respectively.
0.75
0.15
0.11
0.06
0.05
0.05
0
0.1
0.2
0.3
0.4
0.5
0.6
0.7
0.8
0
1
2
3
4
5
6
P
ro
ce
ss
in
g
T
im
e
(s
ec
s)
Scale Factor
Figure 15. Test results for scale factor 1.10, minSize = (35 x 35), maxSize = (43 x43) for 40 m high image.
Figure 16. Chart showing tradeoff between scale factor and accuracy for 10 m, 20m, 40m, 50 m high images.
5. Conclusion and Future Work
Real time human detection from the optical images/ video taken from UAV is a demanding task. Among many factors, flying height of UAV, computation time for algorithm implementation, scale of viewing and accuracy of detection were considered important for this study. The main aim of this study was to develop a system that can detect humans from UAV video in real time using onboard telemetry data, and to visualize the results in a GIS platform. Furthermore, the study tried to assess the accuracy of human geolocation calculated from images and compared the performance of human detection algorithm for images taken from various heights.
geo-localization and visualization. A custom binary classifier based on Haar-like features was trained using experimentally collected images for human/not human class. Then a program capable of parsing image frame and implementing human detection algorithm was written. The method could detect humans and geo-localize them to world coordinates. After that, visualization was done on Google Earth.
Second, the study addressed issues relating to geolocation error of detected humans and accuracy of detection. This geolocation error is highly dependent on the flying height and the accuracy of onboard GPS. For our case, for flying height below 50 m the accuracy of geolocation calculated was found to be approximately 4.5 m. Further, an inverse relationship was found between flying height and pixel size covering human. Again, this relationship is strictly affected by the size of the image. This study utilized 1280 x 720 image.
For real time application, computation time is of chief concern and detection must be within acceptable limits. Therefore, tradeoff between computation time and accuracy of the detection was explored furthermore. With experimentation, the study came up with optimal parameters for OpenCV’s cv2.cascadeClassifier.detectMultiScale function. Among many parameters that this function takes in, scaleFactor was found to be dominant on the processing speed. Also, scale factor in conjunction with size parameters gave optimal tradeoff between computation time and detection accuracy. It was found that, the computation time significantly reduced from 0.75 seconds to 0.06 seconds when scaleFactor changed from 1.01 to 3 for 1280 x 720 px image. However, from scaleFactor 3 and greater there was no substantial decrease in the computation time.
Due to resource and time constraints scope the study was limited to a certain extent. For example, use of thermal camera with optical camera, oblique viewing, other human detection algorithms, effect of occlusions, could not be investigated in this research. Also, camera calibration should be carried out to estimate the intrinsic camera matrix to handle the distortions, which is generally present in all consumer grade cameras. This leaves room for the future improvement. Nevertheless, this study established that commercial UAV could be used in real time human detection and visualization. These kind of study holds significance in saving lives of human during disasters, monitoring people movements, automatic counting of people, and many more.
Author Contributions: Conceptualization, N.B., T.N. and C.M.; Methodology, N.B. and T.N.; Software, N.B.; Validation, N.B., T.N. and C.M.; Formal Analysis, N.B.; Investigation, N.B.; Resources, T.N. and C.M.; Data Curation, N.B.; Writing-Original Draft Preparation, N.B.; Writing-Review & Editing, N.B. and C.M.; Visualization, N.B.; Supervision, T.N. and C.M.; Project Administration, N.B..”.
Funding: This research received no external funding.
Acknowledgments: Authors would like to extend their gratitude towards Dr. Shiro Ochi and Dr. Hiroyuki Miyazaki for their valuable suggestions and feedbacks regarding the research.
Conflicts of Interest: The authors declare no conflict of interest.
References
1. Gaszczak, A.; Breckon, T. P.; Han, J. Real-time people and vehicle detection from UAV imagery. In
Proceeding of SPIE: Intelligent Robots and Computer Vision XXVIII: Algorithms and Techniques; San Francisco, California, 2011; p. 78780B–1–13.
2. Blondel, P.; Potelle, A.; Pegard, C.; Lozano, R. Human detection in uncluttered environments: From ground to UAV view. In 13th International Conference on Control Automation Robotics and Vision, ICARCV 2014; Singapore, Singapore, 2014; pp. 76–81.
3. Sun, J.; Li, B.; Jiang, Y.; Wen, C. Y. A camera-based target detection and positioning UAV system for search and rescue (SAR) purposes. Sensors (Switzerland)2016, 16, doi:10.3390/s16111778.
part detectors. In Computer Vision - ECCV 2004.; Pajdla, T., Matas, J., Eds.; Springer: Berlin, Heidelberg, 2004 ISBN 978-3-540-24670-1.
8. Dalal, N.; Triggs, W. Histograms of Oriented Gradients for Human Detection. In 2005 IEEE Computer Society Conference on Computer Vision and Pattern Recognition CVPR05; IEEE, 2004; Vol. 1, pp. 886–893. 9. Dalal, N.; Triggs, B. INRIA person dataset Available online: http://pascal.inrialpes.fr/data/human/
(accessed on Aug 6, 2018).
10. Zhu, Q.; Avidan, S.; Yeh, M.-C.; Cheng, K.-T. Fast Human Detection Using a Cascade of Histograms of Oriented Gradients. In IEEE Computer Society Conference on Computer Vision and Pattern Recognition (CVPR’06); IEEE: New York, USA, 2006; pp. 1491–1498.
11. Viola, P.; Jones, M. Rapid object detection using a boosted cascade of simple features. In Proceedings of the 2001 IEEE Computer Society Conference on Computer Vision and Pattern Recognition. CVPR 2001; IEEE: Kauai, HI, USA, 2001; Vol. 1, pp. 511–518.
12. Rivera, A. J. A.; Villalobos, A. D. C.; Monje, J. C. N.; Mariñas, J. A. G.; Oppus, C. M. Post-disaster rescue facility: Human detection and geolocation using aerial drones. In IEEE Region 10 Annual International Conference, Proceedings/TENCON; IEEE: Marina Bay Sands, Singapore, 2017; pp. 384–386.
13. Goodrich, M. A.; Cooper, J. L.; Adams, J. A.; Humphrey, C.; Zeeman, R.; Buss, B. G. Using a mini-UAV to support wilderness search and rescue: Practices for human-robot teaming. In SSRR2007 - IEEE International Workshop on Safety, Security and Rescue Robotics Proceedings; IEEE: Rome, Italy, 2007. 14. Reilly, V.; Solmaz, B.; Shah, M. Shadow casting out of plane (SCOOP) candidates for human and vehicle
detection in aerial imagery. Int. J. Comput. Vis.2013, 101, 350–366, doi:10.1007/s11263-012-0580-1. 15. Rudol, P.; Doherty, P. Human body detection and geolocalization for UAV search and rescue missions
using color and thermal imagery. In IEEE Aerospace Conference Proceedings; IEEE: Big Sky, MT, 2008; pp. 1–8.
16. Chen, P.; Dang, Y.; Liang, R.; Zhu, W.; He, X. Real-Time Object Tracking on a Drone with Multi-Inertial Sensing Data. IEEE Trans. Intell. Transp. Syst.2018, 19, 131–139, doi:10.1109/TITS.2017.2750091.
17. Xu, Y.; Yu, G.; Wang, Y.; Wu, X.; Ma, Y. Car detection from low-altitude UAV imagery with the faster R-CNN. J. Adv. Transp.2017, 2017, doi:10.1155/2017/2823617.
18. Liu, T.; Fu, H. Y.; Wen, Q.; Zhang, D. K.; Li, L. F. Extended faster R-CNN for long distance human detection: Finding pedestrians in UAV images. 2018 IEEE Int. Conf. Consum. Electron. ICCE 20182018,
2018–January, 6–7, doi:10.1109/ICCE.2018.8326306.
19. Bondi, E.; Fang, F.; Hamilton, M.; Kar, D.; Dmello, D.; Choi, J.; Hannaford, R.; Iyer, A.; Joppa, L.; Tambe, M.; Nevatia, R. SPOT Poachers in Action: Augmenting Conservation Drones With Automatic Detection in Near Real Time. Thirtieth AAAI Conf. Innov. Appl. Artif. Intell.2018, 7741–7746.
21. OpenCV Cascade classification Available online: https://docs.opencv.org/2.4/modules/objdetect/doc/cascade_classification.html (accessed on Aug 6, 2018).
22. Puttemans, S. Cascade classifier training Available online: https://docs.opencv.org/3.3.0/dc/d88/tutorial_traincascade.html (accessed on Aug 6, 2018).
23. Adrian, R. (Faster) Non-Maximum Suppression in Python Available online: https://www.pyimagesearch.com/2015/02/16/faster-non-maximum-suppression-python/ (accessed on Aug 6, 2018).