An Efficient EM-algorithm for Big data in
Wireless Sensor Network using Mobile Sink
1
Kunal G. S, 2Manasa 1
PG Student, Department of Computer Science, Alva’s College, Moodbidri, Karnataka, India 2
Assistant Professor, PG Department of Computer Science, Alva’s College, Moodbidri, Karnataka, India
Abstract-Recently, the big data emerged as a hot topic because of the tremendous growth of the information and communication technology. One of the highly anticipated key contributors of the big data in the future networks is the distributed wireless sensor networks (WSNs). Although the data generated by an individual sensor may not appear to be significant, the overall data generated across numerous sensors in the densely distributed WSNs can produce a significant portion of the big data. Energy-efficient big data gathering in the densely distributed sensor networks is, therefore, a challenging research area. One of the most effective solutions to address this challenge is to utilize the sink node's mobility to facilitate the data gathering. While this technique can reduce energy consumption of the sensor nodes, the use of mobile sink presents additional challenges such as determining the sink node's trajectory and cluster formation prior to data collection. In this paper, we propose a new mobile sink routing and data gathering method through network clustering based on modified expectation-maximization technique. In addition, we derive an optimal number of clusters to minimize the energy consumption. The effectiveness of our proposal is verified through numerical results.
I. INTRODUCTION
Gathering the large volume and wide variety of the sensed data is, indeed, critical as a number of important domains of human Endeavour are becoming increasingly reliant on these remotely sensed information. For example, in smart-houses with densely deployed sensors, users can access temperature, humidity, health information, electricity consumption, and so forth by using smart sensing devices. In order to gather these data, the Wireless Sensor Networks (WSNs) are constructed whereby the sensors relay their data to the ``sink''. However, in case of widely and densely distributed WSNs (e.g. in schools, urban areas, mountains, and so forth) there are two problems in gathering the data sensed by millions of sensors. First, the network is divided to some sub-networks because of the limited wireless communication range. For example, sensors deployed in a building may not be able to communicate with the sensors which are distributed in the neighboring buildings. Therefore, limited communication range may pose a challenge for data collection from all sensor nodes. Second, the wireless transmission consumes the energy of the sensors. Even though the volume of data generated by an individual sensor is not significant, each sensor requires a lot of energy to relay the data generated by surrounding sensors. Especially in dense WSNs, the life time of sensors will be very short because each sensor node relays a lot of data generated by tremendous number of
surrounding sensors. In order to solve these problems, we need an energy- efficient method to gather huge volume of data from a large number of sensors in the densely distributed WSNs.
II. RELATED WORK
By considering many research papers survey has been done. Highlighted that big data and its analysis are at the core of modern science and business. Sagiroglu et al. identified a number of sources of big data such as on-line transactions, emails, audios, videos, images, click-streams, logs, posts, search queries, health records, social networking interactions, mobile phones and applications, scientific equipment, and sensors. Also, it was pointed out, in their work, that the big data are difficult to capture, form, store, manage, share, analyze, and visualize via conventional database tools. Furthermore, the three main characteristics of big data, namely variety, volume, and velocity are discussed in this work [1]
Data Mobile Ubiquitous LAN Extensions (MULEs) is the one of the most prominent and earliest studies on the mobile sink scheme. Data MULEs follow the basic steps of all the mobile sink schemes. First, it divides sensor nodes into clusters. Second, it decides the route for patrolling each cluster [2] [3]. The work assumes a simple data collection scheme whereby the mobile sink node divides sensor nodes into grids regardless of the sensor nodes’ location, and patrols the grids by using random walk between the neighboring grids. However, this type of clustering, which is not based on the nodes’ location, might result in inefficient data gathering. If there is no sensor node remaining in the cluster, patrolling the empty cluster results in waste of time and degraded efficiency. Also, patrolling based on randomness might result in unbalanced visits to clusters with different numbers of sensor nodes. Thus, the mobile sink might fail to collect information [4].
not able to use the algorithm. Most of the distributed algorithms like LEACH naturally consider the limitation of the node’s communication range [6].
Power-Efficient Gathering in Sensor Information Systems (PEGASIS) is one of the centralized clustering algorithms. PEGASIS algorithm constructs chain clusters of nodes based on location, and repeats cluster head selection. In PEGASIS, each node communicates only with a close neighbor and takes turns transmitting to the base station, thus reducing the amount of energy spent per round. PEGASIS algorithm considers the limitation of the communication range, and achieves uniform energy consumption. However, the algorithm still does not achieve minimization of energy consumption because the clustering algorithm uses greedy algorithm [7] [8].
Propose a new scheme called K-means and TSP-based mobility (KAT mobility). After clustering the sensor nodes, the proposed method navigates the mobile sink to traverse through the cluster centers according to the trajectory of an optimized route. The mobile sink then collects the data from sensors at the visited clusters. KAT mobility divides the nodes into clusters by using k-means algorithm. Because k-means algorithm is the centralized clustering algorithm based on the node’s location, the clustering result is closer to the total optimization. While the result is the optimal cluster that reduces energy consumption, the KAT mobility algorithm is designed without considering the communication range limitation. Therefore, the mobile sink might fail to collect information from all nodes [9] [10].
III. METHODOLOGY
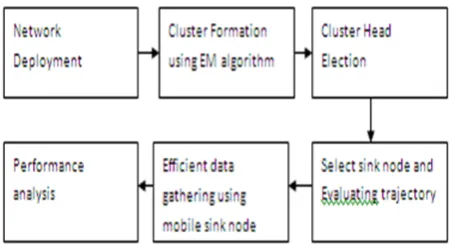
The proposed technique has been explained with the help of modules. There are four modules and are explained with the help of the architecture Figure3.1.
Figure 3.1 Architecture of the proposed system
The Modules are:
1. Network Deployment 2. Cluster Formation 3. Cluster Head Election
4. Evaluate trajectory of sink node 5. Data Gathering
6. Performance analysis
A. Network Deployment
First define the Network configuration parameters i.e., specify the number of nodes ,initial energy, MAC,
propagation, Receiver power, sleep power, transmission power, Channel Type, Propagation or TwoRayGround i.e., radio-propagation model, network interface (Phy/ Wireless Phy), MAC type(Mac/802_11),interface queue type (CMUPriQueue), link layer type, antenna model (Antenna /Omni-Antenna), maxpacket in ifq, number of mobile nodes, X axis distance, Y axis distance Initial Energy, Initial energy in Joules. Then deploy all the nodes into the network with some moving velocity
The network stack for a mobile node consists of a link layer (LL), an ARP module connected to LL, an interface priority queue (IFq), a Mac layer (MAC), a network interface (netIF), all connected to the channel. These network components are created and plumbed together in OTcl. The relevant Mobile Node method add-interface.
Create the instance for the super class Simulator and make use of this reference variable for creating and specifying the parameters for the node. Create the nam file for invoking the nam window with the set command and opening the nam file in the write mode. For this file reference variable give the command ns-namtrace-all.
Creating the topology with set topo command and specifying the type of the topology as flatgrid and specifying xvalue and y value. Configuring the nodes by specifying the values of the network parameters. Creating the nodes using the for loop and “$ns-node” command. Assign the positions for all the nodes with the setdest command and xvalue, yvalue. Attach the udp agent to the node. Attach the CBR traffic from source to sink by setting the packet size, packet interval. Connect the agents.
Link Layer- The only difference being the link layer for mobile node, has an ARP module connected to it which resolves all IP to hardware (Mac) address conversions. Normally for all outgoing (into the channel) packets, the packets are handed down to the LL by the Routing Agent. The LL hands down packets to the interface queue. For all incoming packets, the Mac layer hands up packets to the LL which is then handed off at the node_entry_ point
ARP- The Address Resolution Protocol (implemented in BSD style) module receives queries from Link layer. If ARP has the hardware address for destination, it writes it into the Mac header of the packet. Otherwise it broadcasts an ARP query, and caches the packet temporarily. For each unknown destination hardware address, there is a buffer for a single packet. Incase additional packets to the same destination is sent to ARP, the earlier buffered packet is dropped. Once 151 the hardware address of a packet’s next hop is known, the packet is inserted into the interface queue.
Interface Queue- The class PriQueue is implemented as a priority queue which gives priority to routing protocol packets, inserting them at the head of the queue. It supports running a filter over all packets in the queue and removes those with a specified destination address.
Starting with ns-2.33, several 802.11 implementations are available.
Tap Agents- Agents that subclass themselves as class Tap defined in mac.h can register themselves with the Mac object using method install Tap (). If the particular Mac protocol permits it, the tap will promiscuously be given all packets received by the Mac layer, before address filtering is done..
Network Interfaces: The Network Inter phase layer serves as a hardware interface which is used by mobile node to access the channel. The wireless shared media interface is implemented as class Phy/WirelessPhy. This interface subject to collisions and the radio propagation model receives packets transmitted by other node interfaces to the channel. The interface stamps each transmitted packet with the meta-data related to the transmitting interface like the transmission power, wavelength etc. This meta-data in pkt header is used by the propagation model in receiving network interface to determine if the packet has minimum power to be received and/or captured and/or detected (carrier sense) by the receiving node. The model approximates the DSSS radio interface.
Radio Propagation Model- It uses Friss-space attenuation (1/r2) at near distances and an approximation to two ray Ground (1/r4) at far distances. The approximation assumes specular reflection off a flat ground plane. See ~ns/tworayground.{cc, h} for implementation. Antenna An Omni-directional antenna having unity gain is used by mobile nodes.
B. Cluster Formation
In this module to minimize energy consumption for data transmission that must minimize the sum of square of data transmission distance in a network. The best clustering algorithm i.e , EM algorithm is used to form clusters. Not all nodes can connect to each other and also to the cluster centroid. Nodes that cannot directly communicate with the cluster centroid need to communicate in a multi-hop manner. In multi-hop communication, communication distance is a sum of distance between nodes in multi-hop path. Therefore, communication distance is different from direct distance. However, the EM algorithm minimizes the sum of square of direct distance, not communication distance. Thus, we need to adapt the EM algorithm to the situation of limited maximum communication range and improve it such as to minimize the sum of square of communication distance. EM algorithm calculates each node’s value of degree of dependence And the sensing range of nodes to form clusters
C. Cluster Head Election
The calculations are based on the following assumptions and simplifications. We assume that the intra cluster communication phase is long enough, so all leaf nodes having data can send their data to the cluster head; And the inter cluster communication phase is long enough, so all head nodes having data can send their data to the sink. The cluster head performs data aggregation and compression before transmitting the data to the sink. The sink will follow the trajectory and all sensor nodes are able
to reach the sink. Finally, we assume symmetric propagation channels.
D. Evaluate trajectory of sink node
After clustering of WSN nodes, here determine the actual trajectory of the mobile sink. The mobile sink traverses through clusters and aggregates data from various nodes. Since it possible to increase efficiency by reducing the travelling time, it is preferable that the mobile sink traces the shortest path among the cluster heads.
E. Data Gathering
The sink node sends data request message to invoke data transmission from sensor nodes when it arrives at the cluster centroids. The nodes that receive data request message send the data to the sink node and broadcast data request message to their neighboring nodes. That data request message is repeatedly broadcasted until all nodes that belong to the same group receive the message. If that node is parent node in cluster that relays data messages to the sink. Finally data is collected by the sink node.
IV. PERFORMANCE ANALYSIS
In this mathematical operations are performed based on the above all the operations then results will be stored into the xgraphs. The results will be analyzed through packet delivery ratio graph, packet drop graph, throughput graph and energy consumption graphs.
Figure 4.1 Packet Drop Rate
The number of packets dropped per transmission is the packet drop rate. The detailed analysis of the packet drop is depicted in the Figure 4.1.
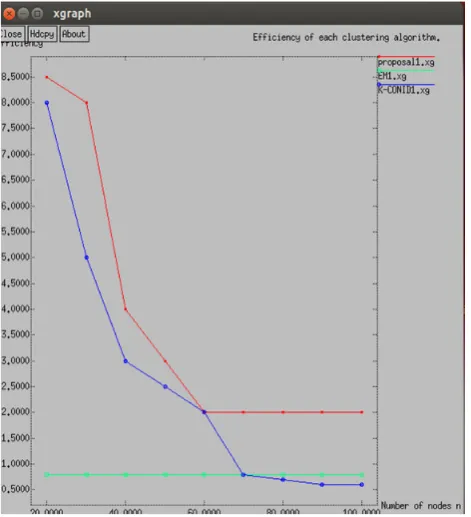
analysis of the efficiency of the clustering algorithms is depicted in the Figure 4.2.
Energy is the very important factor in wireless sensor network. The proposed methodology reduces optimally the energy used in the network. The graph Figure 4.3 clearly explains the energy used by various algorithms.
Figure 4.2 Efficiency of various clustering algorithms.
Figure 4.3 Energy utilization of various clustering algorithms.
Figure 4.4 Packet delivery Ratio.
The number of packets delivered in the respective intervals of time is the packet delivery ration. The detailed analysis of the packet delivery ratio is depicted in the Figure 4.4. And also the throughput Analysis is shown in Figure 4.5.
V. CONCLUSION
In the work, we investigated the challenging issues pertaining to the collection of the ``big data'' generated by densely distributed WSNs. Our investigation suggested that energy-efficient big data gathering in such networks is, indeed, necessary. While the conventional mobile sink schemes can reduce energy consumption of the sensor nodes, they lead to a number of additional challenges such as determining the sink node's trajectory and cluster formation prior to data collection. To address these challenges, we proposed a mobile sink based data collection method by introducing a new clustering method. Our clustering method is based upon a modified Expectation-Maximization technique. Furthermore, an optimal number of clusters to minimize the energy consumption were evaluated. Numerical results were presented to verify the effectiveness of our proposal.
REFERENCES
[1] C. Jiming, X. Weiqiang, H. Shibo, S. Youxian, P. Thulasiraman, and S. Xuemin, ``Utility-based asynchronous flow control algorithm for wire- less sensor networks,'' IEEE J. Sel. Areas Commun., vol. 28, no. 7, Sep. 2010.
[2] D. Baum and CIO Information Matters. (2013). Big Data, Big
Opportunity [Online].
[3] L. Ramaswamy, V. Lawson, and S. Gogineni, ``Towards a
quality-centric big data architecture for federated sensor services,'' in Proc. IEEE Int. BigData Congr., Jul. 2013, pp. 86_93.
[4] C.-C. Lin, M.-J. Chiu, C.-C. Hsiao, R.-G. Lee, and Y.-S. Tsai,
``Wireless health care service system for elderly with dementia,''
IEEE vol. 10, no. 4, pp. 696_704, Oct. 2006.
[5] P. E. Ross, ``Managing care through the air [remote health
monitoring],'' IEEE Spectr., vol. 41, no. 12, pp. 26_31, Dec. 2004. [6] S. Wen-Zhan, H. Renjie, X. Mingsen, B. A. Shirazi, and R. Lahusen,
``Design and deployment of sensor network for real-time high-_delity volcano monitoring,'' IEEE Trans. Parallel Distrib. Syst., vol. 21, no. 11, pp. 1658_1674, Nov. 2010.
[7] S. Ferrari, and A.V. Rao, ``Optimal control of an underwater sensor network for cooperative target tracking,'' IEEE J. Ocean. Eng., vol. 34, no. 4, pp. 678_697, Oct. 2009.
[8] R. C. Shah, S. Roy, S. Jain, and W. Brunette, ``Data MULEs:
Modeling and analysis of a three-tier architecture for sparse sensor networks,'' Ad Hoc Netw., vol. 1, nos. 2_3, pp. 215_233, 2003. [9] W. Heinzelman, H. Balakrishnan, ``Energy-efficient communication
protocol for wireless micro-sensor networks,'' in Proc. 33rd Annu.
Hawaii Int. Conf. Syst. Sci., vol. 2. Jan. 2000.