Western University Western University
Scholarship@Western
Scholarship@Western
Electronic Thesis and Dissertation Repository
8-20-2019 10:00 AM
Data Analytics and Performance Enhancement in Edge-Cloud
Data Analytics and Performance Enhancement in Edge-Cloud
Collaborative Internet of Things Systems
Collaborative Internet of Things Systems
Tianqi YuThe University of Western Ontario
Supervisor Wang, Xianbin
The University of Western Ontario Co-Supervisor Shami, Abdallah
The University of Western Ontario
Graduate Program in Electrical and Computer Engineering
A thesis submitted in partial fulfillment of the requirements for the degree in Doctor of Philosophy
© Tianqi Yu 2019
Follow this and additional works at: https://ir.lib.uwo.ca/etd
Part of the Systems and Communications Commons
Recommended Citation Recommended Citation
Yu, Tianqi, "Data Analytics and Performance Enhancement in Edge-Cloud Collaborative Internet of Things Systems" (2019). Electronic Thesis and Dissertation Repository. 6466.
https://ir.lib.uwo.ca/etd/6466
This Dissertation/Thesis is brought to you for free and open access by Scholarship@Western. It has been accepted for inclusion in Electronic Thesis and Dissertation Repository by an authorized administrator of
Abstract
Based on the evolving communications, computing and embedded systems technologies,
Internet of Things (IoT) systems can interconnect not only physical users and devices but also
virtual services and objects, which have already been applied to many different application scenarios, such as smart home, smart healthcare, and intelligent transportation. With the rapid
development, the number of involving devices increases tremendously. The huge number of
devices and correspondingly generated data bring critical challenges to the IoT systems. To
enhance the overall performance, this thesis aims to address the related technical issues on IoT
data processing and physical topology discovery of the subnets self-organized by IoT devices.
First of all, the issues on outlier detection and data aggregation are addressed through the
development of recursive principal component analysis (R-PCA) based data analysis
frame-work. The framework is developed in a cluster-based structure to fully exploit the spatial
correlation of IoT data. Specifically, the sensing devices are gathered into clusters based on
spatial data correlation. Edge devices are assigned to the clusters for the R-PCA based
out-lier detection and data aggregation. The outout-lier-free and aggregated data are forwarded to the
remote cloud server for data reconstruction and storage. Moreover, a data reduction scheme
is further proposed to relieve the burden on the trunk link for data uploading by utilizing the
temporal data correlation. Kalman filters (KFs) with identical parameters are maintained at the
edge and cloud for data prediction. The amount of data uploading is reduced by using the data
predicted by the KF in the cloud instead of uploading all the practically measured data.
Furthermore, an unmanned aerial vehicle (UAV) assisted IoT system is particularly
de-signed for large-scale monitoring. Wireless sensor nodes are flexibly deployed for
environ-mental sensing and self-organized into wireless sensor networks (WSNs). A physical topology
discovery scheme is proposed to construct the physical topology of WSNs in the cloud server to
facilitate performance optimization, where the physical topology indicates both the logical
con-nectivity statuses of WSNs and the physical locations of WSN nodes. The physical topology
discovery scheme is implemented through the newly developed parallel Metropolis-Hastings
random walk based information sampling and network-wide 3D localization algorithms, where
UAVs are served as the mobile edge devices and anchor nodes. Based on the physical topology
constructed in the cloud, a UAV-enabled spatial data sampling scheme is further proposed to
efficiently sample data from the monitoring area by using denoising autoencoder (DAE). By deploying the encoder of DAE at the UAV and decoder in the cloud, the data can be partially
sampled from the sensing field and accurately reconstructed in the cloud.
In the final part of the thesis, a novel autoencoder (AE) neural network based data outlier
detection algorithm is proposed, where both encoder and decoder of AE are deployed at the
edge devices. Data outliers can be accurately detected by the large fluctuations in the squared
error generated by the data passing through the encoder and decoder of the AE.
Keywords: data processing, topology discovery, machine learning, edge-cloud collaborative computing, Internet of Things systems
Lay Summary
Based on the evolving communications, computing and embedded systems technologies,
the Internet of Things (IoT) can interconnect not only physical users and devices but also
virtual services and objects, which have already been pervasively deployed. With the rapid
development, the number of involving devices increases tremendously. The huge number of
devices and generated data bring critical challenges. To enhance the overall performance, this
thesis aims to address the related issues on IoT data processing and physical topology discovery
of the subnets self-organized by IoT devices.
Firstly, the issues on outlier detection and data aggregation are addressed through the
de-velopment of recursive principal component analysis based data analysis framework. The
framework is developed in a cluster-based structure to fully exploit the spatial data
correla-tion. Moreover, a temporal data correlation based reduction scheme is further proposed to
reduce the amount of data uploading, which is implemented by using the data predicted by the
Kalman filters in the cloud instead of uploading all the practically measured data.
Furthermore, an unmanned aerial vehicle (UAV) assisted IoT system is designed for
large-scale monitoring, where UAVs are served as the mobile edge devices. Specifically, wireless
sensor nodes are flexibly deployed for environmental sensing and self-organized into wireless
sensor networks (WSNs). The physical topology of WSNs unveils the logical connectivity
sta-tuses of WSNs and the physical locations of nodes, which can facilitate system performance
optimization. Thus, a physical topology discovery scheme is proposed to construct the
phys-ical topology in the cloud. Moreover, a UAV-enabled spatial data sampling scheme is further
proposed to efficiently sample data from the monitoring area by using denoising autoencoder (DAE). By deploying the encoder of DAE at the UAV and decoder in the cloud, the data can
be partially sampled from the area and accurately reconstructed in the cloud.
In the final part, a novel autoencoder based data outlier detection algorithm is proposed,
where both encoder and decoder of autoencoder are deployed at the edge devices. Data outliers
can be accurately detected by the large fluctuations in the squared error generated by the data
passing through the encoder and decoder.
To my parents
Acknowledgments
I would like to express my deepest appreciation to my supervisor, Dr. Xianbin Wang, for
all his guidance, patience and support. It was his enlightening supervisions that inspired me
to explore novel research areas and broadened my views in the research area. It was also his
guidance and encouragement that helped me get prepared for my future career with all the
professional skills. It was a wonderful and rewarding journey to learn from him.
I also feel grateful to my co-supervisor, Dr. Abdallah Shami. Thanks to his professional
insights and technical guidance, I was able to achieve exiting research findings and implement
my ideas into practice. It was my honor to work with him.
Sincere thanks to Dr. Rachid Benlamri, Dr. Kostas Kontogiannis, Dr. Anestis Dounavis
and Dr. Jagath Samarabandu for being my examination committee. I highly appreciate their
precious time and constructive suggestions on my thesis and research.
Additionally, I would like to thank every course instructor and administrative staffthat I met at The University of Western Ontario. I cannot complete this degree without their assistance
and kindness during these four years.
I would also like to express my thanks and gratitude to my research group colleagues, who
helped me a lot in both work and daily life just like my brothers and sisters. I was so lucky
to meet such a big and warm research group. I would also like to extend my thanks to all my
friends, who gave me strong support whenever and wherever I needed help.
As always, I feel so grateful to my parents and my family. I highly appreciate their love
and support throughout not only this degree but also my life. They are always there for me and
always back me up.
Contents
Abstract i
Lay Summary iii
Dedication iv
Acknowledgments v
List of Figures x
List of Tables xii
List of Abbreviations xiii
1 Introduction 1
1.1 Overview of Internet of Things Systems . . . 1
1.2 Challenges in the Explosive Growth of IoT Systems . . . 3
1.3 Research Objectives of the Thesis . . . 5
1.4 Technical Contributions of the Thesis . . . 6
1.5 Thesis Outline . . . 8
2 Data Analytics in IoT Systems 11 2.1 Introduction to Data Analytics in IoT Systems . . . 11
2.1.1 IoT Data Characteristics . . . 12
2.1.2 IoT Data Challenges . . . 13
2.1.3 Taxonomy of IoT Data Analytics . . . 14
2.2 Architectures for Data Analytics in IoT Systems . . . 17
2.2.1 Cloud-based IoT System Architecture . . . 17
2.2.2 Edge-Cloud Collaborative IoT System Architecture . . . 19
2.3 Applications of Data Analytics in IoT Systems . . . 21
2.3.1 Smart City . . . 21
2.3.2 Smart Healthcare . . . 23
2.3.3 Industrial IoT . . . 25
2.3.4 Social Network . . . 27
2.3.5 Environmental Monitoring . . . 29
2.4 Chapter Summary . . . 29
3 Recursive Principal Component Analysis based Data Outlier Detection and
Sen-sor Data Aggregation in IoT Systems 30
3.1 Introduction . . . 31
3.2 Related Work . . . 33
3.2.1 Spatial Correlation based Data Outlier Detection . . . 33
3.2.2 Spatial Correlation based Sensor Data Aggregation . . . 34
3.3 Principal Component Analysis . . . 35
3.4 Proposed Data Analysis Framework Using Recursive Principal Component Analysis . . . 37
3.4.1 Data Sampling at Sensor Nodes . . . 38
3.4.2 Data Outlier Detection and Aggregation at Cluster Head . . . 39
3.4.2.1 Initialization Phase . . . 39
3.4.2.2 Recursion Phase . . . 40
3.4.3 Data Recovery at IoT Data Center . . . 44
3.5 Performance Evaluation . . . 44
3.5.1 Detection Accuracy of Data Outlier . . . 44
3.5.1.1 Databases & Metrics . . . 44
3.5.1.2 Univariate Outlier Detection . . . 46
3.5.1.3 Multivariate Outlier Detection . . . 47
3.5.1.4 Threshold . . . 48
3.5.2 Recovery Accuracy of Aggregated Data . . . 50
3.5.3 Discussion on the Number of Clusters . . . 51
3.5.4 Complexity Analysis . . . 53
3.6 Chapter Summary . . . 53
4 A Novel Edge Computing Enabled Temporal Data Reduction Scheme in IoT Systems 55 4.1 Introduction . . . 56
4.2 System Model . . . 58
4.3 A Novel Edge Computing Enabled Temporal Data Reduction Scheme . . . 59
4.4 Performance Evaluation . . . 62
4.4.1 Multivariate Normality Analysis . . . 62
4.4.2 Experimental Evaluation . . . 64
4.4.2.1 Experimental Platform Setup . . . 64
4.4.2.2 Evaluation Metrics . . . 65
4.4.2.3 Analysis of Confidence Level . . . 65
4.4.2.4 Comparisons with GM and ARMA . . . 65
4.5 Chapter Summary . . . 66
5 Cloud-Orchestrated Physical Topology Discovery of Large-Scale IoT Systems Using UAVs 69 5.1 Introduction . . . 70
5.2 Cloud-Orchestrated Large-Scale IoT Systems Using UAVs . . . 72
5.3 Logical Topology Discovery by Subregion-based Parallel Metropolis-Hastings Random Walk . . . 74
5.3.1 Modeling of a WSN as a Graph . . . 74
5.3.2 Metropolis-Hastings Random Walk on a Graph . . . 74
5.3.3 Logical Topology Discovery by Subregion-based Parallel Metropolis-Hastings Random Walk Processes . . . 75
5.4 Topo-MDS: Logical Topology and Multidimensional Scaling based 3D Local-ization . . . 76
5.4.1 Relative Location Estimation by Multidimensional Scaling . . . 76
5.4.2 Physical Location Estimation by Linear Transformation . . . 77
5.4.3 Topo-MDS: Logical Topology and Multidimensional Scaling based Network-Wide 3D Localization Algorithm . . . 78
5.5 Proposed Physical Topology Discovery Scheme . . . 79
5.6 Performance Evaluation . . . 80
5.6.1 Simulation Settings . . . 81
5.6.2 Wireless Communication Channel Models . . . 81
5.6.3 Convergence Analysis . . . 83
5.6.4 Logical Topology Estimation Analysis . . . 84
5.6.5 Physical Location Estimation Analysis . . . 84
5.7 Chapter Summary . . . 90
6 UAV-Enabled Spatial Data Sampling in Large-Scale IoT Systems Using Denois-ing Autoencoder Neural Network 91 6.1 Introduction . . . 92
6.2 Related Work . . . 94
6.3 Denoising Autoencoder Neural Network . . . 95
6.3.1 Basic Autoencoder . . . 95
6.3.2 Denoising Autoencoder . . . 97
6.4 UAV-enabled Edge-Cloud Collaborative IoT System Architecture . . . 98
6.5 UAV-Enabled Spatial Data Sampling Scheme Using Denoising Autoencoder Neural Network . . . 99
6.5.1 System Initialization . . . 101
6.5.1.1 Physical Topology Construction . . . 101
6.5.1.2 Raw Data Collection . . . 101
6.5.1.3 Clustering . . . 101
6.5.2 Model Training . . . 103
6.5.2.1 Communication Representative Selection . . . 103
6.5.2.2 Data Sampling Representative Selection . . . 104
6.5.2.3 Model Training . . . 104
6.5.3 Data Sampling . . . 105
6.5.3.1 Data Sampling . . . 105
6.5.3.2 Data Encoding . . . 105
6.5.3.3 Data Reconstruction . . . 106
6.6 Performance Evaluation . . . 106
6.6.1 Simulation Settings . . . 106
6.6.1.1 Fundamental Settings . . . 106
6.6.1.2 Wireless Communication Channel Models . . . 108
6.6.2 Clustering Analysis . . . 109
6.6.3 Data Reconstruction Analysis . . . 111
6.6.3.1 Data Sampling Representative Selection Analysis . . . 112
6.6.3.2 Comparison with Compressive Sensing . . . 113
6.7 Chapter Summary . . . 114
7 Autoencoder Neural Network-based Data Outlier Detection in Edge-Cloud Col-laborative IoT Systems 115 7.1 Introduction . . . 116
7.2 Edge-Cloud Collaborative IoT System Architecture . . . 117
7.3 Autoencoder based Data Outlier Detection . . . 119
7.3.1 Data Outlier . . . 119
7.3.2 Basic Autoencoder . . . 120
7.3.3 Proposed Autoencoder based Data Outlier Detection Algorithm . . . . 121
7.3.3.1 System Initialization . . . 121
7.3.3.2 Model Training . . . 122
7.3.3.3 Data Outlier Detection . . . 123
7.4 Performance Evaluation . . . 124
7.4.1 Simulation Settings . . . 124
7.4.2 Evaluation Metrics . . . 125
7.4.3 Simulation Results . . . 126
7.5 Chapter Summary . . . 126
8 Conclusion and Future Work 128 8.1 Conclusion . . . 128
8.2 Future Work . . . 131
8.2.1 Collaborative Artificial Intelligence . . . 131
8.2.2 Cost-Efficient Event Management . . . 133
8.2.3 Security and Privacy Protection . . . 134
Bibliography 136
Curriculum Vitae 145
List of Figures
1.1 Diagram of IoT systems includes sensing, communications, and analytics layers. 2
2.1 Three Vs of big data: volume, velocity, and variety. . . 12
2.2 Taxonomy of data analytics in IoT systems. . . 14
2.3 A general cloud-based IoT system architecture. . . 17
2.4 A general edge-cloud collaborative system architecture. . . 19
2.5 Hut architecture for data analytics in smart city. . . 22
2.6 An edge-cloud collaborative IoT system architecture for OSA detection. . . 23
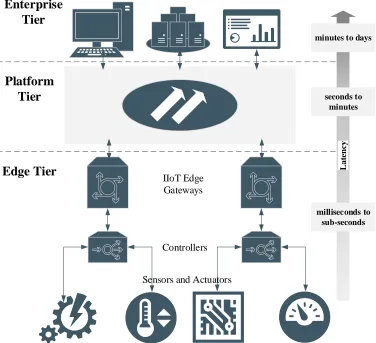
2.7 Three-tier IIoT system architecture. . . 26
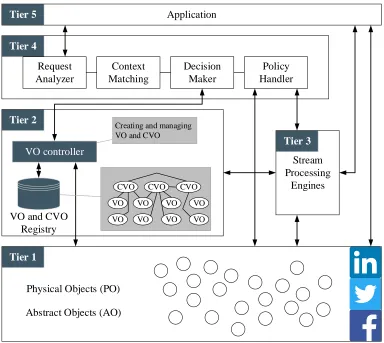
2.8 Architecture for data analytics in SIoT system. . . 27
3.1 R-PCA based multivariate data analysis framework for outlier detection and data aggregation. . . 37
3.2 Sea surface temperature measurements collected from the NDBC-TAO project with random and continuous outliers. . . 45
3.3 Statistical results of the univariate data outlier detection in the NDBC-TAO. . . 47
3.4 Comparison on the TPR (left) and FPR (right) between the CR-PCA and the PR-PCA with different numbers of clusters (#C) under different outlier proba-bilities. . . 48
3.5 Comparison on the TPR (left) and FPR (right) between different detection thresholds of SPE score with different numbers of clusters (#C) under different outlier probabilities. . . 49
3.6 Comparison on the relative recovery error between the CR-PCA and the PR-PCA. 51 3.7 Comparison on the relative recovery error and the network energy consumption of the CR-PCA and the PR-PCA under different numbers of clusters. . . 52
4.1 An edge computing enabled IoT system architecture. . . 57
4.2 Chi-square Q-Q plot generated by the squared Mahalanobis distance among data from different numbers of sensor nodes (k=1,2,3,4). . . 64
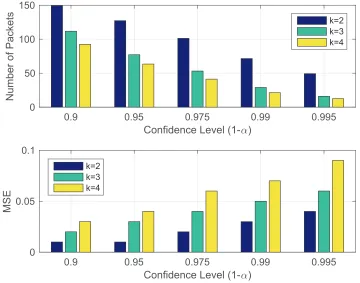
4.3 The effect of the confidence level (1−α) on the number of packets uploading to the cloud and the mean squared error (MSE). . . 66
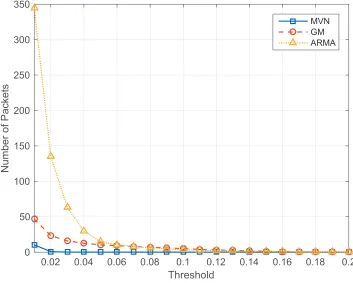
4.4 Comparison on the number of packets uploading between the proposed MVN-based scheme and the benchmark methods (GM and ARMA). . . 67
4.5 Comparison on MSE between the proposed MVN-based scheme and the bench-mark methods (GM and ARMA). . . 68
5.1 A general architecture of the cloud-orchestrated large-scale IoT systems. . . 71
5.2 Deployment of UAV hovering points and sensor nodes in the 3D scenario. . . . 81 5.3 Logical topology estimation errorεc with different transmitting powersPt. . . . 85
5.4 Influence of the transmitting powerPt and the distance estimation offset ratio
γon 3D location error. . . 86 5.5 Influence of the number of subregions #c and the UAV hovering interval (m)
on 3D location error. . . 87 5.6 Scenario 1 (UAV heights∈[20m 50m]): comparison between Topo-MDS and
benchmark algorithms (multi-lateration, MDS, MBL-MDS) on 3D location error. 88 5.7 Scenario 2 (UAV heights=20m): comparison between Topo-MDS and
bench-mark algorithms (multi-lateration, MDS, MBL-MDS) on 3D location error. . . 89
6.1 A general structure of the autoencoder neural network with a single hidden layer. 96 6.2 A general structure of the denoising autoencoder. . . 97 6.3 UAV-enabled edge-cloud collaborative architecture for data processing in
large-scale IoT monitoring systems. . . 98 6.4 Dataflow of the UAV-enabled spatial data sampling scheme. . . 100 6.5 Masks are randomly generated for the training of DAE models. . . 104 6.6 Geographical distribution (a) and temporal variance (b) of the temperature field. 107 6.7 Comparison between traditional threshold-based clustering algorithm (a)ε=3
(b)ε=5 and the proposed bounded-size K-means clustering algorithm (c) [5,15] andεINI=3. . . 109
6.8 Influence of the parameters on clustering results: (a) upper bound (MAX CZ) and lower bound (MIN CZ); (b) initial value and offset of clustering threshold
ε(εINIandεOFFS ET). . . 110
6.9 Original, sampled, and reconstructed temperature values (◦C) from 15 sensor
nodes within a cluster. . . 112 6.10 Comparison on the data reconstruction error between the proposed DAE-based
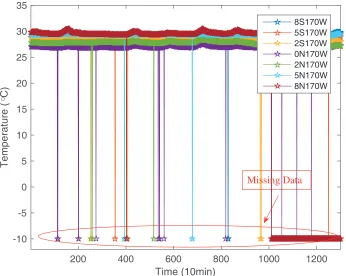
scheme and the CS-based method under different sampling ratios. . . 113 7.1 A general architecture of edge-cloud collaborative IoT systems. . . 118 7.2 Sea surface temperature measurements from 7 monitoring stations at 170W in
the TAO project. . . 120 7.3 Dataflow of the AE-based data outlier detection algorithm. . . 122 7.4 Deployment of the monitoring stations in the TAO project. . . 124 7.5 Squared error generated by data reconstruction at 100 selected sampling
mo-ments. . . 125 7.6 ROC curves of the data outlier detection with different numbers of units in the
single hidden layer. . . 127
List of Tables
3.1 [NDBC-TAO] Random Outlier Detection . . . 46
3.2 [NDBC-TAO] Mixed Outlier Detection . . . 46
3.3 Relative Recovery Error . . . 50
4.1 P-Values of Skewness and Kurtosis . . . 63
5.1 Neighbor Table of Sensor Nodevi . . . 73
5.2 Comparison between Global and Parallel MHRW on Convergence Time (Hops) 83 5.3 Topology Estimation Error of Topology Preserving Map Method . . . 84
6.1 Record of Link Quality . . . 103 6.2 Comparison between Different Data Sampling Representative Selection Criteria 112
List of Abbreviations
IoT Internet of Things
VANET vehicular ad hoc networks
WSN wireless sensor network
UAV unmanned aerial vehicle
PCA principal component analysis
PC principal component
SPE squared prediction error
DAE denoising autoencoder
KF Kalman filter
MHRW Metropolis-Hastings random walk
MDS multidimensional scaling
GPS global positioning system
D2D device-to-device
LTE long term evolution
Wi-Fi wireless fidelity
RF radio frequency
LDA latent Dirichlet allocation
OSA obstructive sleep apnea
TIHM technology integrated healthcare management
AMI advanced metering infrastructure
SIoT social Internet of Things
OSN online social network
PO physical object
AO abstract object
VO virtual object
CVO composite virtual object
ISMA intelligent sensing model for anomaly detection
SVM-RBF support vector machine-radial basis function
IIoT industrial Internet of Things
M2M machine-to-machine
CS compressive sensing
DFD distributed fault detection
MVN multivariate normal
CDF cumulative distribution function
MSE mean squared error
GM grey model
ARMA autoregressive and moving average
SVD singular value decomposition
RSS received signal strength
List of Abbreviations (Cont’d)
LOS line-of-sight
FOM free-space outdoor model
AE autoencoder
RSSI received signal strength indicator
LQI link quality indicator
IRLS iterative reweighted least squares
GD gradient descent
AI artificial intelligence
QoS quality of service
Chapter 1
Introduction
1.1
Overview of Internet of Things Systems
By utilizing the rapidly developing communications, computing, and embedded systems
tech-nologies, Internet of Things (IoT) systems are able to interconnect not only physical users and
devices, but also virtual objects and services, which can finally change the way of living in
many different kinds of scenarios, such as smart city, smart healthcare, and Industry 4.0 [1]. Due to the pervasive deployment and enlarging scale of IoT systems, the number of involving
devices keeps increasing in an explosive trend, which expects to reach 18 billion in 2022 [2].
The tremendous increment in the number of devices brings huge challenges to the
perfor-mance of IoT systems. Before the detailed investigations on the challenges, the fundamentals
of IoT systems are firstly introduced with the conceptual system architecture, which provides
a blueprint of the whole system.
The ultimate goal of IoT systems is to make timely and reliable decisions and provide
customized services by fully utilizing the information collected from objects and environments.
In order to achieve the goal, a paradigm of IoT systems should at least comprise the following
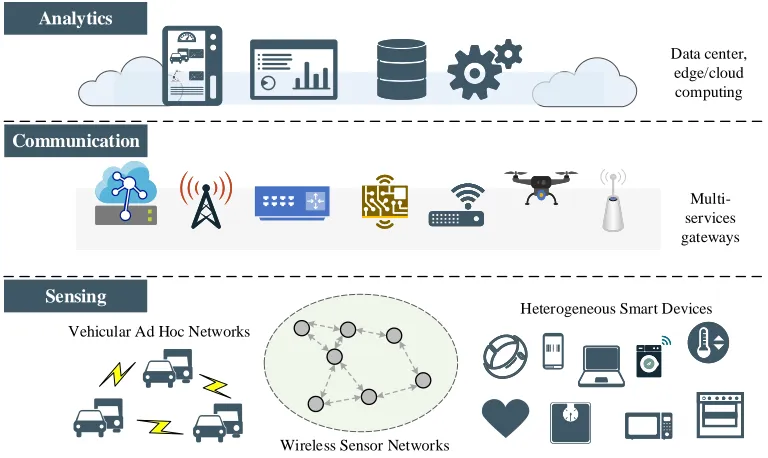
components,i.e., sensing, communication, and analytics layers, as shown in Fig.1.1.
• Sensing layercomposed of IoT end devices is the most fundamental component in the
IoT systems, which is responsible for sensing and collecting the environmental
infor-mation, and also reacting to the feedback and instructions. These IoT end devices are
2 Chapter1. Introduction
Vehicular Ad Hoc Networks
Communication
Sensing
Wireless Sensor Networks
Heterogeneous Smart Devices Multi-services gateways Data center,
edge/cloud computing
Analytics
Figure 1.1: Diagram of IoT systems includes sensing, communications, and analytics layers.
heterogeneous with different capabilities of computing, communications, and storage, which can be self-organized into several subnets, such as vehicular ad hoc networks
(VANETs) and wireless sensor networks (WSNs). Therefore, it is a tough task to eff ec-tively coordinate and manage the massive amount of heterogeneous IoT end devices and
subnets in the sensing layer.
• Communication layer supported by multi-services gateways is the backbone network
for IoT data communications, including the uplink for the uploading of sensing data and
the downlink for the delivery of feedback. Due to the heterogeneous feature, multiple
kinds of communication protocols may coexist in the IoT systems. Thus, multi-services
gateways are needed to facilitate the data communications throughout the systems, such
as the femto base stations, wireless access points, and mobile gateways (e.g., unmanned
aerial vehicle (UAV)).
• Analytics layer is responsible for IoT data processing and analysis. In IoT systems,
data analytics can be flexibly executed. IoT data can be locally processed at the IoT end
devices, though the IoT end devices are with limited resources and can only provide
ele-mentary processing. IoT data can also be uploaded to the remote data center,e.g., cloud
1.2. Challenges in theExplosiveGrowth ofIoT Systems 3
communications from the remote platform can lead to high latency. Thus, edge
comput-ing has been introduced into IoT systems as a compromise, which is more close to the
IoT end devices and can provide real-time responses to the local devices. Meanwhile,
edge computing can provide preliminary data processing, so that the tasks of cloud
com-puting can be partially offloaded to the edge and the burden of data uploading on the trunk link can be relieved. Thus, collaborative computing is a promising solution to the
computation-intensive tasks in the IoT systems, which needs to be seriously analyzed
and designed.
1.2
Challenges in the Explosive Growth of IoT Systems
The pervasive deployment and increasing system scale boost the explosive growth of IoT
systems, which brings huge technical challenges to the IoT systems alongside the enormous
amount of involving devices. In order to enhance the system performance on real-time,
relia-bility and scalarelia-bility, some of the existing and potential technical challenges in the IoT systems
are unveiled as follows.
• Interoperability among massive and heterogeneous devices: IoT systems typically
comprise a huge number of devices with different capabilities of communications, com-puting, and storage. Without effective interoperability among these devices, the relia-bility and scalarelia-bility of IoT systems would be degraded dramatically. The specific
as-pects of interoperability in the IoT systems include the communications and coordination
among the massive amount of end devices in the sensing layer, the interactions between
the sensing layer and the intermediate multi-services gateways, the communications and
cooperation among the gateways, and the interactions between the gateways and the
re-mote system data and control center. Therefore, multiple communication protocols and
coordination mechanisms need to be customized for the IoT systems to guarantee the
interoperability among the massive and heterogeneous devices.
• Autonomous organization and management: IoT end devices can be self-organized
4 Chapter1. Introduction
and scalability of IoT systems. However, due to the random and scalable features, the
in-formation of self-organized subnets,e.g., network topology, can hardly be known in the
system control center in advance. Furthermore, the dynamic and resource-constrained
IoT end devices tend to change the subnets in unpredictable ways. Thus, unbiased
in-formation sampling schemes are needed to collect the inin-formation of the devices and
subnets, so that the system control center can have a better knowledge of the entire
sys-tem for device management, event management, and syssys-tem performance optimization.
• IoT data processing and analysis: The huge number of IoT end devices continuously
generate a massive amount of IoT data, which challenges the IoT systems on timely and
reliable data processing and analysis. Providing the weak capabilities of some IoT end
devices, the IoT data has to be uploaded to the remote data center,e.g., cloud computing
platform, for comprehensive data analytics and storage. However, the overwhelming
amount of data uploading imposes a heavy burden on the trunk link, which may even
result in system crashes. Furthermore, given the complex and dynamic environmental
situations of the deployment fields, IoT end devices are vulnerable to different kinds of attacks and inner malfunctions, which can finally taint the IoT data. The abnormal
IoT data can lead the data-driven IoT systems into unsafe conditions. Therefore, it is
necessary to develop appropriate system architecture and corresponding algorithms for
data processing and analysis in the IoT systems.
• Collaborative computing: In order to reduce system investment and operating costs,
certain IoT devices are built with limited resources. Thus, resource-constrained devices
can hardly be used to complete computation-intensive tasks. Collaborative computing is
a promising solution, which can finally provide timely and reliable services to users and
devices by optimally utilizing the distributed system resources in IoT systems.
Specif-ically, the implementation of collaborative computing in IoT systems relies on the
re-source awareness of individual devices, optimal rere-source allocation, and task offloading. Each of the technical fundamentals needs to be seriously investigated.
• Security and privacy protection: The resource-constrained IoT devices are vulnerable
1.3. ResearchObjectives of theThesis 5
and lack of protection mechanisms. The malicious attacks can easily occur during the
procedure of data communications, which may either steal the IoT data by eavesdropping
or mislead the IoT systems by spoofing, tampering or dropping the IoT data. Moreover,
the privacy of users would also be exposed to the adversaries through the compromised
devices. Considering the pervasive deployment of IoT systems, malicious attacks can
bring huge security and privacy threats to the industry, environment, and society.
How-ever, the existing security and privacy protection mechanisms are too complex to be
applied to the IoT systems directly. Therefore, lightweight and distributed security and
privacy protection mechanisms need to be tailored for the IoT systems to protect data
confidentiality and user privacy.
1.3
Research Objectives of the Thesis
Considering the challenges mentioned above, technical issues on IoT data processing and
topology management of the self-organized subnets would be addressed in the thesis. The
specific research objectives are identified as follows.
• Design of IoT system architecture: The general requirements of IoT system
architec-ture design are dynamic, flexible, and scalable, due to the dynamic and heterogeneous
features of the huge number of IoT end devices [3]. Beyond the general demands, the
specific needs of IoT data processing and topology management should be involved in the
design as well, since the IoT system architecture has deterministic effects on the dataflow of IoT data processing and also the efficiency of device coordination and management. The existing conceptual architectures of IoT systems include the cloud-based
architec-ture and edge-cloud collaborative architecarchitec-ture, while the latter is more appropriate for
the IoT systems with requirements of large-scale and real-time analytics. Although the
conceptual architecture exists, the functionalities of each system components and the
collaborations among them still need to be seriously considered and carefully designed
for specific applications.
6 Chapter1. Introduction
the number of heterogeneous IoT end devices, data processing in IoT systems meets the
challenges of high volume and taint. Therefore, data processing algorithms, particularly
for data aggregation and data outlier detection, need to be developed in order to reduce
the amount of data uploading and clean the tainted data. Due to the context-aware
capa-bilities of IoT systems and mild change of physical environments, IoT data are generally
labeled with timestamp and location and are temporally and spatially correlated, which
can be exploited to develop the data processing algorithms.
• Development of topology management schemes: Due to the randomly deployed and
self-organized features of IoT end devices, particularly, wireless sensor nodes, it is diffi -cult to control the physical topology of the subnets in IoT systems. However, awareness
of physical topology is important, since physical topology indicates both the physical
lo-cations and connection statuses of IoT end devices, which can be utilized to facilitate the
IoT systems with performance optimization such as device management and real-time
event detection. Thus, the development of topology management schemes is a necessity.
Since IoT end devices are context-aware, unbiased sampling of the device information
can be exploited to construct the physical topology at the system control center.
1.4
Technical Contributions of the Thesis
The main contributions of this thesis are summarized as follows.
• In order to aggregate the redundant data and detect the outliers in IoT systems, a
cluster-based data analysis framework is proposed using recursive principal component analysis
(R-PCA). More specifically, at a cluster head, spatially correlated sensor data collected
from cluster members are aggregated by extracting the principal components (PCs). The
data outliers are identified by the abnormal squared prediction error (SPE) score, which
is defined as the square of residual value after extraction of PCs. With R-PCA, the
parameters of the PCA model can be recursively updated to adapt to the changes in IoT
systems. The cluster-based data analysis framework also releases the computational and
1.4. TechnicalContributions of theThesis 7
• Denoising autoencoder (DAE) neural network is an extension of PCA on nonlinear data
correlation. By using DAE, a UAV enabled spatial data sampling scheme is proposed for
large-scale IoT systems. More specifically, a UAV-enabled edge-cloud collaborative IoT
system architecture is firstly developed for data processing in large-scale IoT monitoring
systems, where the UAV is utilized as a mobile edge computing device. Based on the
system architecture, the UAV-enabled spatial data sampling scheme is further proposed,
where wireless sensor nodes of the large-scale IoT systems are clustered by a newly
developed bounded-size K-means clustering algorithm. A neural network model, i.e.,
DAE, is applied to each cluster for data sampling and reconstruction by exploiting either
linear or nonlinear spatial correlation among data samples. Taking advantage of the
DAE neural network model, the accuracy and efficiency of spatial data sampling are dramatically improved. Furthermore, similar to PCA, the squared error generated by
passing through the autoencoder (AE) neural network can also be used to identify the
data outliers.
• The R-PCA and DAE based algorithms are proposed based on the spatial data
correla-tion, while an edge computing enabled temporal IoT data reduction scheme is further
proposed by the exploitation of temporal data correlation. More specifically, IoT data
are firstly modeled as multivariate normal distribution in the cloud. Dual Kalman filters
(KF) with identical parameters are then deployed at both the cloud and edge platforms.
The same predictions are simultaneously triggered by the dual KFs at both platforms.
Only the measured IoT data out of the predicted range is further uploaded from edge to
cloud. Otherwise, predicted values at both platforms are used instead of measurements.
By using this approach, the amount of data uploading is reduced so that the burden on
the bandwidth of the trunk link is relieved.
• In order to build up the physical topology in the cloud, a cloud-orchestrated physical
topology discovery scheme is proposed for the large-scale IoT systems by using UAV.
More specifically, the large-scale monitoring area is firstly split into several subregions
for UAV-enabled data collection. Within the subregions, parallel Metropolis-Hastings
8 Chapter1. Introduction
IDs and neighbor tables. The collected information is forwarded to the cloud through
UAV for the initial construction of logical topology. After that, a network-wide 3D
lo-calization algorithm is further developed based on the logical topology and
multidimen-sional scaling method, termed as ToMDS, where the UAV equipped with a global
po-sitioning system (GPS) chipset is served as a mobile anchor to locate the sensor nodes.
The physical topology can be successfully formed up by using the proposed scheme.
Based on the physical topology constructed in the cloud, the target areas can be timely
located when abnormal events occur.
1.5
Thesis Outline
The remainder of this thesis is organized as follows.
A comprehensive study of data analytics in IoT systems is conducted in Chapter 2. The
fun-damentals of IoT data analytics are firstly elucidated, which comprises IoT data characteristics,
IoT data challenges and taxonomy of IoT data analytics. Afterwards, the system architectures
that can support effective and efficient data analytics in IoT systems are analyzed, including the cloud-based architecture and edge-cloud collaborative architecture. Finally, the existing
applications such as smart city and smart healthcare are investigated from the perspectives of
system design and shortcomings of performance.
In Chapter 3, a cluster-based data analysis framework is proposed using R-PCA, which can
aggregate the redundant data and detect the data outliers simultaneously. More specifically, at
a cluster head, sensor data collected from cluster members are highly correlated in the spatial
domain and thus aggregated by extracting the PCs, and potential data outliers are identified
by the abnormal SPE score, which is defined as the square of residual value after extraction
of PCs. With R-PCA, the parameters of the PCA model can be recursively updated to adapt
to the changes in IoT systems. The cluster-based data analysis framework also relieves the
computational and processing burdens on sensor nodes. Practical databases based simulations
have indicated that the proposed framework efficiently aggregates the correlated sensor data with high recovery accuracy. The data outlier detection accuracy is also improved by the
1.5. ThesisOutline 9
In Chapter 4, a temporal IoT data reduction scheme empowered by edge computing is
proposed to reduce the amount of data uploaded to the cloud. More specifically, IoT data
are firstly modeled as multivariate normal distribution in the cloud. Dual KF with identical
parameters are then deployed at both cloud and edge ends. The same predictions are triggered
by the dual KFs at both ends simultaneously. Only the measurements out of the predicted
ranges are further uploaded from edge to cloud. Otherwise, predicted values at both ends
are used instead of measurements. A simple IoT system prototype has been developed for
performance evaluation. Experimental results indicate that the proposed scheme significantly
reduces the number of packets uploaded to the cloud platform while ensures the data accuracy.
In Chapter 5, a cloud-orchestrated physical topology discovery scheme for large-scale IoT
systems using UAVs is proposed, in order to build up the physical topology in the cloud. More
specifically, first of all, the large-scale monitoring area is split into subregions for UAV-enabled
data collection. Within the subregions, parallel MHRW is developed to gather the information
of nodes, including their IDs and neighbor tables. The collected information is then forwarded
to the cloud through UAV for the initial construction of logical topology. After that, a
network-wide 3D localization algorithm is further developed based on the logical topology and
multidi-mensional scaling method, termed as Topo-MDS, where the UAV equipped with a GPS chipset
is served as a mobile anchor to locate the nodes. Simulation results indicate that the parallel
MHRW improves both the efficiency and accuracy of logical topology construction. Besides, the Topo-MDS algorithm dramatically improves the 3D localization accuracy, as compared to
the existing algorithms in the literature.
In Chapter 6, a UAV enabled spatial data sampling scheme is proposed using DAE neural
network. More specifically, a UAV-enabled edge-cloud collaborative IoT system architecture
is firstly developed for data processing in large-scale IoT monitoring systems, where the UAV
is utilized as a mobile edge computing device. Based on the system architecture, the
UAV-enabled spatial data sampling scheme is further proposed, where wireless sensor nodes of the
large-scale IoT systems are clustered by a newly developed bounded-size K-means clustering
algorithm. A neural network model, i.e., DAE, is applied to each cluster for data sampling
and reconstruction by the exploitation of either linear or nonlinear spatial correlation among
10 Chapter1. Introduction
scheme has improved the data reconstruction accuracy under the same sampling ratio without
introducing extra complexity, as compared to the compressive sensing based method.
Based on the system architecture and the dataflow proposed in Chapter 6, an AE neural
network based data outlier detection algorithm is further developed in Chapter 7. By using
AE, the spatial correlation of data can be fully utilized to improve the data outlier detection
accuracy. Performance evaluation has been conducted based on the oceanic atmospheric data.
Simulation results indicate that the developed scheme can accurately detect the data outliers.
Finally, all the contributions are summarized in Chapter 8, where the future research
Chapter 2
Data Analytics in IoT Systems
With the pervasive deployment of IoT technology, the number of connected IoT end devices
in-creases in an explosive trend, which continuously generates a massive amount of data. Timely
data analytics can provide useful information for decision making in the IoT systems, which is
able to enhance both the system efficiency and reliability. More specifically, data analytics in IoT systems is utilized to effectively and efficiently process the discrete IoT data series and pro-vide services such as data classification, pattern analysis, and tendency prediction. However,
the continuous generation of data from heterogeneous devices brings huge technical challenges
to IoT data analytics. Thus, how to timely and fully process and analyze the massive and
het-erogeneous IoT data needs to be seriously considered in the design of IoT systems. This chapter
provides a comprehensive study of data analytics in IoT systems. A fundamental introduction
to data analytics in IoT systems is firstly elucidated, including the characteristics of IoT data,
the challenges of IoT data, and the taxonomy of IoT data analytics. IoT system architectures
suitable for data analytics are thoroughly analyzed then. Finally, a comprehensive survey on
the existing applications of data analytics in IoT systems is conducted from the perspectives of
system design and shortcomings of performance.
2.1
Introduction to Data Analytics in IoT Systems
With the rapid development of communications and embedded systems technologies, IoT
12 Chapter2. DataAnalytics inIoT Systems
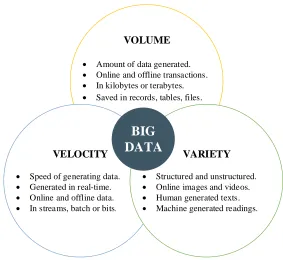
VOLUME
• Amount of data generated.
• Online and offline transactions.
• In kilobytes or terabytes.
• Saved in records, tables, files.
VELOCITY
• Speed of generating data.
• Generated in real-time.
• Online and offline data.
• In streams, batch or bits.
VARIETY
• Structured and unstructured.
• Online images and videos.
• Human generated texts.
• Machine generated readings.
BIG
DATA
Figure 2.1: Three Vs of big data: volume, velocity, and variety.
of involving IoT end devices keeps increasing in an explosive trend. These devices directly
interact with the real world and continuously generate a massive amount of data, which brings
huge challenges to the data analytics in IoT systems, particularly the data analytics with a
crit-ical requirement of completion time. Thus, data analytics needs to be seriously considered in
the IoT systems. In this section, data analytics in IoT systems is analyzed from the perspectives
of IoT data characteristics, IoT data challenges and taxonomy of IoT data analytics.
2.1.1
IoT Data Characteristics
With the tremendous increment in the number of IoT end devices, a massive amount of IoT
data are generated as a consequence. However, due to the unique characteristics of IoT data,
data analytics in IoT systems is not identical to the conventional big data analytics. Thus, the
characteristics of IoT data are firstly identified in this subsection.
The renowned properties of big data are the three Vs, namely, volume, velocity, and variety,
as depicted in Fig.2.1 [4]. Though they have three Vs in common, IoT data still have several
2.1. Introduction toDataAnalytics inIoT Systems 13
• Large scale:With the pervasive deployments of large-scale IoT systems, a large number
of IoT end devices are involved in the systems and continuously generate a massive
amount of data. In most of IoT systems, not only the real-time data but also the historical
data are needed to provide the descriptions of user patterns, environmental trends, etc.
Thus, both the real-time and historical data have to be processed, analyzed and stored in
the IoT systems, which finally labels the characteristic of large scale to IoT data.
• Heterogeneity: The sensing layer of an IoT system as shown in Fig.1.1 is in high
diver-sity, which comprises heterogeneous devices and subnets. Different from the traditional homogeneous wireless networks, data generated by the heterogeneous IoT devices are
not identical in formats and even unstructured, which finally results in heterogeneity.
• Temporal and spatial correlation:IoT data are generally labeled with both location
infor-mation and timestamp, as most of the IoT systems are context-aware. The labeled IoT
data are highly correlated in temporal and spatial domains because the environmental
pa-rameters sensed and sampled by the IoT end devices are varied in mild trends. Providing
the statistical characteristic of temporal and spatial correlation, IoT data can be easily
processed with the statistical tools and the machine learning methods.
• Taint: Due to the low-cost feature of IoT end devices, these tiny devices are vulnerable to
different kinds of attacks and also inner malfunctions, which can finally lead to abnormal IoT data. Therefore, data pre-processing, particularly data cleaning, is generally needed
before eventually performing data analysis.
2.1.2
IoT Data Challenges
Providing the unique characteristics of IoT data, the technical challenges on data collection,
data analytics and data usage that IoT systems can meet are stated as follows.
• Data collection: In the large-scale IoT systems, “things”, namely, the connected IoT
end devices are the most fundamental components. So the first challenge comes with
14 Chapter2. DataAnalytics inIoT Systems
IoT Data Analytics
Historical Analytics
Real-Time Analytics
Descriptive Analytics
Diagnostic Analytics
Predictive Analytics
Prescriptive Analytics
Figure 2.2: Taxonomy of data analytics in IoT systems.
recognized who, where, when and why generating these data. Besides, during the stage
of data collection, data accuracy, integration and security need to be ensured as well.
• Data analytics: The collected IoT data are then uploaded to the cloud platform through
edge devices. During this stage, it is necessary to seriously consider how to store the
data with different structures and formats, and how to process and analyze the data with appropriate tools.
• Data usage:Since most of the IoT applications are data-driven, how to manage the
own-ership of data, how to legally share data with others and how to provide efficient and useful feedback to the actuators need to be considered in the system design as well.
2.1.3
Taxonomy of IoT Data Analytics
Analyticsrefers to “the scientific process of transforming data into insights for the purpose of
making better decisions” [7]. In terms of IoT data analytics, it is the computational process
of transforming the IoT data collected from the heterogeneous IoT end devices into insights
through data processing and analysis, for decision making in the IoT systems. The history of
IoT data analytics is as long as the emergence of IoT systems. Therefore, several efforts have been spared on the processing and analysis of IoT data. According to the different requirements of dataset and completion time, data analytics in IoT systems can be classified into historical
analytics and real-time analytics as shown in Fig.2.2. Moreover, in conventional big data
2.1. Introduction toDataAnalytics inIoT Systems 15
types, namely, descriptive analytics, diagnostic analytics, predictive analytics, and prescriptive
analytics [8]. These four types are also integrated into the taxonomy diagram of IoT data
ana-lytics, according to the type of dataset usage, the requirement of processing time and the stage
of the processing procedure.
Historical analytics is based on the IoT data that have been collected and stored in the
database for a certain while, which can be further classified into descriptive analytics and
di-agnostic analytics. Descriptive analytics is the fundamental of IoT data processing, which
uncovers the patterns behind the raw data. Diagnostic analytics is used to discover the reasons
behind certain patterns.
• Descriptive analytics: Descriptive analytics is the process of transforming raw data
col-lected from multiple data sources into useful information, which describes the past. For
example, a clinic records the number of patients that were hospitalized last month.
How-ever, the findings of the descriptive analytics simply describe the fact, without inferring
the reasons behind. Therefore, descriptive analytics only can hardly support the highly
data-driven application scenarios of the IoT systems, where other types of data analytics
are still needed.
• Diagnostic analytics: At the stage of diagnostic analytics, historical data from multiple
data sources are jointly analyzed with the diagnostic tools to find out the reasons behind
the facts provided by descriptive analytics. By exploitation of diagnostic analytics, it is
possible to identify the hiding data patterns and underlying relations among data, which
can provide in-depth insights into a particular problem. In the meantime, IoT systems
should have detailed information at their disposal, otherwise, data collection may turn
out to be individual for every issue and time-consuming.
Real-time analytics in IoT systems focuses on the design of IoT system architecture that
must complete the data analytics and return responses within a certain time frame, which is
known as the deadline. According to the requirements of different applications, the deadline could range from nanosecond in computer network communications to millisecond in
16 Chapter2. DataAnalytics inIoT Systems
of a task much earlier than the deadline may also deteriorate the system performance. Fast
responses and precise timing control are typical features of real-time analytics.
Real-time analytics can be further classified into predictive analytics and prescriptive
ana-lytics, which have more critical requirements on real-time responses as compared to descriptive
and diagnostic analytics. Besides, instead of the historical data stored in the database,
predic-tive and prescrippredic-tive analytics rely more on the real-time data continuously and timely collected
from the IoT end devices. Based on the patterns identified by descriptive analytics, predictive
analytics can predict future patterns by using real-time data. Prescriptive analytics is the final
stage of IoT data analytics, which makes decisions based on the results of predictive analytics
and provides the corresponding reaction and feedback.
• Predictive analytics: Based on the findings of descriptive and diagnostic analytics,
pre-dictive analytics serves as a forecasting tool, which can support the detection of
tenden-cies and the prediction of future trends. Taking advantage of the predictive analytics,
an industrial IoT system, for instance, can identify the machines that are most likely to
break down, and prepare reactions in advance to minimize the potential loss. Although
predictive analytics has numerous advantages, it is worth to aware of the risks of wrong
predictions, since the accuracy of prediction highly depends on the data quality and
sta-bility of the situation. Therefore, it is necessary to treat the prediction carefully and
optimize it continuously.
• Prescriptive analytics:The objective of prescriptive analytics is to prescribe what actions
to take so that a potential issue can be eliminated and a promising trend can be fully
uti-lized. An example of prescriptive analytics is that a large-scale IoT surveillance system
can timely prevent the occurrence of bad accidents and react to unpreventable
emergen-cies with prepared plans. However, prescriptive analytics requires not only historical
data, but also external information due to the nature of statistical algorithms.
Further-more, prescriptive analytics generally uses sophisticated tools, such as the deep learning
methods, which brings high computational complexity to the system. Therefore, the
design of an IoT system should jointly consider the expected added values brought by
2.2. Architectures forDataAnalytics inIoT Systems 17
Cloud Server
Vehicular Ad Hoc Networks
Wireless Sensor Networks
Heterogeneous Smart Devices
Figure 2.3: A general cloud-based IoT system architecture.
2.2
Architectures for Data Analytics in IoT Systems
The design of system architecture determines the dataflow in the IoT systems, which finally
affects the processing and completion time of data analytics. Therefore, the architecture design needs to be seriously considered for data analytics in IoT systems. In this section, the general
architectures of IoT systems that are able to support effective and efficient data analytics are ex-tensively surveyed and analyzed, which migrates from the traditional cloud-based architecture
to the newly developed edge-cloud collaborative architecture.
2.2.1
Cloud-based IoT System Architecture
In the initial deployment stage of IoT systems, cloud-based IoT system architecture is the
dominating architecture. As shown in Fig.2.3, the system architecture consists of two major
parts, namely, IoT end devices and the cloud computing platform.
• IoT end devices and the self-organized subnets are the fundamental components of the
IoT systems, which have direct interactions with the physical environments through
sen-sors and actuators. For example, in the case of a smart home system, temperature sensen-sors
sample the indoor temperature and upload the measurements to the cloud through either
a wired gateway or wireless access point. The air conditioner can react to the feedback
18 Chapter2. DataAnalytics inIoT Systems
• Cloud computing platform is the remote data and control center in the IoT systems. IoT
data collected from the IoT end devices are comprehensively processed at the cloud,
while the results are sent back to the IoT end devices as feedback. Given the strong
computing capability of the cloud server, it can support the comprehensive IoT data
analytics and the massive amount of IoT data storage.
However, with the tremendous increase in the number of IoT end devices, the cloud-based
IoT systems have met the following limitations which prevent them from being pervasively
deployed in the large-scale application scenarios with critical requirements of real-time
pro-cessing and analysis [9]:
• Unstable cloud connection: Cloud computing platform is remotely located, which can
lead to the weak stability of the connections between cloud and IoT end devices. For
example, in VANETs, handover of the fast-moving vehicles can result in the temporary
absence of cloud computing service. The unstable cloud connection can lead to messy
coordination of smart vehicles and finally incur bad traffic accidents. Thus, the IoT systems face a huge challenge – how to ensure normal operations in the absence of cloud
connection.
• Limited bandwidth: Although the cloud server has the capability of processing the
mas-sive amount of data, the procedure of data uploading still challenges the bandwidth of
the trunk link. In the case of industrial IoT systems, the huge amount of data imposes
a heavy burden on the underlying network bandwidth, while overwhelming data can
fi-nally lead to system crash. Therefore, it is necessary to pre-process, especially effectively compress the IoT data first, instead of simply uploading all the data to the cloud.
• High latency: The data processing, analysis, and storage center is remotely located at the
cloud server, which incurs unavoidable latency due to the procedure of data processing
and communication. While in some systems, for instance, smart healthcare, real-time
responses are needed for emergency cases, especially for elders living alone. Hence,
how to reduce latency and provide real-time responses is also a critical challenge in
2.2. Architectures forDataAnalytics inIoT Systems 19
Cloud Processing
Edge Processing
IoT End Devices & Subnets
Subnet1: Smart Building System
Subnet2: Wild-field Monitoring System
Subnet3: Smart Home System
Trunk Link
Cloudlet Server
IoT Cloud Server
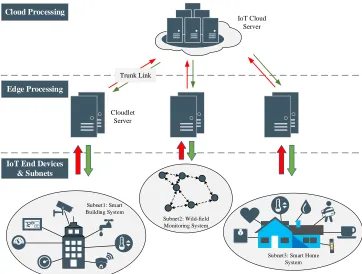
Figure 2.4: A general edge-cloud collaborative system architecture.
Due to the technical limitations, the cloud-based architecture can hardly meet the critical
requirements of real-time and massive data analytics in large-scale IoT systems. In this
con-dition, edge computing has been introduced into the system as a promising solution, which
enables the local and real-time processing for IoT end devices and offloading computational tasks from the cloud platform [10]. The correspondingly developed edge-cloud collaborative
IoT system architecture is presented in the next subsection.
2.2.2
Edge-Cloud Collaborative IoT System Architecture
A general edge-cloud collaborative architecture for data analytics in heterogeneous IoT
sys-tems is depicted in Fig.2.4. The system architecture mainly consists of heterogeneous IoT end
devices, edge computing devices, and the cloud computing platform, which are detailed below.
• Heterogeneous IoT end devices and subnetsare still functioning as the fundamental layer
in the edge-cloud collaborative architecture and directly interact with the physical
hetero-20 Chapter2. DataAnalytics inIoT Systems
geneous with quite different capabilities (e.g., computing, communication, and storage). Hence, device-to-device (D2D) communications among these devices request the
sup-port of multiple communication protocols (e.g., ZigBee, LTE, and WiFi).
• Edge computing devices (“edge devices” for short) have been introduced into the IoT
systems as a potential and promising solution, considering the technical limitations of
cloud-based IoT systems. In the newly developed edge-cloud collaborative IoT system,
edge computing devices locate in the intermediate layer, which can provide local and
real-time processing to IoT end devices and can also execute preliminary data analytics
so that the tasks can be offloaded from the cloud platform and the burden of trunk link can be relieved. In the system architecture proposed in Fig.2.4 [11], the lightweight
cloudlet servers are utilized as the edge computing devices. In addition to the cloudlet
server, any device that has the capabilities of computing, communication, and storage
can be utilized as the edge device, for example, a femto base station, lightweight server
and smart gateway. Even the UAV can serve as a mobile edge device.
• Cloud computing platform is the legacy of cloud-based architecture, which still serves
as the remote data and control center in the edge-cloud collaborative IoT system
archi-tecture. Since edge devices have limited computing and storage capabilities, the cloud
platform is responsible for the complex and comprehensive data analytics and the
mas-sive amount of data storage.
Functions of the major components in the system architecture have been explained in detail.
The interactions, namely, data communications, among them are further given as follows.
• IoT end devices and edge devices:Edge devices are equipped with RF modules of diff er-ent communication protocols, which can support the data uploading from heterogeneous
IoT end devices. As aforementioned, edge devices serve as the intermediate layer in the
edge-cloud collaborative IoT system architecture. Therefore, besides the data
upload-ing, edge devices are also responsible for sending and relaying the reaction and feedback
generated by either edge devices or the cloud platform back to the IoT end devices.
2.3. Applications ofDataAnalytics inIoT Systems 21
cloud so that the burden on the trunk link can be relieved. Cloud platform sends back the
results of comprehensive data processing and analysis then. As compared to the cloud
platform, the capabilities of edge devices are weaker. Thus, the data processing speed of
the edge is slower than that of the cloud. While as mentioned in the previous subsection,
data offloading to the cloud can incur extra latency due to the procedure of data commu-nication. Therefore, it is necessary to balance the trade-offbetween processing time and communication time, when optimizing the task offloading of data analytics.
2.3
Applications of Data Analytics in IoT Systems
A comprehensive survey on the existing applications of data analytics in IoT systems is
con-ducted in this section, which includes smart city, smart healthcare, industrial IoT, social
net-work, and environmental monitoring. These applications are analyzed from the perspectives of
system design and shortcomings of performance.
2.3.1
Smart City
Hut architecture as depicted in Fig.2.5 is specifically designed for the smart city, which can
provide the service of real-time data processing based on the historical data analytics [12].
For example, in abnormal event detection, the historical batch data are used to learn the
nor-mal patterns so that the abnornor-mality of real-time data streams can be timely and accurately
identified. Two specific use cases using hut architecture are analyzed as instances. One is the
Madrid transportation system, where 3000 traffic sensors are deployed on the M30 ring road by Madrid city council. Based on the descriptive analytics of the historical traffic data collected by the sensors, bad traffic is detected in real-time in order to prevent the worse congestion and fa-cilitate public transportation. The other case is the Taiwan energy management system, where
malfunctioning electronic devices and unusual appliance usages are monitored and detected in
real-time through excessive power dissipation.
22 Chapter2. DataAnalytics inIoT Systems
Message Broker
Event Processing Framework
Data Storage Framework
Batch Analytics Framework
IoT
Data Retrieval
Ingestion Machine Learning/
Analytics Event Consumption
Data
Acquisition Actuation
Real Time
Batch
Figure 2.5: Hut architecture for data analytics in smart city.
traffic congestions using the Bayesian network in a real-time way. With the comprehensive consideration of multiple factors and utilization of the Bayesian network model, the prediction
of traffic congestions is more accurate. In [13], multiple data streams are jointly utilized for the same aim, namely, prediction of traffic congestions. In order to fully extract the relations among multiple data streams in the smart city, latent Dirichlet allocation (LDA), a topic extraction
method that is generally used in text analysis, is exploited to uncover the underlying structure
of the multiple data streams [14].
Although several efforts have been spared on the application of data analytics in the smart city, there are some challenges remaining as listed below.
• Factor selection: Smart city is a complex scenario with multiple data streams of different physical factors. It is a critical challenge to select the proper factors for the specific
target. In [13], traffic, media and weather data streams are utilized to predict the traffic congestions. In [14], LDA based method is utilized to uncover the relation between
traffic and weather data streams. The relations among the mentioned factors may be easy to aware from common senses. While for some other data streams, the underlying
2.3. Applications ofDataAnalytics inIoT Systems 23
Smart City Smart Home
Low Power Wireless Networks
IoT Layer Edge Computing Layer Cloud Computing Layer
Internet
Personal Data Environmental Data Communi
-cation Event
Handler
Pre-Processing
Accessibility Analytics
Storage
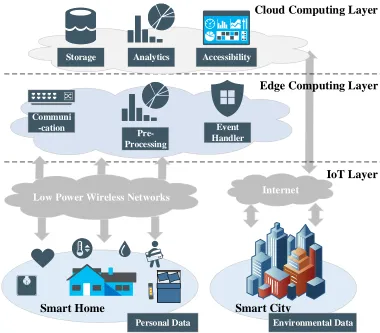
Figure 2.6: An edge-cloud collaborative IoT system architecture for OSA detection.
the underlying relations so as to improve the accuracy of prescriptive analytics.
• Time window selection: In the smart city, most of the applications have requirements
of real-time analytics,e.g., traffic coordination. However, the amount of data generated is huge, which imposes a heavy burden on data communications and can lead to the
high latency of data analytics. Therefore, the selection of a proper time window for data
collection is also among the most critical challenges. It is necessary to develop a method
that can adaptively adjust the time window, which can automatically decrease to capture
times of high interest in a finer granularity and adjust again in times of low interest.
2.3.2
Smart Healthcare
Smart healthcare is among the most promising application scenarios where IoT systems can
24 Chapter2. DataAnalytics inIoT Systems
been utilized to do long-term monitoring of chronic diseases. While for spasmodic diseases,
particularly the real-time emergency event detection for elders living alone, it has higher
re-quirements on the capability of real-time analytics, which needs to be seriously considered in
the design of IoT-enabled smart healthcare system. There have been a few works in this area
as analyzed below.
In [16], a real-time monitoring architecture is proposed for obstructive sleep apnea (OSA,
a severe sleep disorder) detection based on the collaboration of edge and cloud computing,
as depicted in Fig.2.6. For real-time OSA detection, multiple related factors are monitored
in-cluding sleep environment (collected by smart city system), sleep status, physical activities and
physiological parameters (collected by the smart home system). Edge and cloud play different roles in processing the measurements of these factors. More specifically, cloud computing with
stronger capability is responsible for batch processing enabled pattern recognition and event
prediction. Edge computing as analyzed in the section of architecture design is more close to
the monitoring devices, which is utilized to implement the real-time OSA detection and reduce
the latency of reaction and feedback. Through the edge computing enabled real-time detection,
lives can be saved from OSA.
Another commonly occurred disease of elders is dementia, which affects 46 million people around the world. In [17], an IoT system is specifically designed for dementia care, termed
as TIHM (technology integrated healthcare management). TIHM involves the families with
dementia patients, clinics and hospitals with healthcare experts, small and medium-sized IoT
companies, and academic groups with healthcare, economic, security, and technical experts.
The system architecture of TIHM is quite similar to the OSA detection system (Fig.2.6),
real-time data of environments, patients’ physiological parameters, and their daily lifestyles are
collected through environmental sensors, medical devices, wearable technologies, and
interac-tive applications. Lightweight servers provided by the IoT companies are functioned as edge
computing devices, while the TIHM project has a more powerful backend server providing the
service of cloud computing. Based on the data analytics, the needs of dementia patients can
be identified in an early stage, which allows the clinical team to provide a timely response and
prevent the patients from exacerbating ill health.