ABSTRACT
LIU, XIAJI. Quantitative Analysis of The Tactic “Compass” in B and T Lymphocyte Migration. (Under the direction of Dr. Jason Haugh.)
B and T lymphocytes play a central role in the adaptive immune response, and their directed migration is essential for homing to sites of antigen presentation. Like neutrophils, lymphocytes are rapidly moving cells that exhibit amoeboid movement, characterized by a definitive polarity with F-actin concentrated at the front and myosin II elsewhere. In this study, we used total internal reflection fluorescence (TIRF) microscopy to monitor the cells’ areas of contact with a surface presenting adhesive ICAM-1 and the chemokines,
CXCL12/SDF-1 and CXCL13/BLC. A microfluidic device was implemented to create surface-bound CXCL13 gradients to study B-cell directed migration.
Our analysis reveals that T-cell migration and reorientation are achieved by
bifurcation and lateral separation of protrusions along the leading membrane edge, followed by cessation of one of the protrusions, which acts as a pivot for cell turning. We show that the distribution of bifurcation frequencies exhibits characteristics of a random, spontaneous process; yet, the waiting time between bifurcation events depends on whether or not the pivot point remains on the same side of the migration axis. Our analysis further suggests that switching of the dominant protrusion between the two sides of the migration axis is associated with persistent migration, whereas the opposite is true of cell turning.
random T-cell migration. However, with the introduction of chemokine gradients, the model predicted chemorepulsive responses. A single modification of the model switched the simulated responses to chemotactic, while the predicted random migration behaviors remain consistent with experimental results.
Quantitative Analysis of The Tactic “Compass” in B and T Lymphocyte Migration
by Xiaji Liu
A dissertation submitted to the Graduate Faculty of North Carolina State University
in partial fulfillment of the requirements for the Degree of
Doctor of Philosophy
Biomedical Engineering
Raleigh, North Carolina 2015
APPROVED BY:
_______________________________ _______________________________
Dr. Jason Haugh Dr. Michael Gamcsik
Committee Co-chair Committee Co-chair
_______________________________ _______________________________
Dr. Shawn Gomez Dr. Zhen Gu
DEDICATION This dissertation is dedicated
to my beloved family for their support and understanding of my choice of studying abroad and to my friends for their support and company
BIOGRAPHY
Xiaji Liu, or Astor, was born in Shanxi, China and raised in Taiyuan, a peaceful midsize city. Her parents are supportive and open-minded in her education. She was exposed to painting, calligraphy, and secondary languages at a very young age. She got advance admission into Taiyuan No. 5 Middle School and spent 6 years in an inspiring environment. She established a strong interest in life technologies during her time in high school and was admitted in advance into CKC Honors College in Zhejiang University because of her outstanding performance in biology. She continued to major in bioscience in college. Dr. Naiming Zhou, her undergraduate research advisor introduced her to pharmacoengineering and encouraged her to pursue advanced degrees abroad. The experience in a short-term exchanging program to UC Davis further increased her interest in studying in the US. By the junior year, her progresses on both academic and research projects were well ahead of the schedule. So when the opportunity of an advanced admission into graduate school came she completed her BS degree on bioscience one year in advance. She then came to Raleigh, NC and started her graduate study in the UNC/NCSU Joint Department of Biomedical
ACKNOWLEDGMENTS
There are a lot of people I would like to acknowledge and owe my gratitude to during my time in graduate school. First I would like to thank my advisor Dr. Jason Haugh for his mentoring and support. He offered me the opportunity of joining the group and has guided my research ever since. I appreciate the help from all my colleges in Haugh group, present and former, – Dr. Erik Welf, Dr. Kyle Grant, Dr. Shoeb Ahmed, Dr. Heath Johnson, Dr. Krithika Mohan, Anis Rahman, Toufiq Rahman, and Jamie Nosbisch. I would like to thank my collaborators in Bear group of UNC Chapel Hill, Reichert and Kelsoe Group of Duke University. I would also like to thank the other members of my thesis Committee: my Academic Co-chair Dr. Michael Gamcsik, Dr. Shawn Gomez, Dr. Zhen Gu, Dr. Gregory Reeves and the former member Dr. Elizabeth Loboa for their direction and support. I am also grateful to my undergraduate advisor Dr. Naiming Zhou for his guidance to my
undergraduate research.
I would like to thank all of my friends here in NC State. Studying abroad would not have been as enjoyable without your company. Fan Fang, it has been my fortune to meet you and have your kindness and care. Many thanks to my friends accompanied my fun times and trips – Haiqing Lu, Fan, Wu, Wei Guo, Hao Hu, Yun Zhang, Wenjing Lu, Jin Di, Yufei Ding and many others. I would also like to thank all the Sunny Performing Arts Group members. It has been fun dancing with you all.
TABLE OF CONTENTS
LIST OF TABLES ... xi
LIST OF FIGURES ... xii
CHAPTER 1 Introduction to B and T Lymphocyte Migration ...1
1.1 Introduction ...2
1.2 B and T Lymphocytes ...3
1.3 Cellular Dynamics in Lymphocyte Migration ...4
1.3.1 Integrins and chemokines in lymphocyte migration ...4
1.3.2 Cytoskeleton dynamics in lymphocyte migration ...5
1.4 Chemokine Network ...6
1.4.1 Germinal center dynamics ...6
1.4.2 Chemokine-directed lymphocyte localization in germinal centers ...7
1.5 References ...8
CHAPTER 2 Linking Morphodynamics and Directional Persistence of T Lymphocyte Migration ...12
2.1 Introduction ...13
2.2 Results ...15
2.2.1 T lymphocyte migration is characterized by bifurcation of the lamellipodium at the cell’s leading edge ...15
2.2.2 T lymphocyte migration directionality is determined by the fates of extensions formed by bifurcation of the leading edge ...17
2.2.3 Lamellipodial bifurcation is rapid compared with cell movement and shows temporal characteristics of a spontaneous process ...20
2.3 Discussion ...25
2.4 Materials & Methods ...26
2.4.1 Cell culture and preparation ...26
2.4.2 T-cell migration assay surface preparation ...27
2.4.3 Random migration assay...27
2.4.4 Computational image analysis ...28
2.4.5 Waiting-time distributions ...29
2.4.6 Persistent random walk model ...30
2.5 References ...30
CHAPTER 3 Computational Modeling of T Lymphocyte Random and Directed Migration ...33
3.1 Introduction ...34
3.2 Results ...36
3.2.1 A computational model based on plausible feedback mechanisms can explain lamellipodial bifurcation and T-cell migration states ...36
3.2.2 Statistics of simulated F-actin dynamics show qualitative trends that match those of leading-edge bifurcation in migrating T cells ...40
3.2.3 The model shows chemorepulsive response to chemokine gradients ...42
3.2.4 A modified model shows chemotactic responses to chemokine gradients ...45
3.2.5 The modified model also reproduces the bifurcation characteristics of random T-cell migration ...48
3.3 Discussion ...49
3.4 Materials & Methods ...53
3.4.1 Computational modeling ...53
3.4.2 Computational model basics ...53
3.4.3 Random migration model ...54
3.4.3(a) F-actin Circuit ...54
3.4.4 Random migration model - simulated reactions ...57
3.4.5 Directed migration model ...64
3.4.5(a) F-actin Circuit ...64
3.4.5(b) Cell Rear ...65
3.4.5(c) Ligand Generation ...65
3.4.6 Directed migration model - simulated reactions ...66
3.4.7 Modified directed migration model ...68
3.4.8 Modified directed migration model - simulated reactions ...68
3.4.9 Modified random migration model ...70
3.4.10 Modified random migration model - simulated reactions ...71
3.4.11 FMI calculation ...72
3.4.12 Chemokine gradient characterization ...72
3.5 References ...74
CHAPTER 4 Quantitative Analysis of B Lymphocyte Random and Directed Migration ...78
4.1 Introduction ...79
4.2 Results ...80
4.2.1 Mouse B cell migration is characterized by cycles of dilation and shrinking of a broad leading edge ...80
4.2.2 The balance of dilation and shrinking activities between the two sides of the cell determines the overall direction of B-cell migration ...84
4.2.3 Dilation and shrinking are rapid compared with cell movement and show temporal characteristics of a spontaneous process ...86
4.2.4 B lymphocyte turning is associated with an imbalance between the two sides of the leading edge ...86
4.2.6 B-cell haptotactic response to immobilized CXCL13 gradients exhibits population
diversity ...92
4.2.7 B-cell haptotactic responses are stronger towards steep CXCL13 gradients ...95
4.3 Discussion ...98
4.4 Materials & Methods ...99
4.4.1 Cell culture and preparation ...99
4.4.2 B-cell random migration assay surface preparation ...100
4.4.3 Random migration assay...101
4.4.4 Haptotaxis assay ...101
4.4.5 Chemokine gradient visualization ...102
4.4.6 Computational image analysis ...103
4.4.7 Waiting-time distributions ...103
4.5 References ...104
CHAPTER 5 Summary and Future Work ...108
5.1 Summary ...109
5.1.1 Mouse T-cell random migration ...109
5.1.2 Computational Modeling Of T-cell Random And Directed Migration ...110
5.1.3 B-cell Random And Directed Migration ...110
5.2 Future Work ...111
5.2.1 T-cell haptotaxis assay ...111
5.2.2 Computational modeling of B-cell random and directed migration ...111
5.2.3 Subtype-specific B-cell migration ...112
APPENDICES ...113
APPENDIX A ...114
A.1 Supplemental Figures ...115
A.2.1 Flow cytometry ...120
A.2.2 Migration data quantification and analysis ...120
APPENDIX B Smoldyn Modeling Scripts ...122
B.1 T-cell random migration model ...123
B.2 T-cell chemorepulsive model ...127
B.3 T-cell chemotaxis model ...134
LIST OF TABLES
Table 3.1 F-actin Circuit in T-cell random migration model ...54
Table 3.2 Cell Rear in T-cell random migration model ...56
Table 3.3 F-actin Circuit in T-cell directed migration model ...64
LIST OF FIGURES
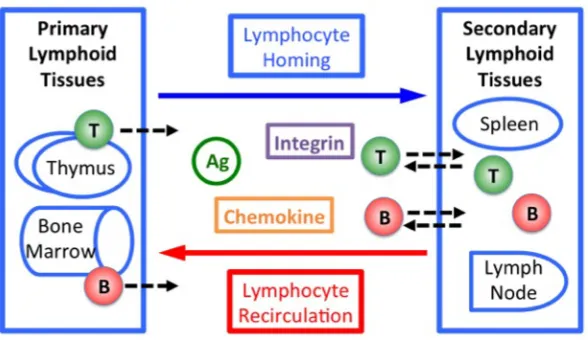
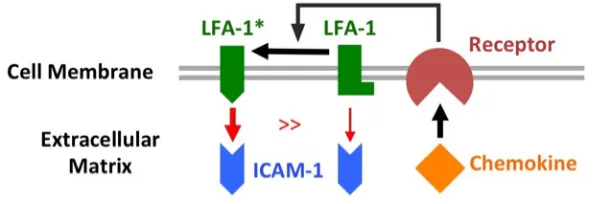
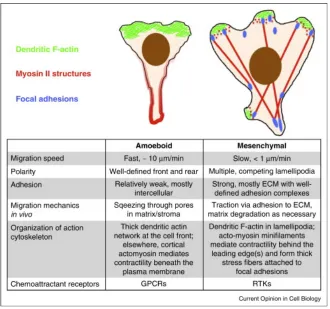
Fig. 1.1 Lymphocyte homing and recirculation. T and B lymphocytes shown include all subtypes. Ag: antigens. ...4 Fig. 1.2 Chemokine-dependent activation of LFA-1 ...5 Fig. 1.3 Mesenchymal vs. amoeboid motility and chemotaxis. Mesenchymal vs. amoeboid
motility and chemotaxis. The illustrations and table compare the structural and dynamic features of mesenchymal migration with those of amoeboid cells such as neutrophils and lymphocytes. ...6 Fig. 1.4 Germinal center dynamics. B and T lymphocyte localization in the germinal center
orchestrated by CXCL12 and CXCL13 gradients established by chemokine-secreting follicular dendritic cells (FDCs) and stromal cells (SCs). CXCR4 and CXCR5 expression is illustrated qualitatively by the corresponding symbols. LZ: light zone; DZ: dark zone. ...8 Fig. 2.1 T lymphocyte migration is characterized by bifurcation of protrusions at the leading
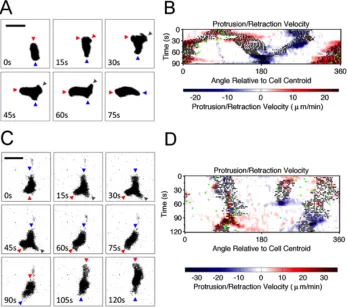
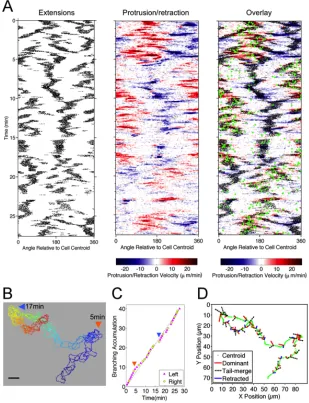
edge. a) Representative TIRF montage of a murine T cell executing a turn by bifurcation of the leading edge. The arrowheads mark morphological extensions that are protruding (red), retracting (blue), or stationary (gray). Scale bar = 10 µm. b) Morphodynamic map of the sequence depicted in a. Pixels associated with structures that are morphologically extended from the cell body are marked as black dots overlaid with edge velocity data, with protrusion and retraction marked by red and blue hues, respectively. The map also shows changes in the direction of cell centroid translocation (green dots). c) TIRF montage showing an uncommon instance of a T cell abruptly changing migration polarity. Extensions are labeled as in a. Scale bar = 10 µm. d) Morphodynamic map of the sequence depicted in c, constructed as in b. ...17 Fig. 2.2 T lymphocyte migration directionality is determined by the fates of extensions
edge velocity data, with protrusion and retraction marked by red and blue hues, respectively. Right: Overlay of the morphology and protrusion maps, also showing changes in the direction of cell centroid translocation (green dots). b) Stacked outlines of the cell depicted in a. Blue is the initial time point; red the end. Large-scale turning events are labeled with times as indicated. Scale bar = 10 µm. c) Accumulation of bifurcation events for the cell shown in a&b. Each event is labeled as indicated according to whether the dominant protrusion was on the left or right side of the migration axis. d) For the same cell analyzed in a–c, bifurcation events marked on the cell centroid track (green) showing the fates and orientations (left and right) of each protrusion. The relative length of each segment corresponds to the recorded lifetime of the extension. ...19 Fig. 2.3 Lamellipodial bifurcation is rapid compared with cell movement. a) Normalized
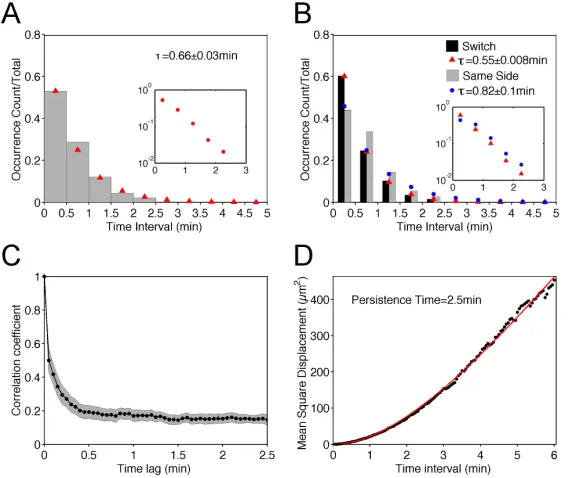
waiting-time distribution (WTD) for pairs of consecutive bifurcation events (n = 488). The red symbols are the corresponding best-fit values assuming an
exponential distribution. The inset shows the semi-logarithmic plot of the same data set. b) WTDs for bifurcation pairs where the two dominant protrusions were on different sides of the migration axis (switch) (n = 264) or on the same side (n = 224). The corresponding exponential fit values are indicated by red and blue symbols, respectively. The inset shows the semi-logarithmic plots of the switch (red) and same-side (blue) data. c) The autocorrelation coefficient of the cell movement vector as a function of the time lag. The gray region indicates the 95% confidence interval. d) Mean-squared displacement as a function of time interval. The red line is the best fit to a persistent random walk model. ...21 Fig. 2.4 Persistent and turning migration states are associated with switching and same-side
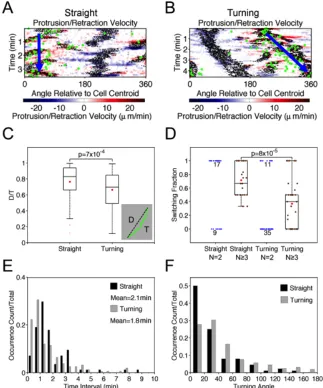
duration for straight and turning periods. e) Normalized distribution of number of branches for straight and turning periods. f) Distributions of bifurcation switching fraction for straight and turning periods. The switching fraction is defined as the fraction of consecutive bifurcation pairs that switch sides of the migration axis (left-right and (left-right-left). Each box and whiskers indicates the quartiles of the distribution of periods with at least two bifurcation pairs (N ≥ 3). The blue dots are switching fractions for periods with only one bifurcation pair (N = 2); the numbers indicate the number of occurrences when the switching fraction was 0 or 1. Red dots: mean values. p value: Student’s t-test. ...24 Fig. 3.1 A computational model can explain lamellipodial bifurcation and T-cell migration
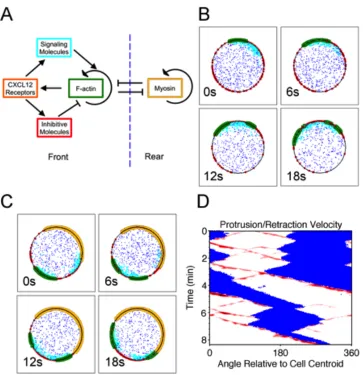
states. a) Schematic of the major interactions in the stochastic model. b) Montage of a brief period of simulation during which an F-actin patch (green) bifurcates in the absence of a cell rear. Inactive and active signaling molecules (blue and cyan, respectively) and a membrane-localized inhibitor (red) are depicted. The receptor species is not shown. c) Same as b but with an established cell rear module (beige). d) Morphodynamic map of a simulated cell showing simulated F-actin waves as a proxy for protrusion (red) and the cell rear as a proxy for retraction (blue). ...39 Fig. 3.2 Comparison of simulated F-actin dynamics to experiment. a) Normalized
occurrences when the switching fraction was 0 or 1. Red dots: mean values. p value: Student’s t-test. ...41 Fig. 3.3 The model shows chemorepulsive response to chemokine gradients. a) Schematic of
the major interactions in the model. Red arrow indicates the changed reaction. b) Montage of a brief period of simulation during which an F-actin patch (green) bifurcates with an established cell rear module (beige). Inactive and active signaling molecules (blue and cyan, respectively), a membrane-localized inhibitor (red) and the chemokine molecules (magenta) are depicted. The receptor species is not shown. c) Morphodynamic map of a representative simulated cell in response to chemokine gradients showing simulated F-actin waves as a proxy for protrusion (red) and the cell rear as a proxy for retraction (blue). Source rate = 1, Sink rate = 10. Median concentration = 14. Relative gradient steepness = 0.045. d)
Quantification of chemokine gradient steepness in relative to the Source rate (top panel) and cell directional responses to different gradient steepness (bottom panel). n = 7 for each group. e) Quantification of chemokine relative gradient steepness in relative to the inverse of the scaling factor a of the gradient field length L and the chemokine diffusing rate D (top panel) and cell directional responses to different relative gradient steepness (bottom panel). n = 7 for each group. ...44 Fig. 3.4 The modified model shows chemotactic response to chemokine gradients. a)
Fig. 3.5 The modified model also reproduces the bifurcation characteristics of random T-cell migration. a) Normalized waiting-time distribution (WTD) for pairs of consecutive bifurcation events (n = 461) in simulations with the same set of parameters as used in Fig. 3.4. The red symbols are the corresponding best-fit values assuming an exponential distribution. b) WTDs for switching (n = 256) or same-side (n = 205) bifurcation pairs. The corresponding exponential fit values are indicated by red and blue symbols, respectively. c) Normalized distribution of time duration for straight (n = 60) and turning (n = 90) periods identified in the simulation results. d)
Distributions of bifurcation switching fraction for straight and turning periods of the simulated results, analyzed as in Fig. 2.4D. Each box and whiskers indicates the quartiles of the distribution of periods with at least two bifurcation pairs (N ≥ 3). The blue dots are switching fractions for periods with only one bifurcation pair (N = 2); the numbers indicate the number of occurrences when the switching fraction was 0 or 1. Red dots: mean values. p value: Student’s t-test. ...49 Fig. 4.1 Mouse B-cell migration is characterized by cycles of dilation and shrinking of a
broad leading edge. Representative TIRF montage of a murine B cell a) migrating to a persistent direction and b) executing a turn. Scale bar = 10 µm. c) Concept illustrations of the protrusion/retraction map (left panel) and the dilation/shrinking map (right panel). Red hues indicate protrusion/dilation and blue hues indicate retraction/shrinking. Dark green dots are cell centroids of the previous time frame and light green dots are cell centroids of the later time frame. d) Morphodynamic map of the sequence depicted in a. Pixels associated with structures that are
green dots. g) Morphodynamic map of the sequence depicted in b, constructed as in f. ...83 Fig. 4.2 The balance of dilation and shrinking activities between the two sides of the cell
determines the overall direction of B-cell migration. a) Morphodynamic maps of a representative migrating cell. Left: edge velocity data, with protrusion and
retraction marked by red and blue hues, respectively. Right: edge velocity data, with dilation and shrinking marked by red and blue hues, respectively, also showing changes in the direction of cell centroid translocation (green dots). b) Stacked outlines of the cell depicted in a. Blue is the initial time point; red the end. Scale bar = 10 µm. c) For the same cell analyzed in a and b, dilation (red) and shrinking (blue) events marked on the cell centroid track (green) showing the orientations (left and right) of each protrusion. The length of each segment is proportional to the recorded lifetime of the dilated or shrunk region. ...85 Fig. 4.3 B lymphocyte turning is associated with an imbalance between the dilation an
shrinking on the two sides of the leading edge. a) Normalized waiting-time
distribution (WTD) for pairs of consecutive dilation/shrinking events (n = 736). The red symbols are the corresponding best-fit values assuming an exponential
distribution. The inset shows the semi-logarithmic plot of the same data set. b) WTDs for bifurcation pairs with one dilation and one shrinking event (switch) (n = 535) or the same type (n = 201). The corresponding exponential fit values are indicated by red and blue symbols, respectively. The inset shows the
difference between the accumulated dilation (+1)/shrinking (-1) scores on the two sides of the migration axis; this quantity is normalized by the maximum value for all periods (6). Each box and whiskers indicates the quartiles of the distribution. Red dots: mean values. p value: Student’s t-test. ...89 Fig. 4.4 Dilation/shrinking dynamics in response to CXCL12 is similar to the responses to
CXCL13 during B-cell random migration. a) Normalized waiting-time distribution (WTD) for pairs of consecutive dilation/shrinking events (n = 513). The red
symbols are the corresponding best-fit values assuming an exponential distribution. The inset shows the semi-logarithmic plot of the same data set. b) WTDs for
bifurcation pairs with one dilation and one shrinking event (switch) (n = 377) or the same type (n = 136). The corresponding exponential fit values are indicated by red and blue symbols, respectively. The inset shows the semi-logarithmic plots of the switch (red) and same-type (blue) data. c) Distributions of
displacement-over-distance traveled (D/T) ratio for straight (n = 54) and turning (n = 87) periods. Each box and whiskers indicates the quartiles of the distribution; red dots: mean values. p value: Student’s t-test. d) Normalized distribution of time duration for straight and turning periods. e) Normalized WTD distribution for straight and turning periods. The red symbols are the corresponding best-fit values assuming an exponential distribution. f) Distributions of balancing scores for straight and turning periods. The balancing score is the normalized absolute difference between the accumulated dilation (+1)/shrinking (-1) scores on the two sides. Each box and whiskers
indicates the quartiles of the distribution. Red dots: mean values. p value: Student’s t-test. ...91 Fig. 4.5 B-cell haptotactic response to immobilized CXCL13 gradients exhibits population
diversity. a) Surface-bound CXCL13 gradient shown by fluorescent antibodies (top panel) and the quantification of the gradient profile (bottom panel). Linear
bar = 100µm. b) Centroid tracks of 17 cells migrating on the surface shown in a. Round markers indicate the start and square markers indicate the end of the centroid tracks. CXCL13 gradient increases towards the left. c) Wind rose plot showing the temporal proportion of the migrating cells in b spent in each angular bin. 0 indicates the direction of the gradient. d) Average FMI values versus relative gradient
steepness (steepness divided by median intensity) of all experiments (n = 65, total number of cells = 746). Linear regression of the average FMI values to the relative gradient steepness is shown in dashed line. Scale bar: 10µm. ...94 Fig. 4.6 B-cell haptotactic responses are stronger towards steep CXCL13 gradients. a)
Angular tracks of cells initially migrating against (top, n = 431) and towards (bottom, n=264) the higher gradient of the whole dataset (n = 695). b) Normalized distribution of the centroid movement angles at each time point of cells initiated against (top) and towards (bottom) the higher gradient of the whole dataset. c) Average autocorrelation coefficient distribution of track segments binned by the initial movement angle at different time points of the whole dataset. Bin size is 45 degree. d) Angular tracks and e) angular distribution of cells initially migrating against (top, n = 129) and towards (bottom, n=76) the higher gradient of the moderate gradient subset (n = 205). f) Average autocorrelation coefficient
distribution of track segments binned by the initial movement angle at different time points of the shallow gradient subset. g) Angular tracks and h) angular distribution of cells initially migrating against (top, n = 168) and towards (bottom, n=108) the higher gradient of the moderate gradient subset (n = 276). i) Average
CHAPTER 1
1.1 Introduction
The objectives of my research are 1) understanding the mechanics of chemokine-induced lymphocyte migration, manifest as changes in cell shape (morphodynamics); 2) understanding the haptotactic migration of lymphocytes in response to chemokine gradients; and 3) developing computational models to help explain lymphocyte migration behavior. A network of chemokines, such as CXCL12 and CXCL13, directs the trafficking and
localization of B and T lymphocytes in vivo, which are critical to the adaptive immune response. Currently, it is not feasible to study cell migration in response to chemokines in vivo, because chemokine concentration fields cannot be visualized in vivo, and the prospect of distinguishing the contributions of different chemokines to the overall response presents a major challenge. Therefore, studying the fundamentals of lymphocyte migration in vitro, in a controlled environment, is necessary to advance mechanistic understanding of the process. Towards that goal, our studies of lymphocyte migration on surfaces presenting chemokine gradients promise valuable insights and characterization of directed lymphocyte migration that might be extrapolated to more complex environments.
In this thesis, we investigated the chemokine-stimulated random and directed
migration of B and T cells and developed a computational model to help explain lymphocyte migration behavior. In the remainder of this chapter, the pertinent biology of chemokine signaling and lymphocyte migration is reviewed. Thereafter, in Chapter 2 we present our efforts to link the morphodynamics and directional persistence of random T-cell migration. In Chapter 3, we present a stochastic model and computational analysis of simulated T-cell morphodynamics and compare model predictions to statistics of random cell migration from experiments, and we explore simulations of gradient-directed T-cell migration. Although time and other constraints did not allow us to validate predictions related to T-cell haptotaxis, we did perform a morphodynamic analysis of B-cell random migration, and we analyzed the fidelity of B-cell haptotactic responses; this is presented in Chapter 4. Finally, Chapter 5 offers a summary of our conclusions and ideas about future work.
1.2 B and T Lymphocytes
lymphoid tissues are called lymphoid follicles. As B and T lymphocytes respond to antigen, lymphoid follicles expand and organize into germinal centers (GCs), in which the cells adapt their migratory behaviors and signaling specificities (8–10).
Fig. 1.1 Lymphocyte homing and recirculation. T and B lymphocytes shown include all subtypes. Ag: antigens.
1.3 Cellular Dynamics in Lymphocyte Migration 1.3.1 Integrins and chemokines in lymphocyte migration
Certain cell-surface receptors of the integrin family are expressed on the surface of lymphocytes and mediate adhesion to the extracellular matrix or attachment with other cells (11–13). Lymphocyte function-associated antigen-1 (LFA-1) binds to intercellular adhesion molecule-1 (ICAM-1) presented on the surface of other cells and initiates adhesion of T cells (14–16). Very late antigen-4 (VLA-4) is an integrin dimer that binds to vascular cell
adhesion molecule-1 (VCAM-1) and assists lymphocyte transmigration through the
LFA-1 and VLA-4 (LFA-19). In response to certain cues, integrins often undergo a conformation change before mediating stable adhesion, a process called inside-out signaling. According to this paradigm, chemokine stimulation elicits an increase in integrin affinity and thus induces cytoskeletal rearrangement, cell polarization, and cell migration (Fig. 1.2) (20, 21).
Fig. 1.2 Chemokine-dependent activation of LFA-1.
1.3.2 Cytoskeletal dynamics in lymphocyte migration
Fig. 1.3 Mesenchymal vs. amoeboid motility and chemotaxis.* The illustrations and table compare the structural and dynamic features of mesenchymal migration with those of amoeboid cells such as neutrophils and lymphocytes.
1.4 Chemokine Network 1.4.1 Germinal center dynamics
Germinal centers (GCs) are developed lymphoid follicles that form in response to antigen stimulation, compacted with different types of lymphocytes. Two regions of a typical GC are distinguishable and are called the light zone (LZ) and the dark zone (DZ) (Fig. 1.4) (29). The LZ mainly contains T-helper cells, B cells, and follicular dendritic cells
(FDCs). FDCs are antigen-presenting cells that interact with T-helper cells. FDCs are also the main CXCL13-secreting cells in GCs, and they express ICAM-1; thus, they facilitate FDC-B-cell interactions (30). The DZ contains mostly B-cells undergoing proliferation and somatic hypermutation. B cells proliferating in the DZ are called centroblasts, in which CXCR4 (the receptor for CXCL12) is highly expressed. After transiting to the LZ, the centroblasts become centrocytes, as CXCR4 expression is lost. Centrocytes die unless they express the right antibodies that recognize the antigens presented by FDCs. The rescued centrocytes receive final signals from T-helper cells and become either antibody-secreting plasma cells or memory B cells responsible for long-term immunity (8–10).
1.4.2 Chemokine-directed lymphocyte localization in germinal centers
In GCs, there is no physical barrier or boundaries between the DZ and LZ; instead, the chemokine network organizes the localization of B and T cells (Fig. 1.4) (5, 7).
CXCL12, secreted by stromal cells, and CXCL13, mainly secreted by FDCs, are two widely studied GC chemokines. CXCL12 binds to the CXCR4 receptor expressed by centroblasts in the DZ and which is lacking in centrocytes in the LZ. It is thought that gradients of CXCL12 are directed towards the DZ, attracting proliferating centroblasts, mature plasma cells, and T-cells. CXCL13 binds to the CXCR5 receptor, and its gradient directs centrocytes from the DZ to the LZ as they lose CXCR4 expression and thus become unresponsive to CXCL12 (9, 10). The total picture of lymphocyte dynamics in GCs is far more complicated than
differentiation. The involvement of T cells is the main difference between competing models (9, 32). We argue that more data is needed to inform such models, and that studying the characteristics of T- and B-cell migration in vitro can provide mechanistic insights that in vivo studies of lymphocyte trafficking presently cannot.
Fig. 1.4 Germinal center dynamics.* B and T lymphocyte localization in the germinal center orchestrated by CXCL12 and CXCL13 gradients established by chemokine-secreting
follicular dendritic cells (FDCs) and stromal cells (SCs). CXCR4 and CXCR5 expression is illustrated qualitatively by the corresponding symbols. LZ: light zone; DZ: dark zone.
1.5 References
1. Weiger, M.C., S. Ahmed, E.S. Welf, and J.M. Haugh. 2010. Directional Persistence of Cell Migration Coincides with Stability of Asymmetric Intracellular Signaling.
Biophys. J. 98: 67–75.
2. Andrew, N., and R.H. Insall. 2007. Chemotaxis in shallow gradients is mediated independently of PtdIns 3-kinase by biased choices between random protrusions. Nat. Cell Biol. 9: 193–200.
3. Butcher, E.C., and L.J. Picker. 1996. Lymphocyte homing and homeostasis. Science. 272: 60–66.
4. Springer, T.A. 1994. Traffic signals for lymphocyte recirculation and leukocyte emigration: the multistep paradigm. Cell. 76: 301–314.
5. Moser, B., and L. Ebert. 2003. Lymphocyte traffic control by chemokines: follicular B helper T cells. Immunol. Lett. 85: 105–112.
6. Brandes, M. 2000. Activation-dependent modulation of B lymphocyte migration to chemokines. Int. Immunol. 12: 1285–1292.
7. Ebert, L.M., P. Schaerli, and B. Moser. 2005. Chemokine-mediated control of T cell traffic in lymphoid and peripheral tissues. Mol. Immunol. 42: 799–809.
8. Allen, C.D.C., K.M. Ansel, C. Low, R. Lesley, H. Tamamura, N. Fujii, and J.G. Cyster. 2004. Germinal center dark and light zone organization is mediated by CXCR4 and CXCR5. Nat. Immunol. 5: 943–952.
9. Allen, C.D.C., T. Okada, and J.G. Cyster. 2007. Germinal-center organization and cellular dynamics. Immunity. 27: 190–202.
10. Gatto, D., and R. Brink. 2010. The germinal center reaction. J. Allergy Clin. Immunol. 126: 898–907.
11. Meerschaert, J., and M.B. Furie. 1995. The adhesion molecules used by monocytes for migration across endothelium include CD11a/CD18, CD11b/CD18, and VLA-4 on monocytes and ICAM-1, VCAM-1, and other ligands on endothelium. J. Immunol. Baltim. Md 1950. 154: 4099–4112.
12. Peled, A., O. Kollet, T. Ponomaryov, I. Petit, S. Franitza, V. Grabovsky, M.M. Slav, A. Nagler, O. Lider, R. Alon, D. Zipori, and T. Lapidot. 2000. The chemokine SDF-1 activates the integrins LFA-1, VLA-4, and VLA-5 on immature human CD34(+) cells: role in transendothelial/stromal migration and engraftment of NOD/SCID mice. Blood. 95: 3289–3296.
13. Van Seventer, G.A., H.J. Salmen, S.F. Law, G.M. O’Neill, M.M. Mullen, A.M. Franz, S.B. Kanner, E.A. Golemis, and J.M. van Seventer. 2001. Focal adhesion kinase
14. Porter, J.C., and N. Hogg. 1997. Integrin cross talk: activation of lymphocyte function-associated antigen-1 on human T cells alters alpha4beta1- and alpha5beta1-mediated function. J. Cell Biol. 138: 1437–1447.
15. Marazuela, M., A.A. Postigo, A. Acevedo, F. Díaz-González, F. Sanchez-Madrid, and M.O. de Landázuri. 1994. Adhesion molecules from the LFA-1/ICAM-1,3 and VLA-4/VCAM-1 pathways on T lymphocytes and vascular endothelium in Graves’ and Hashimoto’s thyroid glands. Eur. J. Immunol. 24: 2483–2490.
16. Oppenheimer-Marks, N., L.S. Davis, D.T. Bogue, J. Ramberg, and P.E. Lipsky. 1991. Differential utilization of ICAM-1 and VCAM-1 during the adhesion and
transendothelial migration of human T lymphocytes. J. Immunol. Baltim. Md 1950. 147: 2913–2921.
17. Van Dinther-Janssen, A.C., E. Horst, G. Koopman, W. Newmann, R.J. Scheper, C.J. Meijer, and S.T. Pals. 1991. The VLA-4/VCAM-1 pathway is involved in lymphocyte adhesion to endothelium in rheumatoid synovium. J. Immunol. Baltim. Md 1950. 147: 4207–4210.
18. Hyun, Y.-M., H.-L. Chung, J.L. McGrath, R.E. Waugh, and M. Kim. 2009. Activated Integrin VLA-4 Localizes to the Lamellipodia and Mediates T Cell Migration on VCAM-1. J. Immunol. 183: 359–369.
19. Lo, C.G., T.T. Lu, and J.G. Cyster. 2003. Integrin-dependence of lymphocyte entry into the splenic white pulp. J. Exp. Med. 197: 353–361.
20. Morin, N.A., P.W. Oakes, Y.-M. Hyun, D. Lee, Y.E. Chin, M.R. King, T.A. Springer, M. Shimaoka, J.X. Tang, J.S. Reichner, and M. Kim. 2008. Nonmuscle myosin heavy chain IIA mediates integrin LFA-1 de-adhesion during T lymphocyte migration. J. Exp. Med. 205: 195–205.
21. Arana, E., N.E. Harwood, and F.D. Batista. 2008. Regulation of integrin activation through the B-cell receptor. J. Cell Sci. 121: 2279–2286.
22. Jacobelli, J., F.C. Bennett, P. Pandurangi, A.J. Tooley, and M.F. Krummel. 2009. Myosin-IIA and ICAM-1 Regulate the Interchange between Two Distinct Modes of T Cell Migration. J. Immunol. 182: 2041–2050.
23. Ryan, G.L., N. Watanabe, and D. Vavylonis. 2012. A review of models of fluctuating protrusion and retraction patterns at the leading edge of motile cells. Cytoskeleton. 69: 195–206.
25. Laevsky, G., and D.A. Knecht. 2003. Cross-linking of actin filaments by myosin II is a major contributor to cortical integrity and cell motility in restrictive environments. J. Cell Sci. 116: 3761–3770.
26. Wessels, D., D.F. Lusche, P.A. Steimle, A. Scherer, S. Kuhl, K. Wood, B. Hanson, T.T. Egelhoff, and D.R. Soll. 2012. Myosin heavy chain kinases play essential roles in Ca2+, but not cAMP, chemotaxis and the natural aggregation of Dictyostelium discoideum. J. Cell Sci. 125: 4934–4944.
27. Bosgraaf, L., and P.J.M. van Haastert. 2006. The regulation of myosin II in Dictyostelium. Eur. J. Cell Biol. 85: 969–979.
28. Heid, P.J., D. Wessels, K.J. Daniels, D.P. Gibson, H. Zhang, E. Voss, and D.R. Soll. 2004. The role of myosin heavy chain phosphorylation in Dictyostelium motility, chemotaxis and F-actin localization. J. Cell Sci. 117: 4819–4835.
29. Mountz, J.D., J.H. Wang, S. Xie, and H.-C. Hsu. 2011. Cytokine regulation of B-cell migratory behavior favors formation of germinal centers in autoimmune disease. Discov. Med. 11: 76–85.
30. Goval, J.-J., R. Greimers, J. Boniver, and L. de Leval. 2006. Germinal center dendritic cells express more ICAM-1 than extrafollicular dendritic cells and ICAM-1/LFA-1 interactions are involved in the capacity of dendritic cells to induce PBMCs
proliferation. J. Histochem. Cytochem. Off. J. Histochem. Soc. 54: 75–84. 31. Hsu, H.-C., P. Yang, J. Wang, Q. Wu, R. Myers, J. Chen, J. Yi, T. Guentert, A.
Tousson, A.L. Stanus, T.L. Le, R.G. Lorenz, H. Xu, J.K. Kolls, R.H. Carter, D.D. Chaplin, R.W. Williams, and J.D. Mountz. 2008. Interleukin 17-producing T helper cells and interleukin 17 orchestrate autoreactive germinal center development in autoimmune BXD2 mice. Nat. Immunol. 9: 166–175.
32. Meyer-Hermann, M., E. Mohr, N. Pelletier, Y. Zhang, G.D. Victora, and K.-M.
CHAPTER 2
Linking Morphodynamics and Directional Persistence of T Lymphocyte Migration*
* Adapted from Liu, X., E. S. Welf, and J. M. Haugh. “Linking Morphodynamics and
2.1 Introduction
T lymphocytes are essential players in adaptive immune responses to infection, and the orchestrated, directed migration of these cells into targeted tissues and their recirculation are required for their functional responses (1). Chemokines play a central role in directing T-cell trafficking by establishing tissue-specific “address codes” that guide the lymphocytes to the proper sites (2). Accordingly, chemokines synergize with adhesive ligands to promote migration of isolated, naïve T cells (3). The chemokine CXCL12 (or stromal cell-derived factor-1, SDF-1) is recognized by the G protein-coupled chemokine receptor, CXCR4, which mediates chemotactic responses of T cells and also naïve B lymphocytes. Accordingly, CXCL12/CXCR4 signaling is critical for T-cell development in the thymus and T-cell trafficking into secondary lymphoid tissues (lymph nodes and spleen) (1). Within those tissues, CXCL12 further guides lymphocyte movements and is especially important in the dynamics of germinal centers (4–6).
Lymphocyte function-associated antigen-1 (LFA-1) is a heterodimeric adhesion receptor of the integrin family that is abundantly expressed on the surface of T lymphocytes; it mediates lymphocyte adhesion to the extracellular matrix and to other cells (7–9). LFA-1 engages intercellular adhesion molecule-1 (ICAM-1/CD54) molecules displayed by other cells, initiating cell-cell adhesion and immune synapse formation (3, 9). However, LFA-1 is maintained in a low-affinity state in the absence of chemokine stimulation. Inside-out signaling from active chemokine receptors to LFA-1 is required before integrin-mediated outside-in signaling can be activated (12, 13). Subsequent rearrangement of the
myosin-dependent contraction at the rear, result in cell polarization and locomotion (14). Studies have revealed a key role for Myosin IIA in detachment of LFA-1 adhesions and tail retraction in T cells (15). More recent evidence suggests further that Myosin IIA and LFA-1 functions are integrated, manifest as distinct T-cell migration modes described as walking and sliding. Walking is characterized by fast migration and loose/sporadic adhesion to the surface, whereas sliding is characterized by slower migration and more extensive and continuous cell contact (16).
T-cell migration elicited by CXCL12 and other chemokines has been widely studied, yet most studies have focused on the result of migration rather than the mechanics of the process. Characterization of the cells’ morphodynamics, i.e., how the shape of a cell changes during migration, lends direct insight into the statistics of cell centroid translocation and potentially about the coordination of F-actin polymerization and myosin contractility.
In this study, we used total internal reflection fluorescence (TIRF) microscopy to illuminate the contact areas of primary T cells as they crawled on surfaces with immobilized CXCL12 and ICAM-1. We show that mouse T-cell migration is characterized by frequent bifurcation of the leading edge. Of the two protruding extensions generated by each
2.2 Results
2.2.1 T lymphocyte migration is characterized by bifurcation of the lamellipodium at the cell’s leading edge
TIRF microscopy was used to monitor a cohort of 38 primary, murine (naïve) T lymphocytes as they migrated randomly on surfaces with immobilized ICAM-1 and the chemokine, CXCL12/SDF-1. Analysis of these high-resolution data by morphodynamic mapping (17, 18) elucidates changes in the shape of the contact area during T-cell crawling. The primary characteristic of these dynamics was found to be the bifurcation, or lateral branching, of the protruding leading edge into two distinct lobes. As shown for a
representative sequence, the dominance of one branch over the other results in a change in the direction of overall cell migration (Fig. 2.1A). This phenomenon is depicted on the morphodynamic map (Fig. 2.1B) as follows. Pixels associated with the two protruding lobes are marked as structures that are morphologically extended from the cell body (17), as are the pixels associated with the uropod in the rear (black dots). These structures are distinguished by overlaying edge velocity data, with protrusion and retraction marked by red and blue hues, respectively. The map also shows changes in the direction of cell centroid translocation (green dots; Fig. 2.1B). Thus, the map shows the bifurcation and wave-like separation of the protruding lobes during the first 30 seconds of the sequence; thereafter, the dominant lobe accelerates its protrusion while the other comes to rest, accompanied by a shift in
but the angular position of this movement relative to the centroid shifts with time (compare Fig. 2.1A&B).
Figure 2.1 T lymphocyte migration is characterized by bifurcation of protrusions at the leading edge. a) Representative TIRF montage of a murine T cell executing a turn by bifurcation of the leading edge. The arrowheads mark morphological extensions that are protruding (red), retracting (blue), or stationary (gray). Scale bar = 10 µm. b)
Morphodynamic map of the sequence depicted in a. Pixels associated with structures that are morphologically extended from the cell body are marked as black dots overlaid with edge velocity data, with protrusion and retraction marked by red and blue hues, respectively. The map also shows changes in the direction of cell centroid translocation (green dots). c) TIRF montage showing an uncommon instance of a T cell abruptly changing migration polarity. Extensions are labeled as in a. Scale bar = 10 µm. d) Morphodynamic map of the sequence depicted in c, constructed as in b.
2.2.2 T lymphocyte migration directionality is determined by the fates of extensions formed by bifurcation of the leading edge
the cells’ directional persistence. For extended periods of random migration, the
spatiotemporal maps show frequent branching of extending protrusions at the leading edge and relatively smooth retraction of the cell rear (representative cell depicted in Fig. 2.2A). T cells migrated rapidly (average speed = 7.9 mm/min), with directionality shifting in
alignment with the dominant protrusion. As a result, the cells typically exhibited frequent changes in direction, even while cell directionality exhibits persistence (i.e., remains correlated) over a somewhat longer time scale (Fig. 2.2A, green dots). The overlaid cell outlines exemplify how the cells actively changed shape and executed sharp turns during random migration (Fig. 2.2B). To relate turning behavior to leading-edge branching, we documented the approximate time interval during which each branching event occurred (Fig. 2.2C) along with the fates of the two protrusions that were formed (Fig. 2.2D); with regard to the latter, we noted 1) whether the dominant protrusion extended to the left or to the right of the apparent migration axis and 2) whether the abandoned extension persisted and merged with the uropod or was retracted. This information is depicted along with the path of the cell centroid as a graph (Fig. 2.2D), in which each branching event is marked by a pair of
Figure 2.2 T lymphocyte migration directionality is determined by the fates of extensions formed by bifurcation of the leading edge. a) Morphodynamic maps of a representative migrating cell. Left: pixels associated with structures that are morphologically extended from the cell body are marked as black dots. Center: edge velocity data, with protrusion and retraction marked by red and blue hues, respectively. Right: Overlay of the morphology and protrusion maps, also showing changes in the direction of cell centroid translocation (green dots). b) Stacked outlines of the cell depicted in a. Blue is the initial time point; red the end. Large-scale turning events are labeled with times as indicated. Scale bar = 10 µm. c)
2.2.3 Lamellipodial bifurcation is rapid compared with cell movement and shows temporal characteristics of a spontaneous process
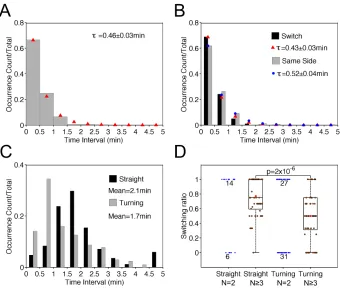
Having established the nature of the morphodynamics, we sought to characterize the process of protrusion bifurcation across the T-cell cohort in more quantitative terms. The waiting times between successive branching events were determined by inspection of the morphodynamic maps, within time intervals of 0.5 min (from experience, the limit of resolution for a manual estimate). The normalized waiting-time distribution (WTD) is presented as a histogram and compared with that of a spontaneous, memoryless process, i.e., an expontential distribution (Fig. 2.3A). The fit of the distribution is good, with a theoretical mean t = 0.66 min. The experimental data set showed a subtle but noticeable deviation from the fit for the 0.5-1 min bin, suggesting that a statistical model with more parameters might be needed to fully describe the data. Consistent with this view, we found a significant difference between the WTDs for successive bifurcation events that favored the same side of the migration axis (τ = 0.82 min) versus those where the dominant protrusion switched sides (τ = 0.55 min) (Fig. 2.3B); we also note that there is a modest bias towards switching
(264/488 = 54%). These results suggest that the fates of bifurcated lamellipodia are not entirely random, and that there might be distinct states of the migrating T cell associated with its tendencies to turn.
observation (Fig. 2.3C). Our interpretation is that the fast time scale is associated with leading-edge bifurcation and reflects the rapid shifts in cell centroid position seen in protrusion maps (e.g., Fig. 2.2A), whereas the slower time scale (>2 min) reflects the
directional persistence of the overall translocation process. As a point of comparison, we fit the mean squared cell centroid displacement as a function of time interval to a persistent random walk model (39) (Fig. 2.3D). The best-fit value of the persistence time is 2.5 min, comparable to the time scale of the slower decay of the autocorrelation coefficient.
Figure 2.3 Lamellipodial bifurcation is rapid compared with cell movement. a) Normalized waiting-time distribution (WTD) for pairs of consecutive bifurcation events (n = 488). The red symbols are the corresponding best-fit values assuming an exponential distribution. The inset shows the semi-logarithmic plot of the same data set. b) WTDs for bifurcation pairs where the two dominant protrusions were on different sides of the migration axis (switch) (n = 264) or on the same side (n = 224). The corresponding exponential fit values are indicated by red and blue symbols, respectively. The inset shows the semi-logarithmic plots of the switch (red) and same-side (blue) data. c) The autocorrelation coefficient of the cell movement vector as a function of the time lag. The gray region indicates the 95%
2.2.4 Periods of T lymphocyte migration persistence/turning are associated with distinct leading-edge bifurcation tendencies
Taken together, the analysis presented thus far suggests that mouse T cells execute sharp turns when bifurcation of the leading edge favors clockwise/counterclockwise
movement, i.e., with the dominant branch consistently on the right/left of the migration axis. The converse argument is that the cells must alternate the orientation of the dominant
protrusion to maintain persistent motion. To show this, we first identified periods of straight migration (n = 84) and turning (n = 157) based on the patterns visible in the cells’
morphodynamic maps (Fig. 2.4A&B). Consistent with the WTD analysis described above, the temporal resolution was chosen as 0.5 min. For each period, the displacement-over-traveled distance (D/T) ratio of the centroid path was calculated as a measure of its
directional persistence (Fig. 2.4C, inset), and the distributions of D/T values for straight and turning periods were compared (Fig. 2.4C). As expected, the analysis confirms that the D/T persistence values for the turning group are significantly lower. The durations of the straight and turning periods show non-exponential distributions, indicating a degree of memory (Fig. 2.4D). Consistent with that notion, the average durations of straight (2.1 min) and turning periods (1.8 min) are much longer than the estimated waiting time between bifurcation events and comparable to the estimated persistence time of 2.5 min. These distributions are
For straight and turning periods with at least two bifurcation events, we considered all pairs of consecutive bifurcation events and calculated the fraction of pairs that switched sides of the migration axis (left-right or right-left) for each period (Fig. 2.4F). Consistent with our hypothesis, the switching fraction of the straight group is significantly higher than that of the turning group, as shown for periods with at least three (two pairs of) bifurcations (Fig. 2.4F, green dots). In both groups, there are also many periods with only two branches, for which the switching fraction is either 1 or 0; among these, values of 1/0 are enriched in the
Figure 2.4 Persistent and turning migration states are associated with switching and same-side bifurcations. a&b) Morphodynamic maps of representative straight (a) and turning (b) migration periods. Green dots indicate the cell centroid track. c) Distributions of
2.3 Discussion
The conceptualization of cell turning as a competition between the two sides of the leading edge is decades old (20) and has been refined by more recent experimental
observations for different cell types (21, 22). This work characterizes the morphodynamics of murine T-cell migration in relation to turning behavior that affects directional persistence. On a surface coated uniformly with CXCL12 and ICAM-1, T lymphocyte migration is marked by bifurcation of the cell front, with turning determined by the dominance of one of the protrusions thusly formed. Analysis of this process revealed that, although leading-edge bifurcation occurs with a characteristic frequency, the determination of the dominant
protrusion is not random. Rather, the evidence suggests that control of leading-edge bifurcation manifests as two distinct turning states: one that favors a persistent, straight migration path and the other that favors large-scale turns. The characteristics of these turning states are unrelated to the walking and sliding modes of T-cell migration previously reported, which were distinguished based on cell speed and adhesion (16). Our surfaces were coated with high ICAM-1 concentration, promoting stable cell adhesion. Therefore, the continuous T-cell contact areas we recorded and analyzed match the description of sliding cells. A more complete conceptual model of T-cell locomotion should consider both the ‘translational’ and ‘rotational’ aspects of movement and how they vary as a function of the cell’s
microenvironment.
alternating branch directions (23–25). There are also marked differences between the two cell types. Morphologically, D. discoideum cells crawl by elongation of pseudopods from which new pseudopods split off at approximately a 60-degree angle (24), whereas leading-edge bifurcations in T cells occur more frequently (relative to cell speed) and form less pronounced extensions that separate from one another laterally. These features are not readily resolved using standard fluorescence microscopy; our analysis was enabled by TIRF microscopy. Further, the turning state whereby T cells execute a series of pivots on the same side of the migration axis, has not been described in randomly migrating D. discoideum; in that context, turning is attributed to de novo formation of pseudopods in random directions (24).
2.4 Materials & Methods
2.4.1 Cell culture and preparation
magnetic selection. The unbound T-cells in the supernatant were collected and re-suspended in T-cell culture medium at 2x10⁶ cells/ml. T cells were then transferred to 100mm cell culture dish and kept in 37oC, 5% CO2 cell culture incubator for the length of the tests without changing medium. The cells were collected for tests 24 h and 48 h after isolation. All tissue culture reagents were purchased from Invitrogen unless otherwise indicated.
2.4.2 T-cell migration assay surface preparation
Glass-bottom dishes (MatTek) were coated first with 10 µg/ml Protein A (Invitrogen) and 5 µg/ml chemokine CXCL12-his at room temperature for 2 h. The surfaces were washed once with 1% mass per volume BSA (Sigma) in PBS. Then 5 µg/ml human or mouse ICAM-1/CD54 Fc chimera (R&D Systems) was added and incubated at room temperature for 2 h. The surfaces were washed once and blocked with 1% mass per volume BSA in PBS at 4oC overnight. The surfaces were washed with warm migration medium (phenol red-free RPMI1640, 1% mass per volume BSA) before adding cells. CXCL12-his was kindly
provided by the laboratory of William Reichert (Duke University). It was confirmed that the observed biological activity of CXCL12-his was comparable to commercially available CXCL12.
2.4.3 Random migration assay
incubated at 37oC for 2 minutes and then washed with migration medium. The cells rested for 10 minutes prior to seeding. Approximately 2.5x10⁵ cells were added onto the migration surface and allowed to adhere for 5 minutes at 37oC. The cells were imaged by prism-based total internal reflection fluorescence (TIRF) microscopy at 37°C in a humidified chamber. Images were acquired at a rate of 20 frames/min with a 40X, 0.8 NA Achroplan water-dipping objective (Carl Zeiss), ORCA-ER cooled charge-coupled device (Hamamatsu Photonics), and MetaMorph software (Universal Imaging).
2.4.4 Computational image analysis
2.4.5 Waiting-time distributions
The waiting time and lifetime of each phenotypic event were manually documented with a temporal resolution of 0.5 minute. To compare the waiting time distribution to that of a random process, we assessed the quality of fit to an exponential distribution, i.e., the probability density function (PDF) as follows.
(1) The probability that an event occurs between times t and t+ Dt is found by integrating the PDF.
(2) Considering that the actual waiting time between events detected, for example, during successive detection periods varies between zero and 2Dt, the expected probability of
detecting events during the nth interval is as follows.
(3)
We also consider the expected portion of the probability associated with missing those events that occur within the same period of observation as follows.
(4) p(t)=1
τ exp(−t τ)
P= p(t!)dt!
t t+Δt
∫
=e−tτ
−e−(t+Δt)τ
=e−tτ 1
−e−Δtτ
(
)
Pavg,n=
1 2 e
−(n−1)Δtτ
+e−nΔtτ
(
)
1−e−Δtτ(
)
=1 2e
−(n−1)Δtτ
1+e−Δtτ
(
)
1−e−Δtτ(
)
Pmissed=
1
2 1−e
−Δtτ
Thus, we confirm the validity of Eq. 2 as the correct probability, posed as follows for the nth interval, with Dt = 0.5 minute.
(5)
All fits were obtained using the curve fitting toolbox of MATLAB.
2.4.6 Persistent random walk model
The mean square displacement, <d2>, was calculated for varying time intervals Dt. The trend was fit to the common persistent random walk model (26) as follows.
d2
=2S2
P Δt−P 1−e−Δt P
(
)
#
$ %& (6)
The fit parameters are the speed S and persistence time P. The fit was obtained using the curve fitting toolbox of MATLAB.
2.5 References
1. Campbell, D.J., C.H. Kim, and E.C. Butcher. 2003. Chemokines in the systemic organization of immunity. Immunol. Rev. 195: 58–71.
2. Ebert, L.M., P. Schaerli, and B. Moser. 2005. Chemokine-mediated control of T cell traffic in lymphoid and peripheral tissues. Mol. Immunol. 42: 799–809.
3. Stachowiak, A.N., Y. Wang, Y.-C. Huang, and D.J. Irvine. 2006. Homeostatic
lymphoid chemokines synergize with adhesion ligands to trigger T and B lymphocyte chemokinesis. J. Immunol. Baltim. Md 1950. 177: 2340–2348.
4. Kaizuka, Y., A.D. Douglass, R. Varma, M.L. Dustin, and R.D. Vale. 2007. Mechanisms for segregating T cell receptor and adhesion molecules during immunological synapse formation in Jurkat T cells. Proc. Natl. Acad. Sci. 104: 20296–20301.
Pn=
Pavg,n 1−Pmissed
=e−(n−1)Δtτ 1
−e−Δtτ
5. Moser, B., and L. Ebert. 2003. Lymphocyte traffic control by chemokines: follicular B helper T cells. Immunol. Lett. 85: 105–112.
6. Allen, C.D.C., K.M. Ansel, C. Low, R. Lesley, H. Tamamura, N. Fujii, and J.G. Cyster. 2004. Germinal center dark and light zone organization is mediated by CXCR4 and CXCR5. Nat. Immunol. 5: 943–952.
7. Meerschaert, J., and M.B. Furie. 1995. The adhesion molecules used by monocytes for migration across endothelium include CD11a/CD18, CD11b/CD18, and VLA-4 on monocytes and ICAM-1, VCAM-1, and other ligands on endothelium. J. Immunol. Baltim. Md 1950. 154: 4099–4112.
8. Peled, A., O. Kollet, T. Ponomaryov, I. Petit, S. Franitza, V. Grabovsky, M.M. Slav, A. Nagler, O. Lider, R. Alon, D. Zipori, and T. Lapidot. 2000. The chemokine SDF-1 activates the integrins LFA-1, VLA-4, and VLA-5 on immature human CD34(+) cells: role in transendothelial/stromal migration and engraftment of NOD/SCID mice. Blood. 95: 3289–3296.
9. Van Seventer, G.A., H.J. Salmen, S.F. Law, G.M. O’Neill, M.M. Mullen, A.M. Franz, S.B. Kanner, E.A. Golemis, and J.M. van Seventer. 2001. Focal adhesion kinase
regulates beta1 integrin-dependent T cell migration through an HEF1 effector pathway. Eur. J. Immunol. 31: 1417–1427.
10. Porter, J.C., and N. Hogg. 1997. Integrin cross talk: activation of lymphocyte function-associated antigen-1 on human T cells alters alpha4beta1- and alpha5beta1-mediated function. J. Cell Biol. 138: 1437–1447.
11. Marazuela, M., A.A. Postigo, A. Acevedo, F. Díaz-González, F. Sanchez-Madrid, and M.O. de Landázuri. 1994. Adhesion molecules from the LFA-1/ICAM-1,3 and VLA-4/VCAM-1 pathways on T lymphocytes and vascular endothelium in Graves’ and Hashimoto’s thyroid glands. Eur. J. Immunol. 24: 2483–2490.
12. Hogg, N., I. Patzak, and F. Willenbrock. 2011. The insider’s guide to leukocyte integrin signalling and function. Nat. Rev. Immunol. 11: 416–426.
13. Morin, N.A., P.W. Oakes, Y.-M. Hyun, D. Lee, Y.E. Chin, M.R. King, T.A. Springer, M. Shimaoka, J.X. Tang, J.S. Reichner, and M. Kim. 2008. Nonmuscle myosin heavy chain IIA mediates integrin LFA-1 de-adhesion during T lymphocyte migration. J. Exp. Med. 205: 195–205.
15. Smith, A., M. Bracke, B. Leitinger, J.C. Porter, and N. Hogg. 2003. LFA-1-induced T cell migration on ICAM-1 involves regulation of MLCK-mediated attachment and ROCK-dependent detachment. J. Cell Sci. 116: 3123–3133.
16. Jacobelli, J., F.C. Bennett, P. Pandurangi, A.J. Tooley, and M.F. Krummel. 2009. Myosin-IIA and ICAM-1 Regulate the Interchange between Two Distinct Modes of T Cell Migration. J. Immunol. 182: 2041–2050.
17. Welf, E.S., S. Ahmed, H.E. Johnson, A.T. Melvin, and J.M. Haugh. 2012. Migrating fibroblasts reorient directionality by a metastable, PI3K-dependent mechanism. J. Cell Biol. 197: 105–114.
18. Machacek, M., and G. Danuser. 2006. Morphodynamic profiling of protrusion phenotypes. Biophys. J. 90: 1439–1452.
19. Weiger, M.C., S. Ahmed, E.S. Welf, and J.M. Haugh. 2010. Directional Persistence of Cell Migration Coincides with Stability of Asymmetric Intracellular Signaling.
Biophys. J. 98: 67–75.
20. Tranquillo, R.T., D.A. Lauffenburger, and S.H. Zigmond. 1988. A stochastic model for leukocyte random motility and chemotaxis based on receptor binding fluctuations. J. Cell Biol. 106: 303–309.
21. Arrieumerlou, C., and T. Meyer. 2005. A local coupling model and compass parameter for eukaryotic chemotaxis. Dev. Cell. 8: 215–227.
22. Van Haastert, P.J.M. 2010. A stochastic model for chemotaxis based on the ordered extension of pseudopods. Biophys. J. 99: 3345–3354.
23. Andrew, N., and R.H. Insall. 2007. Chemotaxis in shallow gradients is mediated independently of PtdIns 3-kinase by biased choices between random protrusions. Nat. Cell Biol. 9: 193–200.
24. Bosgraaf, L., and P.J.M. Van Haastert. 2009. The ordered extension of pseudopodia by amoeboid cells in the absence of external cues. PloS One. 4: e5253.
25. Driscoll, M.K., C. McCann, R. Kopace, T. Homan, J.T. Fourkas, C. Parent, and W. Losert. 2012. Cell shape dynamics: from waves to migration. PLoS Comput. Biol. 8: e1002392.
CHAPTER 3
Computational Modeling of T Lymphocyte Random and Directed Migration*
3.1 Introduction
As described in Chapter 2, chemokine-stimulated T-cell migration is characterized by frequent bifurcations of the cell’s leading edge. The migration directionality is determined by the dominance of the protrusions thusly formed. T-cell migration apparently exhibits distinct states, one favoring a persistent, straight migration path and the other favoring large-scale turns. Statistical analyses suggested that the migration states have a distinct (longer) time scale than that of branching, providing an impetus for computational modeling to understand the underlying mechanism; moreover, we sought to predict how T-cell migration might be biased by chemokine gradients.
leading edge (7, 10, 11). In theory, such local inhibition/regulation may be important for the cell to track a non-stationary spatial cue (7).
To simulate T-cell chemotaxis, two elements 1) gradient establishment and 2) ligand-receptor binding reactions need to be incorporated into random migration model. Ligand gradient generation has been well established since Crick’s study in 1970 (12). Source-sink reactions are widely implemented in different models to simulate both linear and non-linear ligand gradients (13, 14). Previous studies showed that chemokine signaling in T cells involves not only the chemokine-receptor binding but also the co-stimulation of the T cell receptor (TCR) pathway (15, 16). It has been shown that the initiation of TCR signaling requires F-actin remodeling (17). Active LFA-1, which binds to ICAM-1 with high affinity and mediates cell adhesion and migration, is also an indispensible element in chemokine signaling (18, 19). The activation of the integrin LFA-1 is promoted by the F-actin network (20). The evidences suggest that there is an extra activation step following the chemokine-receptor binding to initiate the downstream signaling and the activation potentially by the signaling through TCR, LFA-1, etc. is associated with the F-actin network.
(poison) from active receptor-based to F-actin barbed end-based. The modified random migration model generates similar results to the previous model. The modified directed migration model output showed consistent chemotactic responses to different chemokine gradient profiles.
3.2 Results
3.2.1 A computational model based on plausible feedback mechanisms can explain lamellipodial bifurcation and T-cell migration states
To describe the dynamics of F-actin polymerization underlying the membrane protrusion phenomena exhibited by T cells, we formulated a spatiotemporal, stochastic model in which species of molecules or molecular assemblies are treated as Brownian particles, and transformations occur probabilistically (Fig. 3.1A) (21). In the model, F-actin barbed ends proliferate by branching in an autocatalytic fashion, facilitated by a hypothetical signaling pathway upstream of the Arp2/3 complex (6). Protrusion of the leading edge in turn promotes activation of the signaling pathway, e.g. by promoting new interactions
Stochastic simulations of this model with a two-dimensional disk geometry confirm that the proposed circuit is capable of forming F-actin domains that readily bifurcate and move laterally away from each other (Fig. 3.1B). On the periodic boundary, however, the two domains most often coalesce on the other side, or in some instances their waves become entrained, consistent with deterministic calculations for related models (11).
A key aspect of leukocyte migration that is missing from the model described above is the polarity of the cell. Hence, we added to the model a parallel wave-pinning model that defines the cell rear, in which F-actin domains are destroyed due to myosin II-imposed contractility. Conversely, the model includes a mechanism acting over an intermediate spatial range by which F-actin domains inhibit the rear. The point of this feature of the model is not to impose the concept of opposing frontness and backness pathways per se; rather, the intention was to emulate the jostling of the front and rear by whatever
mechanism(s), including mechanical tension (22). With this modification, model simulations show bifurcating F-actin domains that are at any given time restricted to one side of the boundary (Fig. 3.1C).
We next addressed whether distinct motility states of the types observed
Figure 3.1 A computational model can explain lamellipodial bifurcation and T-cell
migration states. a) Schematic of the major interactions in the stochastic model. b) Montage of a brief period of simulation during which an F-actin patch (green) bifurcates in the
3.2.2 Statistics of simulated F-actin dynamics show qualitative trends that match those of leading-edge bifurcation in migrating T cells
Although the purpose of our stochastic model is to provide conceptual hypotheses, statistics of the simulated dynamics are nonetheless comparable to those extracted from experiments. This is achieved by analysis of simulated ‘protrusion/retraction’ maps, where F-actin density and the cell rear in the simulations are considered proxies for protrusion and retraction, respectively (as illustrated in Fig. 3.1D). Consistent with the analysis shown in Fig. 2.3A&B, the normalized WTD of simulated F-actin bifurcations was close to
of the turning group (Fig. 3.2D). This analysis indicates that the computational model is not only capable of simulating the two types of bifurcation and turning behavior; it also
adequately describes the timescales associated with the shifting between states.