Copyright 0 1994 by the Genetics Society of America
Selection Intensity
for
Codon Bias
Daniel L. Hard,* Etsuko N. Moriyama”
and
Stanley A.
Sawyer’
*Department of Organismic and Evolutionary Biology, Harward University, Cambridge, Massachusetts 02138, and tDepartments of Mathematics and Genetics, Washington University, St. Louis, Missouri 63130
Manuscript received January 28, 1994 Accepted for publication May 20, 1994
ABSTRACT
The patterns of nonrandom usage of synonymous codons (codon bias) in enteric bacteria were ana- lyzed. Poisson random field (PRF’) theory was used to derive the expected distribution of frequencies of nucleotides differing from the ancestral state at aligned sites in a set of DNA sequences. This distribution was applied to synonymous nucleotide polymorphisms and amino acid polymorphisms in the gnd andputP genes of Escherichia coli. For the gnd gene, the average intensity of selection against disfavored synony- mous codons was estimated as approximately 7.3 X lo-’; this value is significantly smaller than the esti- mated selection intensity against selectively disfavored amino acids in observed polymorphisms (2.0 X
lo-’), but it is approximately of the same order of magnitude. The selection coefficients for optimal synonymous codons estimated from PRF theory were consistent with independent estimates based on codon usage for threonine and glycine. Across 118 genes in E . coli and Salmonella typhimurium, the distribution of estimated selection coefficients, expressed as multiples of the effective population size, has a mean and standard deviation of 0.5 5 0.4. No significant differences were found in the degree of codon bias between conserved positions and replacement positions, suggesting that translational misincorpo- ration is not an important selective constraint among synonymous polymorphic codons in enteric bacteria. However, across the first 100 codons of the genes, conserved amino acids with identical codons have significantly greater codon bias than that of either synonymous or nonidentical codons, suggesting that there are unique selective constraints, perhaps including mFWA secondary structures, in this part of the coding region.
P
ROTEIN-CODING sequences often have a nonran- dom usage of synonymous codons (GRANTHAM et al. 1980; IKEMURA 1981). In prokaryotes and unicellular eu- karyotes, the codon usage is usually biased toward an- ticodons present in the most abundant tRNA molecules( IKEMURA 1981; BENNETZEN and HALL 1982; GROSJEAN and FIERS 1982). These codons are regarded as “opti- mal.” It is not uncommon for optimal codons to con- stitute 70-90% of the codons in a gene, although codon bias is usually greater in genes that are highly expressed (IKEMURA 1985). Generally speaking, optimal codons are those with perfect Watson-Crick base pairing in the wobble position ( GROSJEAN and FIERS 1982).
Although codon bias is widespread, the nature and amount of selection acting on preferred codons is ob- scure. Based on the hypothesis that strong codon bias in highly expressed genes in enterobacteria results from selection for translational efficiency or speed of trans- lation, BULMER (1991) calculated that the selection co- effkient for optimal codons in a protein should be ap- proximately 1% of the relative abundance of the protein. The calculated value was at least three to four orders of magnitude greater than the selection coeffi- cient inferred from the proportion of optimal codons observed in two genes with known levels of expression in Escherichia coli, assuming an effective population size of
lo9
(BULMER 1991). Costs of translational proof- reading and translational misincorporation were alsoGenetics 1 3 8 227-234 (September, 1994)
considered and judged to be insufficient to account for the three to four orders of magnitude discrepancy
( BULMER 199 1).
To examine the selection intensity for optimal codon usage, we analyzed 14 DNA sequences of the gnd gene from natural isolates of E. coli. (The gnd gene codes for Gphosphogluconate dehydrogenase.) Using a model of polymorphisms as constituting a Poisson random field, we estimate that the selection intensity against non- optimal codons in the gnd gene is approximately one- third as great as that against amino acid replacements in the same gene. This estimate is consistent with that cal- culated from codon usage in gnd using BULMER’S (1991) method. Good agreement was also found between the two methods of estimation in the p u t P gene of E. coli, which codes for proline permease (NELSON and SELANDER 1992). Estimates of selection intensity based on codon usage were also calculated for a wide range of genes in E. coli and Salmonella typhimurium. For most genes, the estimate of the selection intensity for optimal codons lies in the range between one-tenth and two times that estimated for the gnd gene.
NUCLEOTIDE POLYMORPHISMS MODELED AS A
POISSON RANDOM FIELD
228 D. L. Hartl, E. N. Moriyama and S. A. Sawyer
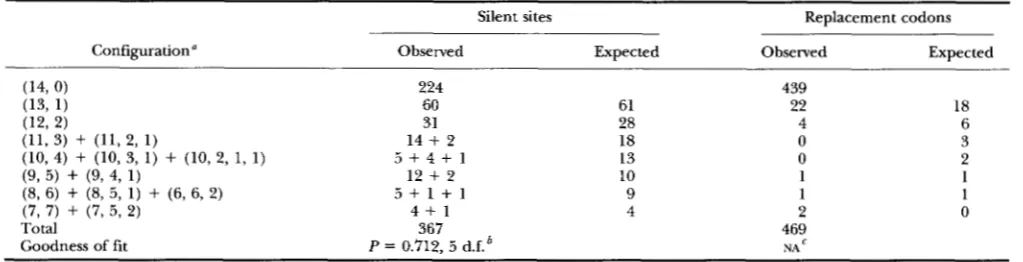
TABLE 1
Sample configurations of polymorphic nucleotides and amino acids
Configuration"
Silent sites Replacement codons
Observed Expected Obselved Expected
224 439
60 61 18 22
31 28 4 6
14
+
2 18 0 35 + 4 + 1 13 0 2
12
+
2 10 1 15 + 1 + 1 9 1 1
4 + 1 4 2 0
367 469
P = 0.712, 5 d.f.' NA
a The observed number of each configuration is tabulated separately in column 2 in the same order in which the configurations are listed in
column 1; there are 12 configurations with more than two nucleotides, each of which has been pooled with the two-nucleotide configuration having the same count of the consensus nucleotide.
'
d.f. = degrees of freedom.NA = not applicable because there are too many empty or sparse cells in the case of replacement codons to carry out a chi-square test. sider a sequence of nucleotides in a coding region. Be-
cause a polymorphic site becomes monomorphic when a nucleotide becomes fixed, and a monomorphic site becomes polymorphic when a new mutation arises at the site, the particular sites that are polymorphic may change over time. At any given time, for the ith nucle- otide site, let qi be the aggregate frequency in the popu- lation of all nucleotides other than the ancestral nucle- otide for which the site was most recently monomorphic. The expected density of a random field composed of the frequencies,
q,
of the nonancestral nucleotides at the different polymorphic sites has the equilibrium form (SAWYER and HARTL 1992).1 - e - 2 " d - q ) dq
q(1 - 4)
f ( q ; P , 7 ) = 2P 1 - (1)
for 0
<
q < 1, wherep
is the locus-wide mutation rate and y the selection coefficient of the nonancestral nucleoti- des, both expressed as a multiple of the haploid popu- lation size, N . Favorable mutations have y>
0 and det- rimental mutations have y<
0. Equation 1 is the expected density for a Poisson random field (PRF) of nucleotide frequencies for 0<
q<
1 (SAWYER and HARTL1992). WRIGHT (1938, 1969, p. 381) derived the same density as the transient distribution of the frequency of a single allele under irreversible mutation. Since Equa- tion l is the density of a random field rather than the distribution of a single random variable, it need not be normalizable. Indeed, it is not integrable at q = 0, which reflects that fact that the population always contains a large number of rare alleles that are destined to be lost. If the nonancestral nucleotides are subject to different selection coefficients at different sites, as will most likely be the case in practice, then an estimate of y from Equa- tion l would represent a kind of weighted average or a typical value from these selection coefflcients.
We analyzed the sequences of 14 alleles of the gnd gene present in natural isolates of E . coli (GenBank
Release 79.0) (DYKHUIZEN and GREEN 1991; BISERCIC et al. 1991). Each coding sequence has 1407 nucleotide sites, among which 224 are polymorphic in having at least one variant nucleotide at the site among the 14 alleles. The coding region includes 367 codons at which it would be possible to have synonymous or "silent" polymorphisms in the third position. (This tabulation excludes codons for leucine and arginine, which can have synonymous substitutions in the first codon position.) Among the 367 sites with possible silent polymorphisms, 143 are actually polymorphic. At the amino acid level, there are 30 amino acid polymorphisms among the aligned se- quences. The observed numbers of each of the sample configurations of the nucleotide and amino acid poly- morphisms are summarized in Table 1.
Among a set of n aligned nucleotide sequences, it fol- lows from Equation 1 that the expected number of sites with r nonancestral and n - r ancestral nucleotides has a Poisson distribution with mean
M ( r ; P, Y )
(1 5 r s n - 1)
Furthermore, under the assumptions of our model, the counts whose means are given by Equation 2 are inde- pendent Poisson random variables for r = 1, 2, 3, .
. .
,n - 1.
Selection Intensity 229
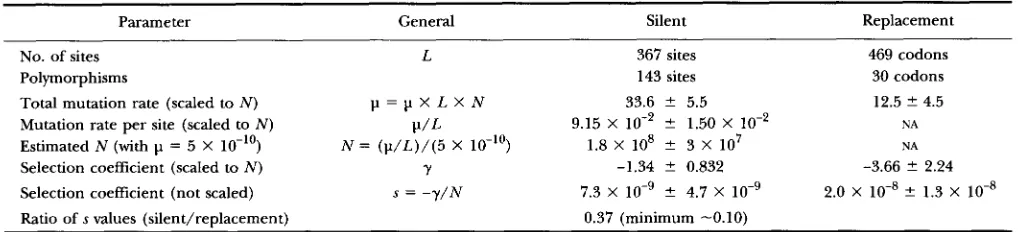
TABLE 2
Maximum likelihood estimates based on PRF model
Parameter General Silent Replacement
No. of sites L 367 sites 469 codons
Polymorphisms 143 sites 30 codons
Total mutation rate (scaled to N ) p = p X L X N 33.6 ? 5.5 12.5 ? 4.5
Mutation rate per site (scaled to N ) P/L 9.15 X lo-' ? 1.50 X 10" NA
Estimated N ( w i t h p = 5 X 10-lo) N = ( p / L ) / ( 5 X 10"') 1.8 X lo8 ? 3 X 10' NA
Selection coefficient (scaled to N ) Y -1.34 ? 0.832 -3.66 ? 2.24
Selection coefficient (not scaled) s = - y / N 7.3 X 1 0 - ~ ~ f - 4.7 X 1 0 - ~ 2.0 X lo-' ? 1.3 X IO-'
Ratio of s values (silent/replacement) 0.37 (minimum -0.10)
with mean
N(
r;p,
y ) = M ( r;p,
y )+
M ( n - r;p,
y) ifr < n - r a n d m e a n N ( r ; p , y ) = M ( n / 2 ; p , y ) i f r = n / 2 .
Note that this consolidation does not lose information about the sign of y, since Equation 2 is not preserved if
y is replaced by -7 even if q is also replaced by 1 - q. The asymmetry results from the fact that it is easier for posi- tively selected alleles to reach appreciable population frequencies than negatively selected alleles. In particu- lar, the random variables with means N( r;
p,
y) still con- tain information about the sign of y.In the gnd case, n = 14, and there are 131 silent poly- morphisms with only two segregating nucleotides. The gnd sequences also include 12 silent polymorphisms with three or more segregating nucleotides. In this case, combining M ( r; p, y ) for r and n - r is equivalent to assuming that the ancestral nucleotide is either the con- sensus in the sample or else the common ancestor of all the nonconsensus nucleotides currently segregating. (This special case does not apply to the 30 amino acid polymorphisms because there are no polymorphic amino acid sites with more than two amino acids at the site.)
Using the above conventions for specifjmg the an- cestral nucleotide, define n, to be the observed number of sites at which there are r nonancestral and n - r an- cestral nucleotides. The likelihood of observing the dis- tribution (n$ in the sample is then given by
7
r= 1 ,I,..
Estimates of p and y are obtained by maximizing the likelihood in Equation 3. The resulting estimates for the silent-site polymorphisms, and their 95% confidence in- tervals, are
p
= 33.57 2 5.50 and y = -1.34 ? 0.83 (Table 2), where the 2 values are the 95% confidence intervals obtained from the likelihood curvature. The negative value of y is in the direction expected with selection against nonoptimal codons. The statistical significance of y, against the null hypothesis that y = 0, can be tested by comparison with the log likelihood of a model in which y = 0. In this case, the counterpart of Equation 1 isf(q;p,
0 ) = (2 p/q)dq (SAWYER and HARTL 1992).Two times the difference of the log likelihoods for the model y = -1.34 against y = 0 equals 7.18, which has approximately a chi-squared distribution with one de- gree of freedom under the null hypothesis y = 0 , and so P = 0.007. The hypothesis that y = 0 can therefore be rejected at less than the 1 % level. The third column in Table 1 gives the expected numbers of the polymor- phic nucleotide configurations under the estimates of
p
and y in Table 2. The predicted numbers of configu- rations based on the estimates of p and y fit the observed numbers quite well ( P = 0.712,5 d.f.; see Table 1 ) . This is evidence that the averaging of y over different sites that is implicit in Equations 1, 2 and 3 provides a satis- factory fit to the data for the gnd gene.In applying the PRF model to amino acids, each site is identified with an amino acid position (codon) rather than a nucleotide. In the gnd data, there are codons for 469 amino acids, ofwhich 30 are polymorphic (Table 1 ) . For the amino acids, the maximum likelihood estimates of y and p, based on Equation 3, are y = -3.66 ? 2.24 and
p
= 12.5 2 4.5. In this case, two times the difference of the log likelihoods for the model y = -3.66 againsty = 0 equals 13.5, which again has approximately a chi- squared distribution with one degree of freedom under the null hypothesis y = 0 , and so P = 0.0002.
The estimated selection intensity against polymor- phic nucleotides in the third codon positions ( y =
-1.34) is significantly smaller than that against poly- morphic amino acids ( y = -3.66) because twice the difference in log likelihoods = 4.74, with one degree of freedom, yielding P = 0.03. However, the key find- ing of the analysis, relative to codon bias, is that the selection intensity against disfavored codons is ap- proximately one-third as large as the selection inten- sity against disfavored amino acids (-1.34/-3.66 =
0.37). The estimates of p and y are multiples of the effective population size, and so p = uLNand y = -sN,
230 D. L. Hartl, E. N. Moriyama and S. A. Sawyer
(Malthusian) selection coefficient in which the ratio of relative fitnesses of the ancestral and nonancestral genotypes is 1
+
s:l. The mutation rate is the most accurately estimated of all the parameters, averaging, for E. coli, approximately 5 X 10”’ per nucleotide per generation (DRAKE 1991). The number of third- position nucleotide sites included in the g n d silent-site analysis is 367 and the estimated value of p = 33.57 5 5.50, hence N is estimated asp/(
L X u ) = 1.8 Xlo8
2 3 X lo’ (Table 1). Using this estimate of N, the value of s against nonoptimal codons is 1.34/( 1.8 Xlo8)
= 7.3 Xlo-’
and that of s against nonoptimal amino acids is 2.0 X The estimated 95% confi- dence intervals around s, given in Table2,
include the sampling variance in bothp
and y.BULMERS METHOD
Our estimate of strong selection for codon bias in the g n d gene is supported by an independent analysis of codon usage in the gene itself. BULMER (1991) has pointed out that there are two sets of fourfold degen- erate synonymous codons in E. coli for which the opti- mal codons terminate in a pyrimidine (Y) and the non- optimal codons terminate in a purine (R)
.
These are codons for threonine (for which ACY is optimal and ACR nonoptimal) and for glycine (for which GGY is op- timal and GGR nonoptimal). Hence, in these codons, mutations between optimal and nonoptimal codons are transversions, and transitions can be ignored. Further- more, the rates of mutation between optimal and non- optimal codons can be assumed to be equal in the for- ward and reverse directions. Making use of an equation by WRIGHT (1931) for the equilibrium distribution of allele frequencies under selection with reversible mu- tation, BULMER (1991) shows that, with equal and suffl- ciently small forward and reverse mutation rates, y =-(%)In [ P/ (1 - P )
1,
where Pis the proportion of optimal codons. In the g n d gene, there are 22 threonine codons of which 18 are ACY and 41 glycine codons of which 38 are GGY, hence P(Thr) = 0.818 and P(G1y) = 0.927, which yields estimates of y = -0.75 and y =-1.27,
re- spectively, with a weighted average of y = -1.04. This value is well within the 95% confidence interval for y in Table 2 estimated from the PRF model.Alternatively, we may take y = -1.34 from Table 2 and use Bulmer’s formula, y = -(%)In [ P/ (1 - P)
1,
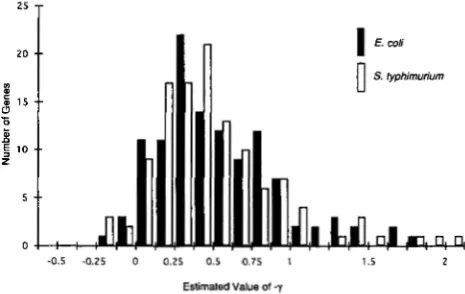
to esti- mate the expected proportion of optimal codons in the entire gene. It should, however, be emphasized that, for the entire gene, the assumption of equal forward and reverse mutation rates is somewhat dubious. Neverthe- less, the estimated P is 0.936 with 95% confidence in- terval (0.734,0.987). The g n d gene includes 399 amino acids for which there are clear optimal and nonoptimal codons (IKEMURA 1985) and, among these, 298 are op- timal, yielding P = 0.747. This value is within the 95% confidence interval expected from the PRF estimate of-0.5 -0.25 0 0.25 0.5 0.75 1 1.5 2
Estimated Value of -7
FIGURE 1.-Distribution of scaled selection intensity (-y) among genes in E . coli and S. typhimurium as estimated from the codon usage for threonine and glycine.
y. Furthermore, the estimated y is based on free recom- bination and statistical independence of sites; the effect of linkage is to reduce the observed value of P below that expected with free recombination, as LI (1987) has shown in computer simulations.
We have also used the PRF model to analyze synony- mous polymorphisms in 11 alleles of the putP (proline permease) gene in E. coli (NELSON and SELANDER 1992). The sequences each contain 489 codons, and there are
86 silent polymorphisms. The y for codon bias, esti- mated from Equation 3, is -0.306 2 1.51. This estimate of y , taken at face value, is again in good agreementwith the estimate obtained from BULMER’S method based on codon usage for threonine and glycine in PutP, which yields y = -0.240. However, the estimate of y has a large 95% confidence interval and there is not statistical sig- nificance against y = 0 , probably because the putPgene has substantially less codon bias than the g n d gene. One widely used measure of codon bias is the codon adap- tation index (CAI) of SHARP and LI (1987), which for g n d is 0.63 and for putP is 0.34.
DISTRIBUTION OF SELECTION COEFFICIENTS
AMONG GENES
The agreement between the estimated selection co- efficient against nonoptimal codons obtained from the analysis of synonymous polymorphisms using the PRF model and the estimate obtained from the analysis of codon usage using BULMER’S method encouraged us to apply BULMER’S method to a wider range of genes. We therefore examined codon bias for threonine and gly- cine in a sample of 118 genes each from E . coli and S .
Selection Intensity 231
lar for E . coli and S. typhimurium, with means and stand- ard deviations -y = 0.54 5 0.40 and 0.52 +_ 0.42, respectively. There are slight differences in estimates based on threonine alone or glycine alone: -y = 0.32 +_
0.43 and 0.24 2 0.40 for threonine codons in E . coli and
S . typhimurium, respectively, and - y = 0.70
*
0.43 and 0.70 +_ 0.41 for glycine codons in the two species. Thesedifferences are relatively small-within one standard deviation-and so justify the use of the combined data. Taking the value -y = 0.54 -+ 0.40 for E . coli and using the estimate N = 1.8 X 10’ from Table 2, the corre- sponding distribution of selection coefficients for codon bias would have mean and standard deviations s =
3.0 X
lo-’
2 2.2 X lo-’. The distribution of y inS.
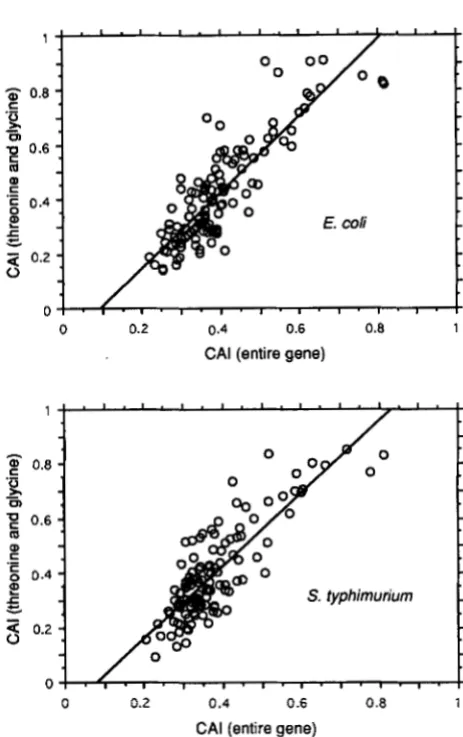
ty- p h i m ur iu m is virtually identical to that in E . coli (Figure l ) , but we have no independent estimate of N for this species.The empirical distributions in Figure 1 estimate the distribution of selection coefficients for codon bias among a large number of genes, provided that codon bias for threonine and glycine is a good predictor of codon bias across the entire gene. For genes in E . coli and S. typhimurium, these measures of codon bias are highly correlated. Figure 2 shows the regressions, for the set of genes in Figure 1, of the CAI for the entire gene against the CAI for threonine and glycine codons only. Both regressions are highly significant and account for a substantial proportion of the total variance in CAI, with
Rz
= 0.74 for the E. coli genes andR2
= 0.70 for theS. typhimurium genes.
MECHANISMS OF SELECTION FOR CODON BIAS
Issues regarding the molecular basis of natural selec- tion for codon bias are separable from, but not com- pletely unrelated to, those of selection intensity for codon bias. A number of molecular mechanisms are s u p ported by experimental observations, but they are nei- ther mutually exclusive nor exhaustive of all possibilities. In enteric bacteria, strong codon bias in highly ex- pressed genes is usually attributed to selection for trans- lational efficiency or speed of translation (reviewed in BULMER 1991). Other factors must also be involved. For
example, the codons proximal to the start of enterobac- terial genes have a reduced level of codon bias as well as a reduced level of synonymous substitution between E .
coli and S . typhimurium, suggesting that conservation of mRNA secondary structure in the start region may be important (EYRE-WALKER and BULMER 1993). The oppo- site tendency is observed for open reading frames of transposable insertion sequences in E . coli, which often have maximal codon bias in the start regions; the re- versed spatial distribution of codon bias may have a regulatory function mediated by ribosome pausing
(LAWRENCE and HARTL 1991).
Translational accuracy as well as speed are also prime candidates as mechanisms for codon bias. Two kinds
B
0 0.2 0.4 0.6 0.8 1
CAI (entire gene)
o !
. < .
I . ,. , .
I . ,.
,
.
,.
,
.
c
0 0.2 0.4 0.6 0.8 1CAI (entire gene)
FIGURE 2.-Relation between codon bias ( C A I ) across entire coding regions and that of codon usage for threonine and glycine only. The straight lines have been fit by least squares.
of accuracy are generally distinguished (reviewed in BULMER 1991) : (1) translational proofreading, which re- fers to the energetic cost of rejecting noncognate tRNAs that are incorrectly accepted at the ribosomal A site and
(2)
translational misincorporation, which refers to the actual incorporation of an incorrect amino acid into the growing polypeptide chain. Translational proofreading wastes the energy required initially to bind the incorrect tRNA and also the energy expended in rejecting it later. The cost of translational misincorporation is less clear because it depends on the functional effect of the amino acid replacement; in extreme cases, when the replace- ment is nonfunctional, the entire polypeptide is wasted. A statistical argument for the importance of transla- tional misincorporation has been put forward by AKASHI232 D. L. Hartl, E. N. Moriyama and S. A. Sawyer
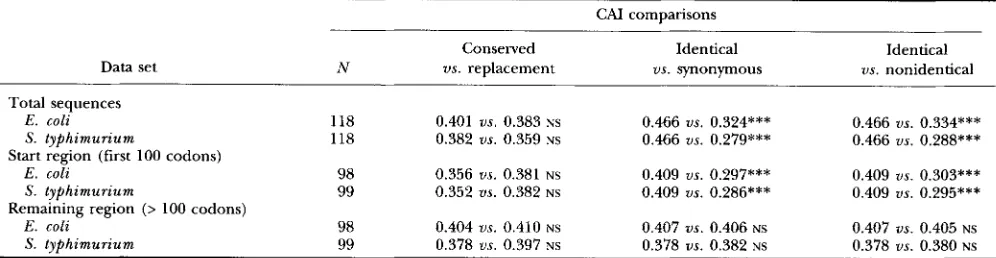
TABLE 3
Codon bias at conserved and replacement positions
CAI comparisons
Conserved
Data set N us. replacement
Total sequences
E . coli 118 0.401 us. 0.383 NS
S. typhimurzum 118 0.382 us. 0.359 NS
E . coli 98 0.356 us. 0.381 NS
S . typhimurium 99 0.352 us. 0.382 NS E. coli 98 0.404 us. 0.410 NS
S. typhimurium 99 0.378 us. 0.397 NS
Start region (first 100 codons)
Remaining region (> 100 codons)
Identical
us. synonymous 0.466 us. 0.324*** 0.466 us. 0.279*** 0.409 us. 0.297*** 0.409 us. 0.286*** 0.407 us. 0.406 NS
0.378 ns. 0.382 NS
Identical
us. nonidentical 0.466 us. 0.334*** 0.466 us. 0.288*** 0.409 us. 0.303*** 0.409 us. 0.295*** 0.407 us. 0.405 NS
0.378 us. 0.380 NS N is the number of genes analyzed in each comparison, and the CAI values are the averages for each type of codon. Analysis of the start region and remaining region was limited to sequences containing more than 200 codons. NS indicates no significant difference in a paired sign test, and
***
indicates significance at the 0.1% level. The Wilcoxon signed rank test yields exactly the same pattern of significance.~~~
acids were different (“replacement positions”). There was a significantly greater codon bias in the conserved positions than in the replacement positions. &HI
(1994) argues that this difference is inconsistent with mechanisms of codon bias based on either the rate of translational elongation or translational proofreading: translational elongation predicts greater codon bias in regions of the mRNA limiting to the rate of elongation, and translational proofreading predicts greater codon bias at codons prone to binding an incorrect tRNA. Nei- ther model predicts a difference in codon bias between conserved and replacement positions, but this differ- ence is consistent with the translational misincorpora- tion model because misincorporation into conserved positions is likely to have more drastic effects on protein function the misincorporation into positions that allow replacements.
In consideration of &HI’S (1994) finding in Dro-
sophila, we examined the codon bias at conserved and replacement positions among genes in E . coli and S.
typhimurium. In contrast with Drosophila genes, the genes from enteric bacteria show no significant differ- ence in codon bias between conserved positions and re- placement positions (Table 3 ) . Nonsignificant differ- ences were found when the comparisons included the entire coding regions in all 118 genes and remained nonsignificant when the first 100 codons were excluded on the grounds that this is the length of region over which mRNA secondary structure may afEect codon us- age (EYRE-WALKER and BULMER 1993).
Although AKASHI’S (1994) result for conserved us. re- placement positions is not observed in the E. coli-S. tr- phimurium data, there are other comparisons that are highly significant (Table 3 ) . Among the codon positions at which the amino acid is conserved in the two species, some positions also use identical codons, whereas other positions use synonymous codons, and the codon bias among identical codons is significantly greater than that among synonymous codons. Likewise, the codon
bias among identical codons is significantly greater than that among nonidentical (synonymous and re- placement) codons. However, the significant differ- ences extend only over the region of the first 100 codons (Table 3 ) .
DISCUSSION
We have developed a PRF model in order to estimate parameters of effective population size and selection in- tensity for codon bias using data from polymorphic codons in E . coli. For the gnd gene, the selection intensity against nonoptimal codons is approximately
3 as large as that against detrimental amino acid replace- ments in the same gene; the minimum ratio of the se- lection coefficients (lower 95% confidence boundary) is approximately 1/10.
One potential weakness of the PRF analysis is the specification of the ancestral nucleotide at sites at which more than two nucleotides are segregating. The data include 12 sites of this type among a total of 143 poly- morphic sites (Table l ) , and so the aggregate effect of these sites is small. However, as an alternative to assum- ing that, in these cases, the ancestral nucleotide is either the consensus in the sample or else the common an- cestor of all the nonconsensus nucleotides currently seg- regating, we also analyzed the data by specifylng the an- cestral nucleotide at these 12 sites by random choice among the nucleotides observed in the sample. Aver- aging the results over several replicates with different random choices of the ancestral nucleotide, the overall effect on the estimate of y and on the statistical signifi- cance of y # 0 was found to be negligible (data not shown).
Estimates of selection based on the PRF model are in good agreement with those obtained from the codon bias of threonine and glycine codons, in which the o p timal codons terminate in a pyrimidine (Y) and the non- optimal codons terminate in a purine (R)
.
In this case,Selection Intensity 233
y = -( %)ln [ P / (1 - P )
1,
where P is the proportion of threonine and glycine codons terminating in a pyrimi- dine (BULMER 1991). The empirical distribution of - yfor both E. coli and S . t y p h i m u r i u m is unimodal, largely concentrated in the range from 0 to 1, and somewhat skewed to the right (Figure 1 ) , with a mean and standard deviation for E. coli of -y = 0.54 2 0.40. Furthermore, the codon bias of threonine and glycine codons in a gene is highly correlated with that of the gene as a whole (Figure
2).
The patterns of codon bias observed in enteric bac- teria are quite unlike those described in Drosophila. In Drosophila, amino acids that are conserved in evolution have a significantly greater codon bias than those that are not conserved (AKASHI 1994), suggesting that trans- lational misincorporation is an important component of selection for codon bias. No such difference is observed between conserved and nonconserved amino acids in E. coli and S. t y p h i m u r i u m . However, conserved amino ac- ids with identical codons in the two species have signifi- cantly greater codon bias than found in either synony- mous codons or in nonidentical codons (Table 3). This pattern of high codon bias among identical codons ex- ists only across the region of the first 100 codons, which would support the view that there are unique selective constraints, perhaps including mRNA secondary struc- tures, in this part of the coding region (EYRE-WALKER and
BULMER 1993).
Although the difference between patterns of codon bias in enteric bacteria and Drosophila is perhaps in- dicative of fundamental differences in the mechanisms maintaining codon bias, it may also merely indicate that there is a different level at which selection for codon bias is offset by random genetic drift, in view of the much larger effective population number of E. coli compared with Drosophila. The effective population numbers of the two species have been estimated as approximately 2 X 10' for E. coli (Table
2)
us. approximately 5 X lo6 for Drosophila (AYALA and HARTL 1993). Setting MN,s =1 for E. coli (because it is haploid) with %N,s = 1 for Drosophila (because it is diploid) yields s = 2.5 X
lo-'
for E. coli us. s = 5 X
lo-'
for Drosophila as the value of the selection coefficients in the two species for which selection and random drift are about equally effective in determining the fate of an allele. The former value is 20 times greater than the latter, which implies that the fate of alleles in E . coli can be determined by selective forces more than an order of magnitude smaller than those that, in Drosophila, would be overcome by random ge- netic drift. Therefore, it is possible that translational mis- incorporation is also an important mechanism main- taining codon bias in E . coli but that a difference in codon bias between conserved and nonconserved amino acids is not observed because the selective effects of translational misincorporation at nonconserved amino acid sites are large enough, relative to the effec-tive population size, to maintain a high level of codon bias even at nonconserved sites. Consequently, patterns of codon bias in E . coli may be determined by other mechanisms resulting in selection coefficients that would be negligible, relative to the effective population size, in Drosophila. Included in this category may be selection for faster rates of translation, selection to mini- mize the need for translational proofreading, and se- lection based on subtle effects of mRNA secondary struc- ture (BULMER 1991; EYRE-WALKER and BULMER 1993).
Many discussions of codon bias emphasize the chal- lenge it presents to the neutral theory of molecular evo- lution (KIMURA 1983). The argument is that, in any pro- tein, the intensity of selection for the use of optimal codons must be very small in comparison to the selection intensity for the amino acid sequence itself. Hence, if features of protein evolution as seemingly insignificant as codon usage are determined by natural selection, then surely variations in amino acid sequence cannot be selectively neutral. The strength of this argument hinges on the intensity of selection for codon bias, and the ar- gument fails if the selection intensity for codon bias is of the same order of magnitude as that for the amino acid sequence itself. Our analysis indicates that the se- lection intensity for codon bias in enteric bacteria is by no means small relative to that against detrimental amino acid replacements maintained by mutation- selection balance. In the g n d gene, the ratio of selection coefficents is likely (with 95% confidence) to be larger than 1/10 and may be ?4 or even greater. Our estimate for g n d is also consistent with those obtained from codon usage for threonine and glycine among a large number of genes in E. coli and S. t y p h i m u r i u m .
We thank RICHARD KLIMAN for discussions, ADAM EYRE-WALKER for providing some of the E . coli and Salmonella data, and MICHAEL. BULMER for his helpful comments on the manuscript. This work was supported by grants from the National Institutes of Health to D.L.H. (GM-10322) and S.A.S. (GM-44889) and by a National Science Foun- dation grant to S.A.S. (DMS9108262).
LITERATURE CITED
AKASHI, H., 1994 Synonymous codon usage in Drosophila
melanogustel: natural selection and translational accuracy. Genetics 136: 927-935.
AYALA, F. J., and D. L. HARTL, 1993 Molecular drift of the bride of sevenless ( b o s s ) gene in Drosophila. Mol. Biol. Evol. 10: BENNETZEN, J. L., and B. D. HALL, 1982 Codon selection in yeast.
J. Biol. Chem. 257: 3026-3031.
BISERCIC, M., J. Y. FEUTRIER and P. R. REEVES, 1991 Nucleotide se- quences of the gnd genes from nine natural isolates ofEscherichia coli: evidence of intragenic recombination as a contributing fac-
tor in the evolution of the polymorphic gnd locus. J. Bacteriol.
BULMER, M., 1991 The selection-mutationdrift theory ofsynonymous codon usage. Genetics 129: 897-907.
DRAKE, J. W., 1991 Spontaneous mutation. Annu. Rev. Genet. 25: 125-146.
DWHUIZEN, D. E., and L. GREEN, 1991 Recombination in Escherichia coli and the definition of biological species. J. Bacteriol. 173: 1030-1040.
1 7 3 3894-3900.
234 D. L. Hard, E. N. Moriyama and S. A. Sawyer
EYRE-WALKER, A., and M. BULMER, 1993 Reduced synonymous substi-
21: 4599-4603.
tution rate at the start of enterobacterial genes. Nucleic Acids Res.
GRANTHAM, R., C. GAUTIER and M. GOUY, 1980 Codon frequencies in 119 individual genes confirm consistent choices of degen- erate bases according to genome type. Nucleic Acids Res. 8:
1893-1912.
GROSJEAN, H., and W. FIERS, 1982 Preferential codon usage in pro- karyotic genes: the optimal codon-anticodon interaction energy and the selective codon usage in efficiently expressed genes. Gene
IKEMURA, T., 1981 Correlation between the abundance ofEscherichia coli transfer RNAs and the occurrence of the respective codons in its protein genes: a proposal for a synonymous codon choice that is optimal for the E . coli translational system. J. Mol. Biol. 151: IKEMURA, T., 1985 Codon usage and tRNA content in unicellular and
KIMURA, M., 1983 The Neutral Theory of Molecular Evolution. Cam-
LAWRENCE, J. G., and D. L. HARTL, 1991 Unusual codon bias occurring 18: 199-209.
389-409.
multicellular organisms. Mol. Biol. Evol. 203 1-13.
bridge University Press, Cambridge, England.
within insertion sequences in Escherichia coli. Genetica &I: 23-29.
LI, W.-H., 1987 Models of nearly neutral mutations with particular implications for nonrandom usage of synonymous codons. J. Mol. Biol. 24: 337-345.
NELSON, K., and R. IC SELANDER, 1992 Evolutionary genetics of the proline permease gene ( P U P ) and the control region of the proline utilization operon in populations of Salmonella and
Escherichia coli. J. Bacteriol. 174: 6886-6895.
SAWYER, S. A., and D. L. HARTL, 1992 Population genetics of poly- morphism and divergence. Genetics 1 3 2 1161-1176.
SHARP, P. M., and W. H. LI, 1987 The codon adaptation index-a measure of directional synonymous codon usage bias, and its po- tential applications. Nucleic Acids Res. 15: 1281-1295. WRIGHT, S., 1931 Evolution in Mendelian populations. Genetics 16:
WRIGHT, S., 1938 The distribution of gene frequencies under irre- versible mutation. Proc. Natl. Acad. Sci. USA 2 4 253-259. WRIGHT, S., 1969 Evolution and the Genetics of Populations, Val. 2:
The Theory of Gene Frequencies. University of Chicago Press, Chicago.
97-159.