296 |
P a g e
www.ijarse.com
NON-LINEAR STATIC ANALYSIS OF MULTISTOREY
RC BUILDINGS CONSIDERING SOIL STRUCTURE
INTERACTION
1
Ramesh Baragani,
2Dr. S S Dyavanal
1
PG Student,
2Professor, Civil Engg Dept.
BVBCET, Hubli, (India)
ABSTRACT
Commonly designers consider the building to be fixed at their bases. Although structures are supported on soils,
most of the designers do not consider the effect of soil structure interaction during earthquake. When a structure is
subjected to an earthquake excitation, it interacts with the foundation and soil, and thus changes the motion of the
ground. The supporting soil medium allows shaking of the whole ground. Structural system is influenced by the type
of soil as well as the type of structure. The effect of soil structure interaction should be considered in the buildings
which are located in the earthquake prone areas. The prime importance in this paper is to understand the
behaviour of RC 2D frames subjected to seismic forces for varying soil conditions given in the code IS 1893 (Part
1): 2002. The investigation is carried out on G+9 storey buildings supported on hard and soft soil located in seismic
zone III. Performance based seismic evaluation is carried out by non linear static pushover analysis as per the
guidelines specified in FEMA 440. User-defined nonlinear hinge properties are assigned for beams and columns
based on the moment-curvature relationships. Natural period, base shear, lateral displacement, storey drift,
ductility ratio, safety ratio, global stiffness, and hinge status at performance point results are obtained and
compared among the models. The investigation concludes that as the stiffness of soil decreases the base shear and
global stiffness decreases. Natural period, lateral displacement, and storey drift increases. Safety ratio varies
inversely with the stiffness of soil. Most of flexural hinges are found within the life safety range at the ultimate state.
Keywords: Soil Structure Interaction, Pushover Analysis, User Defined Hinge, Performance Levels,
Ductility Ratio, Safety Ratio, Global Stiffness
I. INTRODUCTION
297 |
P a g e
www.ijarse.com
building may not be able to resist the minor earthquake supported on soft soil. For the structure to perform better during the earthquakes, it must be analyzed and designed as per the Indian seismic code IS 1893 (Part 1): 2002 [1].
Several studies have been made on the effect of soil-structure interaction problems to obtain more realistic analysis. They have quantified the effect of interaction behaviour and established that there is redistribution of forces in the structure and soil mass. Hence, structures and their supporting soil should be considered as a single compatible unit. The interaction effects are found quite significant, particularly for the structures resting on highly compressible soils. The flexibility of soil mass causes the differential settlement and rotation of footings under the application of load. The relative stiffness of structure, foundation, and soil influence the interaction behaviour of structure-foundation-soil system.
II. DESCRIPTION OF STRUCTURES
2D frames building models with G+9 storeyed are considered in the present paper. These consist of beam–column RC frame buildings, locatedin seismic zone III and intended for office use. The bottom storey height is 4.8 m and upper storeys height is taken as 3.6 m for all buildings [2]. The buildings are kept symmetric to avoid torsional
response under pure lateral forces.
298 |
P a g e
www.ijarse.com
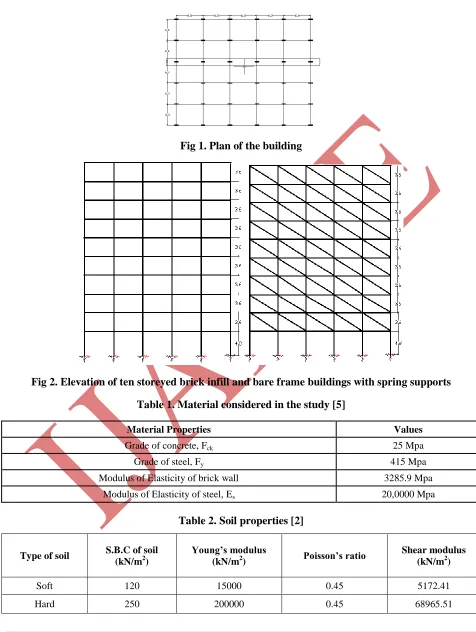
Fig 1. Plan of the building
Fig 2. Elevation of ten storeyed brick infill and bare frame buildings with spring supports
Table 1. Material considered in the study [5]
Material Properties Values
Grade of concrete, Fck 25 Mpa
Grade of steel, Fy 415 Mpa
Modulus of Elasticity of brick wall 3285.9 Mpa Modulus of Elasticity of steel, Es 20,0000 Mpa
Table 2. Soil properties [2]
Type of soil S.B.C of soil
(kN/m2)
Young’s modulus
(kN/m2) Poisson’s ratio
Shear modulus
(kN/m2)
Soft 120 15000 0.45 5172.41
299 |
P a g e
www.ijarse.com
III. METHODOLOGY
The majority of the existing RC multistorey buildings in our country are still under threat, because buildings are not designed as per seismic codes, wrong construction practice and lack of knowledge for earthquake resistant design. It is very uneconomical to demolish and reconstruct them as per code provisions. It is a wiser to retrofit and strengthen them after evaluating their strength and performance. Therefore, it is necessary to use non linear analysis to evaluate the performance of existing buildings. Non linear static pushover analysis is carried out with user defined hinges.
3.1 User Defined Hinges
Moment-curvature relationships are predicted in order to define the user-defined plastic hinge properties. The moment curvature relationships are developed as per IS: 456 – 2000[6]. The definition of user-defined hinge properties requires moment–curvature analysis of each element. For the problem defined, building deformation is assumed to take place only due to moment under the action of laterally applied earthquake loads. Thus user-defined M3 hinges were assigned at rigid ends where flexural yielding is assumed to occur. Moment-curvature relationships are developed for beams, columns in SAP2000 to represent the flexural characteristics of plastic hinges at the ends.
3.2. Pushover Analysis
Pushover analysis is a static non-linear procedure in which the magnitude of the lateral load is incrementally increased maintaining a predefined distribution pattern along the height of the building. With the increase in the magnitude of loads, weak links and failure modes of the building can be found. Pushover analysis can determine the behaviour of a building, including the ultimate load and the maximum inelastic deflection. At each step, the base shear and the roof displacement can be plotted to generate the pushover curve for the structure. Pushover analysis as per FEMA 440 [7] guide lines is adopted.The models are pushed in a monotonically increasing order in a particular direction till the collapse of the structure. 4% of height of building [8] as maximum displacement is taken at roof level and the same is defined in to several steps. The global response of structure at each displacement level is obtained in terms of the base shear, which is presented by pushover curve. The peak of this curve represents the maximum base shear i.e., maximum load carrying capacity of the structure. The initial stiffness of the structure is obtained from the tangent at pushover curve at the load level of 10% that of the ultimate load and the maximum roof displacement of the structure is taken that deflection beyond which the collapse of structure takes place [4].
IV. RESULTS AND DISCUSSIONS
4.1 Fundamental Natural Period
300 |
P a g e
www.ijarse.com
The change in natural periods due to the effect of soil flexibility with respect to various parameters such as types of soil ranging from hard and soft are compared. The comparison is made between ten storey bare and soft storey building models supported on hard and soft soils. The natural periods obtained for various building models by IS: 1893 (Part 1) - 2002 [1] code and analytical (SAP2000) are specified in Table 3.
Table 3. Fundamental natural period for ten storeyed building models
Type of soil Bare frame Soft Storey
Codal Analytical Codal Analytical
Hard 1.36 2.21 1.13 0.98
Soft 1.36 2.61 1.13 1.49
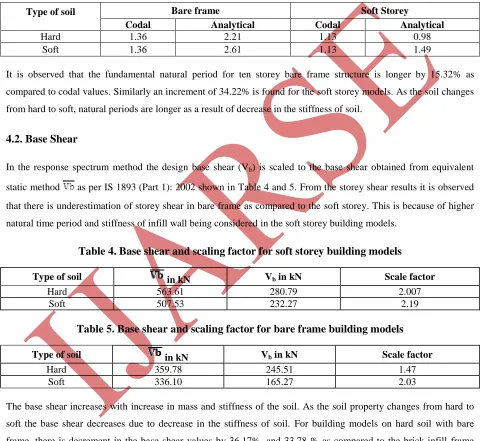
It is observed that the fundamental natural period for ten storey bare frame structure is longer by 15.32% as compared to codal values. Similarly an increment of 34.22% is found for the soft storey models. As the soil changes from hard to soft, natural periods are longer as a result of decrease in the stiffness of soil.
4.2. Base Shear
In the response spectrum method the design base shear (Vb) is scaled to the base shear obtained from equivalent
static method as per IS 1893 (Part 1): 2002 shown in Table 4 and 5. From the storey shear results it is observed
that there is underestimation of storey shear in bare frame as compared to the soft storey. This is because of higher natural time period and stiffness of infill wall being considered in the soft storey building models.
Table 4. Base shear and scaling factor for soft storey building models
Type of soil in kN Vb in kN Scale factor
Hard 563.61 280.79 2.007
Soft 507.53 232.27 2.19
Table 5. Base shear and scaling factor for bare frame building models
Type of soil in kN Vb in kN Scale factor
Hard 359.78 245.51 1.47
Soft 336.10 165.27 2.03
301 |
P a g e
www.ijarse.com
4.3 Lateral Displacements
4.3.1 Effect of soil structure interaction
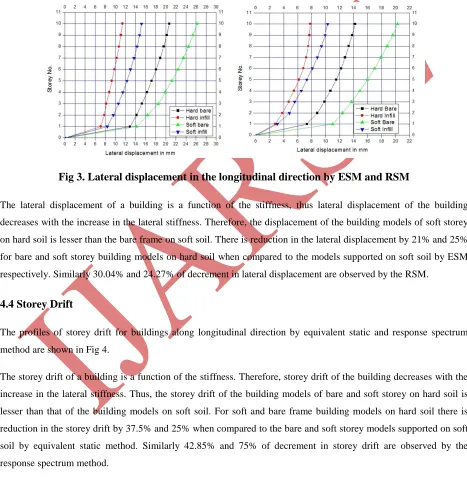
The profile of lateral displacements along longitudinal direction for equivalent static and response spectrum method are shown in Fig 3.
Fig 3. Lateral displacement in the longitudinal direction by ESM and RSM
The lateral displacement of a building is a function of the stiffness, thus lateral displacement of the building decreases with the increase in the lateral stiffness. Therefore, the displacement of the building models of soft storey on hard soil is lesser than the bare frame on soft soil. There is reduction in the lateral displacement by 21% and 25% for bare and soft storey building models on hard soil when compared to the models supported on soft soil by ESM respectively. Similarly 30.04% and 24.27% of decrement in lateral displacement are observed by the RSM.
4.4 Storey Drift
The profiles of storey drift for buildings along longitudinal direction by equivalent static and response spectrum method are shown in Fig 4.
302 |
P a g e
www.ijarse.com
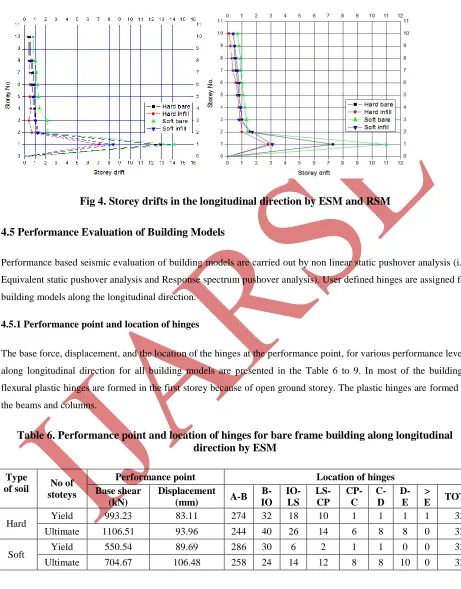
Fig 4. Storey drifts in the longitudinal direction by ESM and RSM
4.5 Performance Evaluation of Building Models
Performance based seismic evaluation of building models are carried out by non linear static pushover analysis (i.e. Equivalent static pushover analysis and Response spectrum pushover analysis). User defined hinges are assigned for building models along the longitudinal direction.
4.5.1 Performance point and location of hinges
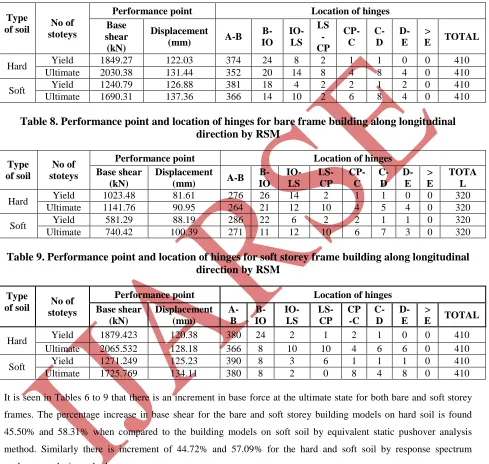
The base force, displacement, and the location of the hinges at the performance point, for various performance levels along longitudinal direction for all building models are presented in the Table 6 to 9. In most of the buildings, flexural plastic hinges are formed in the first storey because of open ground storey. The plastic hinges are formed in the beams and columns.
Table 6. Performance point and location of hinges for bare frame building along longitudinal
direction by ESM
Type
of soil No of
stoteys
Performance point Location of hinges
Base shear (kN)
Displacement
(mm) A-B
B-IO
IO-LS
LS-CP
CP-C
C-D
D-E
>
E TOTAL
Hard Yield 993.23 83.11 274 32 18 10 1 1 1 1 320 Ultimate 1106.51 93.96 244 40 26 14 6 8 8 0 320
303 |
P a g e
www.ijarse.com
Table 7. Performance point and location of hinges for soft storey building along longitudinal
direction by ESM
Type
of soil stoteys No of
Performance point Location of hinges
Base shear (kN)
Displacement
(mm) A-B
B-IO IO-LS LS -CP CP-C C-D D-E >
E TOTAL
Hard Yield 1849.27 122.03 374 24 8 2 1 1 0 0 410 Ultimate 2030.38 131.44 352 20 14 8 4 8 4 0 410
Soft Yield 1240.79 126.88 381 18 4 2 2 1 2 0 410 Ultimate 1690.31 137.36 366 14 10 2 6 8 4 0 410
Table 8. Performance point and location of hinges for bare frame building along longitudinal
direction by RSM
Type of soil
No of stoteys
Performance point Location of hinges
Base shear (kN)
Displacement
(mm) A-B
B-IO IO-LS LS-CP CP-C C-D D-E > E TOTA L
Hard Yield 1023.48 81.61 276 26 14 2 1 1 0 0 320 Ultimate 1141.76 90.95 264 21 12 10 4 5 4 0 320
Soft Yield 581.29 88.19 286 22 6 2 2 1 1 0 320 Ultimate 740.42 100.39 271 11 12 10 6 7 3 0 320
Table 9. Performance point and location of hinges for soft storey frame building along longitudinal
direction by RSM
Type
of soil stoteys No of
Performance point Location of hinges
Base shear (kN) Displacement (mm) A-B B-IO IO-LS LS-CP CP -C C-D D-E >
E TOTAL
Hard Yield 1879.423 120.38 380 24 2 1 2 1 0 0 410 Ultimate 2065.532 128.18 366 8 10 10 4 6 6 0 410
Soft Yield 1271.249 125.23 390 8 3 6 1 1 1 0 410 Ultimate 1725.769 134.11 380 8 2 0 8 4 8 0 410
It is seen in Tables 6 to 9 that there is an increment in base force at the ultimate state for both bare and soft storey frames. The percentage increase in base shear for the bare and soft storey building models on hard soil is found 45.50% and 58.31% when compared to the building models on soft soil by equivalent static pushover analysis method. Similarly there is increment of 44.72% and 57.09% for the hard and soft soil by response spectrum pushover analysis method.
304 |
P a g e
www.ijarse.com
are formed beyond the CP range at the ultimate state is 6.875% and 8.125% for bare frame building models on hard and soft soil respectively. 3.92% and 4.87% for infill frame building models on hard and soft soils by equivalent static pushover analysis method. Similarly 4.11% and 5%, for bare frame and 3.9% and 4.87% for infill frames by response spectrum pushover analysis method.
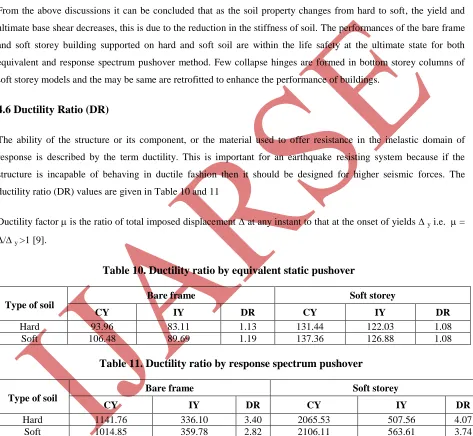
From the above discussions it can be concluded that as the soil property changes from hard to soft, the yield and ultimate base shear decreases, this is due to the reduction in the stiffness of soil. The performances of the bare frame and soft storey building supported on hard and soft soil are within the life safety at the ultimate state for both equivalent and response spectrum pushover method. Few collapse hinges are formed in bottom storey columns of soft storey models and the may be same are retrofitted to enhance the performance of buildings.
4.6 Ductility Ratio (DR)
The ability of the structure or its component, or the material used to offer resistance in the inelastic domain of response is described by the term ductility. This is important for an earthquake resisting system because if the structure is incapable of behaving in ductile fashion then it should be designed for higher seismic forces. The ductility ratio (DR) values are given in Table 10 and 11
Ductility factor is the ratio of total imposed displacement at any instant to that at the onset of yields y i.e. =
/y >1 [9].
Table 10. Ductility ratio by equivalent static pushover
Type of soil
Bare frame Soft storey
CY IY DR CY IY DR
Hard 93.96 83.11 1.13 131.44 122.03 1.08 Soft 106.48 89.69 1.19 137.36 126.88 1.08
Table 11. Ductility ratio by response spectrum pushover
Type of soil
Bare frame Soft storey
CY IY DR CY IY DR
Hard 1141.76 336.10 3.40 2065.53 507.56 4.07 Soft 1014.85 359.78 2.82 2106.11 563.61 3.74
For bare frame building models on hard soil as per response spectrum pushover analysis method there is increment
in ductility ratio by 66.76% when compared with equivalent static pushover analysis
.
Similarly the increment of305 |
P a g e
www.ijarse.com
to be 71.12%. It is concluded from the results that the buildings are more ductile as evaluated by RSM compared to ESM.
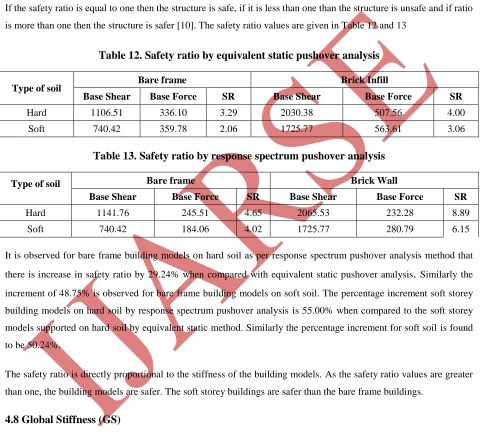
4.7 Safety Ratio (SR)
The ratio of base shear force at performance point to the base shear by equivalent static method is called safety ratio. If the safety ratio is equal to one then the structure is safe, if it is less than one than the structure is unsafe and if ratio is more than one then the structure is safer [10]. The safety ratio values are given in Table 12 and 13
Table 12. Safety ratio by equivalent static pushover analysis
Type of soil Bare frame Brick Infill
Base Shear Base Force SR Base Shear Base Force SR
Hard 1106.51 336.10 3.29 2030.38 507.56 4.00 Soft 740.42 359.78 2.06 1725.77 563.61 3.06
Table 13. Safety ratio by response spectrum pushover analysis
Type of soil Bare frame Brick Wall
Base Shear Base Force SR Base Shear Base Force SR
Hard 1141.76 245.51 4.65 2065.53 232.28 8.89 Soft 740.42 184.06 4.02 1725.77 280.79 6.15
It is observed for bare frame building models on hard soil as per response spectrum pushover analysis method that
there is increase in safety ratio by 29.24% when compared with equivalent static pushover analysis
.
Similarly theincrement of 48.75% is observed for bare frame building models on soft soil. The percentage increment soft storey building models on hard soil by response spectrum pushover analysis is 55.00% when compared to the soft storey models supported on hard soil by equivalent static method. Similarly the percentage increment for soft soil is found to be 50.24%.
The safety ratio is directly proportional to the stiffness of the building models. As the safety ratio values are greater than one, the building models are safer. The soft storey buildings are safer than the bare frame buildings.
4.8 Global Stiffness (GS)
306 |
P a g e
www.ijarse.com
Table 14. Global stiffness by equivalent static pushover analysis
Type of soil
Bare frame Brick Infill
BF at PF Displacement at PF GS BF at PF Displacement at PF GS
Hard 1106.51 93.96 12.55 2030.38 131.44 16.22 Soft 704.67 100.39 7.38 1725.77 134.11 12.87
Table 15. Global stiffness by response spectrum pushover analysis
Type of soil
Bare frame Soft storey
BF at PF Displacement at PF GS BF at PF Displacement at PF GS
Hard 1141.76 90.95 11.78 2065.53 128.18 15.26 Soft 740.42 106.48 6.62 1690.32 137.36 12.31
It is seen from Tables 14 and 15 for bare frame building models on hard soil as per response spectrum pushover analysis method that there is reduction in global stiffness by 6.13% when compared with equivalent static pushover
analysis
.
Similarly, the decrement of 15.71% is observed for bare frame building models on soft soil. The incrementfor soft storey frame building models on hard soil by equivalent static method is found to be 5.92% when compared to the soft storey models supported on hard soil by response spectrum pushover analysis. Similarly, the percentage increase for soft soil is found to be 4.36%. The global stiffness decreases with stiffness of the soil. It can be concluded the buildings are stiffer on hard soil compared to buildings on soft soil.
V. CONCLUSIONS
Based on the building and soil parameters considered in this paper the following conclusions are drawn,
The fundamental natural period of the building vary inversely with stiffness of the soil. There is increase in
fundamental natural period as the soil property changes from hard to soft.
The soil property has influence on the base shear of the buildings as the soil property changes from hard to soft
the base shear decreases due to decrease in the soil stiffness.
The lateral displacement of the building increases as the soil property changes from hard to soft soil. The
flexibility of soil directly affects the lateral displacement of the building.
The storey drift is inversely proportional to the stiffness of soil, as the stiffness of soil increases the storey drift
decreases, the storey drift values are found within the limit for all building models.
Few collapse hinges were developed in the columns of ground storey and the same can be retrofitted.
Flexural hinges are found within the life safety range at the ultimate state.
Soft storey buildings are more stiffer and safer compared to bare frame models as per global stiffness and safety
307 |
P a g e
www.ijarse.com
REFERENCES
[1] IS 1893 (Part1): 2002, Criteria for earthquake resistant design of structure, General Provision and Building.
[2] Hegde Purnachandra. S, Dyavanal S.S, and Annigeri S.A (2007), “Performance Based Seismic evaluation of multistorey buildings considering the effect of soil structure interaction”, RDSE-2007, Manipal Institute
of technology, Manipal
[3] Agarwal P and Shrikhande M (2006), “Earthquake design of structures” Prentice Hall of India Private Limited New Delhi India.
[4] FEMA 356, 2000 “Pre-standard and commentary for the seismic rehabilitation of buildings”, ASCE for the
Federal Emergency Management Agency, Washington, D.C.
[5] Rihan Maaze “Seismic Evaluation of Multistorey Buildings with Soft Storey”, M.Tech thesis, 2013, BVB
College of Engg. & Tech., Hubli-580 031, India..
[6] IS:456-2000 “Code of Practice for Plain and Reinforced Concrete”, Bureau of Indian Standards, New Delhi, India.
[7] Federal Emergency Management Agency, FEMA-440 (2005), “Improvement of Nonlinear Seismic Analysis Procedures”. California.
[8] Applied Technology Council, (1996), “Seismic Evaluation and Retrofit of Concrete Buildings”, ATC 40,
Vol. 1, Applied Technology Council, Redwood city, California
[9] Park R and Paulay T (1975), "Reinforced Concrete Structures," Christ church, New Zealand, Aug, pp. 270-343, 1974.
[10] V.B. Karkatti, “Seismic Evaluation and Retrofitting of Soft Ground RC Multistorey Buildings”, M.Tech Thesis, B.V. Bhoomaraddi College of Engineering & Technology, Hubli, 2006.
[11] Pradeep.Kumar K, Dyavanal S.S and Annigeri, S.A (2006), “Seismic Evaluation of Multistoried Buildings with Infill Masonry”, Second Cusat Conference on Recent Advances in Civil Engineering RACE 2006.
Civil Engineering Division, Kochin