Distinct subgroups of amnestic mild cognitive impairment as identified by soft independent modeling of class analogy.
Sookjaroen Tangwongchai1, Ittipol Tawankanjanachot2, Chavit Tunvirachaisakul1, Thitiporn Supasitthumrong1, Solaphat Hemrunroj1, Phenphichcha Chuchuen2, Thiti Snabboo3, Andre
Carvalho4,5, Michael Maes1
1
Department of Psychiatry, Faculty of Medicine, Chulalongkorn University, Bangkok, Thailand.
2
Department of Psychiatry, King Chulalongkorn Memorial Hospital, The Thai Red Cross Society, Bangkok, Thailand
3
Excellence Center of Diabetes, Hormones and Metabolism, Department of medicine, Faculty of
Medicine, Chulalongkorn University , Bangkok, Thailand
4
Department of Psychiatry, University of Toronto, Toronto, ON, Canada;
5 Centre for Addiction and Mental Health (CAMH), Toronto, ON, Canada;
Corresponding author:
Prof. Dr. Michael Maes, M.D., Ph.D.
Department of Psychiatry
Faculty of Medicine
Patumwan
Chulalongkorn University
Bangkok 10330
Thailand
https://scholar.google.co.th/citations?user=1wzMZ7UAAAAJ&hl=th&oi=sra
Abstract
Amnestic mild cognitive impairment )aMCI( is a condition characterized by mild deficits in episodic and semantic memory and learning. The conversion rate of aMCI to Alzheimer disease )AD( is significantly higher in aMCI than in the general population. The aim of this study is to examine whether aMCI is a valid diagnostic category or whether aMCI comprises different subgroups based on cognitive functions. We recruited 60 aMCI patients, 60 with AD and 61 healthy controls who completed neuropsychological tests of the Consortium to Establish a Registry for Alzheimer’s Disease )CERAD-NP( and biomarkers including serum anion gap )AGAP(. Principal component analysis, support vector machine and Soft Independent Modeling of Class Analogy )SIMCA( showed that AD patients and controls were highly significantly discrimanted from each other, while patients with aMCI overlap considerably with normal controls. SIMCA showed that 68.3% of the aMCI patients were assigned to the control class )named: aMCI-HC(, 15% to AD AD(, while 16.6% did not belong to either class )aMCI-strangers(. aMCI-HC subjects showed sings of very mild cognitive decline and impaired recall. aMCI-strangers showed signs of mild cognitive impairment with impaired fluency and naming. aMCI-AD cases showed a cognitive profile reminiscent of AD an increased AGAP levels. In conclusion, our SIMCA model may classify subjects afforded a clinical diagnosis of aMCI according to Petersen’s criteria into three clinically relevant subgroups and help in the early detection of AD by identifying aMCI patients at risk to develop AD and those that have an AD prodrome.
Introduction
Memory disorders are common complaints that are of great concern among senior citizens around the world. Alzheimer’s disease )AD( is the most common cause of dementia and accounts for around 64-90 % of the neuropathological findings in all subjects with dementia )1(. AD is a progressive neuroinflammatory and neurodegenerative disorder of the brain )2, 3( and patients with that disease show a gradual decline in learning, attention, memory, executive functions and language causing impairments in social interactions and difficulties in carrying out activities of daily living )ADL( )3(.
The Consortium to Establish a Registry for Alzheimer’s, Neuropsychological Battery )CERAD-NP(, is a standardized and reliable measure to differentiate both MCI and AD from health controls )18-22(. For example, the CERAD-NP composite or total score shows high accuracy in distinguishing normal controls from AD and MCI patients )21, 23(. Previous reports demonstrated that CERAD-NP memory measures including Wordlist Recall )WLRecall(, Wordlist Memory )WLM( and Word List Recognition )WLRecognition( have a significant predictive power in differentiating AD and MCI from normal control )22, 24-26(. Recently, we reported that a combination of CERAD-NP tests, namely WLRecall, WLM and Verbal Fluency Test )VFT(, is useful to differentiate aMCI patients from healthy elderly controls )27( and that a lower score on the short version of the Boston Naming Test )BNT( is more predictive for AD, but not MCI )28(.
that FBG, AGAP and bicarbonate interact with ApoE4 to predict greater memory impairments )40(.
Nevertheless, there are no data whether cognitive aberrations, as measured with the CERAD-NP, may model aMCI as a distinct diagnostic category, which may be discriminated from controls and AD patients or whether aMCI comprises different cognitive subgroups which may be externally validated by peripheral blood biomarkers including AGAP, FBG or AIP. Hence, the aim of the present study is to examine whether aMCI is a distinct diagnostic class based on cognitive function as assessed with the CERAD-NP or comprises subgroups with a different cognitive profile.
Subjects and Methods Participants
In the current study we recruited 181 participants of Thai nationality, both sexes and age ranging from 55 to 90 years. All subjects with memory impairments, including aMCI and AD, were recruited at the Dementia clinic, King Chulalongkorn Memorial Hospital, Bangkok, Thailand. Healthy control subjects were community healthy aging senior club members or senior Red Cross volunteers, King Chulalongkorn Memorial Hospital. All controls and AD/aMCI patients were recruited from the same catchment area, namely Pathumwan district, Bangkok province, Thailand.
Examination )MMSE-Thai( )42( between 10 and 23; and c( impaired ADL as assessed using the Blessed Dementia Scale )43, 44(. aMCI patients presented with subjective memory complaints and were diagnosed using Petersen’s Criteria. )4(. Subjective memory complaints were assessed using the question “do you feel that your memory is becoming worse” )14, 15(. Additional inclusion criteria for aMCI patients were a Thai MMSE score > 23 and a CDR score equaling 0.5. Controls were only included if they did not show subjective memory complaints and when they had a CDR score of 0 and a Thai MMSE > 23. Consequently, subjects were divided into three study groups, namely 60 AD, 60 aMCI and 61 normal controls.
We considered the following exclusion criteria for aMCI and AD patients and controls: a( medical disorders such as chronic obstructive pulmonary disease, vitamin B12 deficiency, hypothyroidism, severe heart disease )functional class II or more(, cancer and chronic kidney disease; b( neurologic disorders including meningitis, encephalitis, Parkinson’s disease, epilepsy, multiple sclerosis and traumatic brain injury; c( vascular and frontotemporal lobe dementia, d( other axis 1 psychiatric disorders such as affective disorders, schizophrenia and substance abuse; and e( abnormal results of blood assays including thyroid status tests and positive results for VDRL and HIV.
Methods
Axis-1 DSM-IV-TR criteria were used to make the diagnosis of axis 1 psychiatric diagnosis and exclude subjects accordingly.
In addition, we performed MRI brain scans )1.5T MRI scans( and collected blood in all participants to assay thyroid function test )free T3 and T4, TSH(, liver function tests )ALT, AST(, serum B12 levels, complete blood count, lipid profile including total cholesterol, high density lipoprotein and low density lipoprotein cholesterol, kidney function tests including blood urea nitrogen and creatinine kinase, and serum uric acid. These blood test were performed in the Central Laboratory, King Chulalongkorn Memorial Hospital, an accredited laboratory conforming to ISO 15189 standards.
Assays
Fasting blood was sampled at 8.00 a.m from healthy controls and aMCI/AD patients for the assay of ApoE genotypes and selected biochemical measurements. This study used 3 mL clotted blood )serum(, centrifuged at 1,000 g during 5 minutes and used the Architect C8000 )Abbott Laboratories, Abbott Park, Illinois, USA( to assay the following parameters: blood electrolytes )Sodium, Potassium and Chloride( measured by indirect ion selective electrode )CV 1.3%, 1.4% and 1.2%, respectively( and used to compute anion gap. Blood carbon dioxide was assayed using the PEP carboxylase method with a CV of 5.9%. Plasma glucose levels were measured by Hexakinase/ G-6-PDH technique with inter-assay coefficients of variability )CV( of 2.0%.
Genomic DNA was extracted from peripheral blood leukocytes by standard procedures with a DNA Mini Kit )QIAGEN GmbH, Hilden, Germany(. DNA was amplified by using two
5'-TAAGCTTGGCACGGCTGAAGGA-3'. Each amplification reaction contained 1 g of leukocyte DNA, 1 pmol/l of each primer, 10 % dimethyl sulfoxide, and 0.025 units/pl of Taq polymerase in a final volume of 30 l. Each reaction mixture was heated at 95 °C for 5 min followed by 40 cycles of 95 °C for 60 s, 65 °C for 80 s and 72 °C for 80 s with a final extension at 72 °C for 7 min. The PCR products were treated with ExoSAP-IT )USP Corporation, Cleveland, USA( according to the protocols supplied by the manufacturer, and sent for direct sequencing to Macrogen Inc., Seoul, South Korea. We defined APOE genotype groups including APOE2 )E2/E2 or E3/E2 genotypes(; b( APOE3 )including those carrying E3/E3 genotypes(, and APOE4 )E4/E3 or E4/E4 genotypes(. In the present study, we used the ApoE4 genotype group, denoted as any E4 allele, comprising participants carrying E4/E4, E3/E4 and E2/E4. Indeed, one E4 copy )especially E3/E4( increases risk for AD, while two E4 copies )E4/E4( increase risk considerably )36, 37(
Statistics
Machine learning techniques.
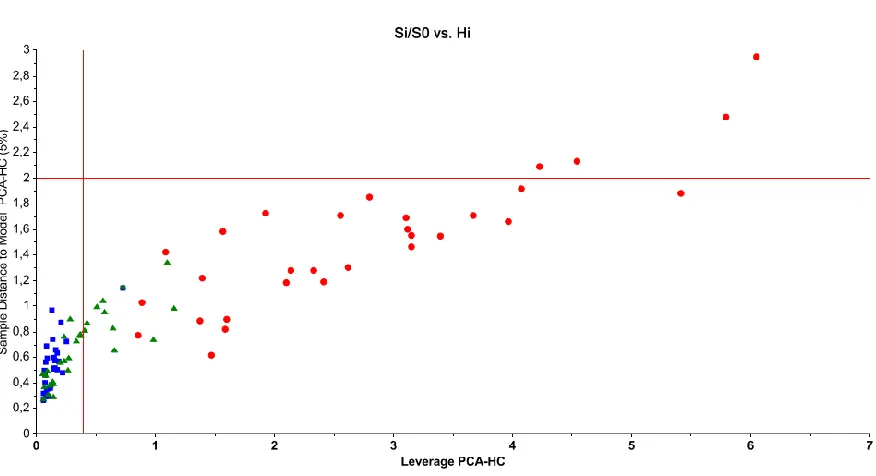
We used joint principal component analysis )PCA( performed on the CERAD test results in all participants combined in order to display the distribution of the diagnostic classes in the multivariate space whereby the diagnostic groups are differentiated by marker colors and shapes. We used a standard deviation weighting process and a 20-fold cross-validation scheme. We also compute the percentage of variance explained by the extracted PCs. In the same 2D plot comprising the first two PCs we display Hotelling’s T² ellipse )alpha=0.01%( to highlight outliers influencing the PC model. Critical outlier limits are based on 0.01% F-residuals and Hotelling’s T2. Correlation loadings plot comprises two ellipses, the outer one indicating 111% explained variance and the inner one indicating 50% of the variance.
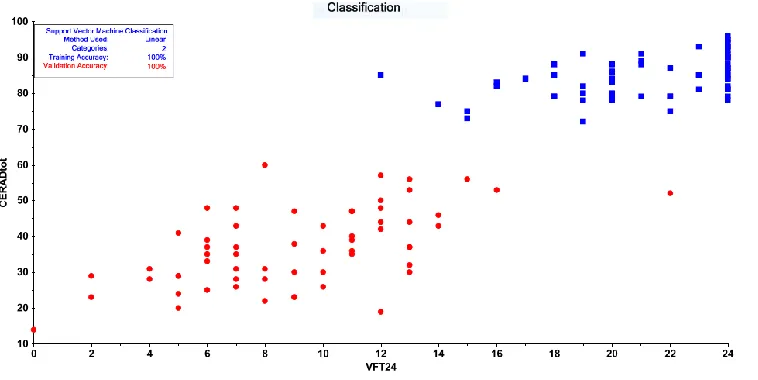
Classification through Support Vector Machine )SVM( was applied with radial basis function kernel )RBF SVM( and linear kernel )linear SVM( using the Unscrambler. The CERAD test results were normalized using a standard deviation weighting process and the SVM model was validated using a 10-fold cross-validation scheme. The capacity factor C was examined using different values in order to optimize the classification performance. We used two figures of merit namely the accuracy of the classification )percentage of correctly classified cases in both the calibration and validation samples( and the confusion matrix and show the classification results in a 2D scatter plot with the two best CERAD tests as axes.
the strength of intergroup separation, whereby a distance between 0 and 3 indicates no real differences between the classes, a distance > 3 indicates that the class models are well discriminated and distances > 20 indicate that the models are strongly separated. b( The discrimination power of the CERAD tests indicating the impact of each CERAD probe to discriminate the class models from each other.
Results. GLM analysis
Table 1 shows the socio-demographic data as well as CERAD measurements in normal
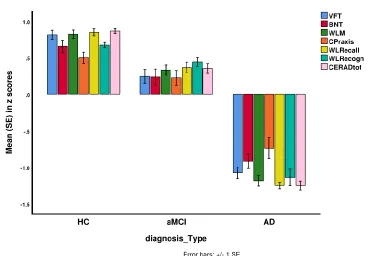
controls, AD and aMCI patients. Figure 1 shows the mean )SE( values of the z scores of the CERAD tests and the total CERAD score in aMCI and AD patients and healthy controls. Multivariate GLM analysis adjusted for age, sex and education shows that diagnosis has a highly significant effect )partial eta squared effect size=0.529( on the CERAD tests )F=31.81, df=12/340 p<0.001(, while tests for between-subject effects show highly significant effects on all tests scores )with effect sizes between 1.728 for WLRecall and 1.161 for constructional praxis(. Pairwise comparisons show significant differences in VFT, BNT, WLM, WLRecall and CERAD total between the three subgroups and that all tests scores significantly decreased from controls
aMCI AD. Constructional praxis, and WLRecognition were lower in AD than in controls and aMCI, without any differences between controls and aMCI.
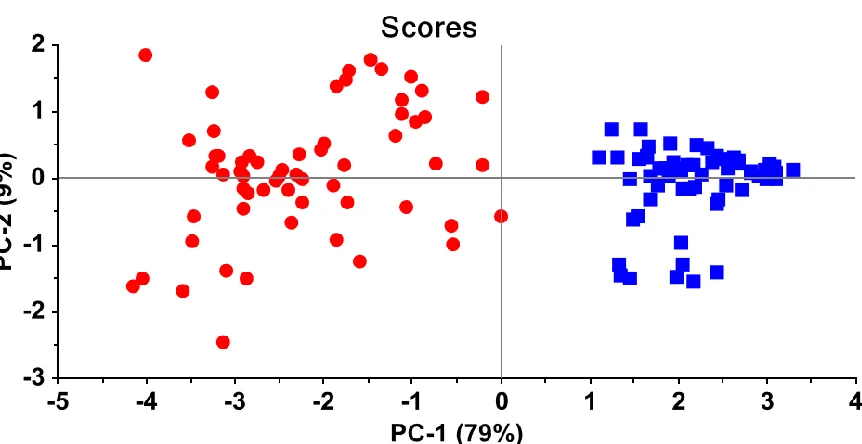
Principal component analysis
be interpreted accurately. This figure shows that AD patients cluster at the right-hand side of the PC plot and that controls cluster at the left-hand side, while there is a large street )boundaries( between both groups.
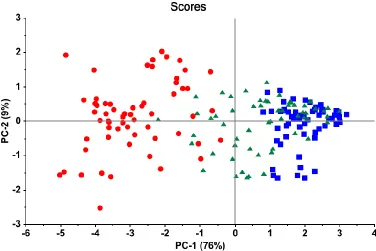
Figure 3 shows the same PC plot but now with inclusion of the aMCI patients. It can be
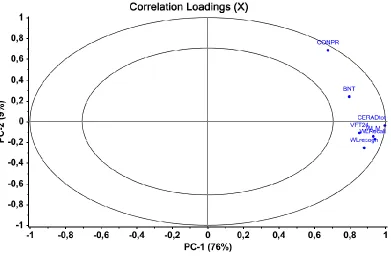
seen that the latter fill in the gap between the controls and aMCI patients. The distribution of the subjects in this 2D plot indicates a continuum of cognitive dysfunction from controls to AD patients. Figure 4 shows the correlation loadings of the CERAD test scores on both PCs
indicating that VFT, WLM, WLRecall, WLrecognition and CERAD total strongly contribute to the differentiation of the classes along PC1, while constructional praxis and BNT contribute to the variability on PC1 but also PC2.
Support Vector Machine
Figure 5 shows the results of SVM with linear kernel performed on the AD patients and
Soft Independent Modeling of Class Analogy )SIMCA(
In order to build a SIMCA model separating AD from HC, we used a training set comprising 50% of the AD and 50% of the control subjects. The test set comprised the remaining 50% controls and AD patients, whereas all aMCI cases were subsequently projected into the AD and HC PCA models. When building the two PCA models surrounding the HC and AD classes we deleted two healthy controls and 1 AD patient from the PCA models )as statistical outliers( and we modeled both classes using 6 PCs. The model-to-model distance was 92.68 indicating a very accurate discrimination of both classes, while all CERAD variables showed significant modeling power for AD and HC. Figure 6 shows the discrimination power of the CERAD
)named aMCI-HC( intruded into the HC class )see Figure 9(, while the classification results show that 10 aMCI patients )named: aMCI-strangers( did not belong to either the AD or HC classes. We have also rerun the analyses with two other sets of input variables, namely the 7 CERAD test scores combined with the Blessed ADL score or with the MMSE score. Those SIMCA analyses yielded similar results.
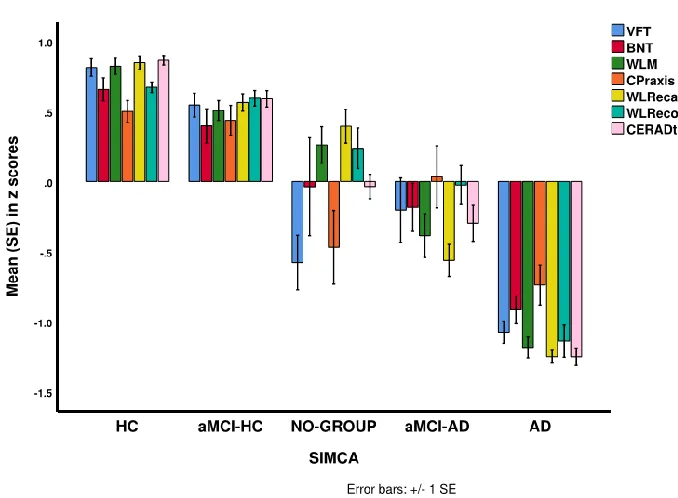
Figure 9 shows the CERAD features of the 3 aMCI subclasses delineated by SIMCA as
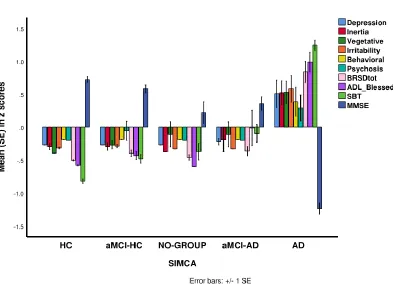
Figure 10 shows the BRSD items, BRSD total, Blessed ADL, SBT and MMSE scores in the 5 study groups and shows that those scores are significantly more disturbed in AD patients than in controls and those allocated to the three aMCI subgroups. Furthermore, no significant differences in any of these rating scale score could be established between the four non-AD subgroups. Figure 11 shows the measurements of FBG, HCO3-, AGAP and AIP in the three new aMCI groups (compared with controls and AD patients, see values in Table 1). Univariate GLM analyses showed significantly lower HCO3- )F=7.29, df=1/177, p=0.008( and higher AGAP )F=7.46, df=1/176, p=0.007( levels in aMCI-AD patients as compared with the other subjects.
Discussion
The first major finding of this study is that, using SIMCA, PCA and SVM, patients with AD are highly significantly separated from healthy controls using CERAD-NP tests and that aMCI is an intermediate group considerably overlapping with healthy controls and less with AD. Our SIMCA results show that the top-3 most dominant features of AD are lowered scores on WLRecall, WLRecognition and BNT. As reviewed in the introduction, there are some studies examining the cognitive profile of AD versus controls showing that the CERAD total score may be used to discriminate AD patients from controls with an area under the receiving operating curve )ROC( of 0.970 )22(. An area under the ROC > 0.95 when bootstrapped may indicate that an accurate prediction can be made )47,48(.
results( into a multivariate decision rule will lead to a better discrimination than using one rating scale alone. In addition, when the new machine learning model is )cross-( validated and shows a validation accuracy of > 95%, the new decision rule has predictive value (47). Nevertheless, the SVM separation of aMCI patients from healthy controls yielded only a very moderate validation accuracy )71.9%(. In the Seo et al. )22( study, an area under the ROC curve of 1.82 is reported for the separation of aMCI from controls with a sensitivity of 79.2% and a specificity of 85.1%. These figures of merit do not allow a predictive classification )47( of aMCI versus controls using the CERAD-NP scores. All in all, these results show that aMCI cannot be successfully discriminated from healthy controls using CERAD-NP test results as input variables.
In our study using a combination of different CERAD-NP tests we found that aMCI and AD were relatively well separated using SVM )validation accuracy: 92.5%( and SIMCA )validation accuracy of 89.17%(. Using SIMCA we found that the top-3 features separating AD from aMCI are in descending order: WLRecall, WLRecognition and WLM, indicating that WLRecall and WLRecognition are the most adequate features to discriminate AD from controls and aMCI patients. In the Seo et al. )22( study, the separation of MCI versus AD using the CERAD total score yielded an area under the ROC curve of 1.86. Nevertheless, these figures of merit do not allow the SIMCA, SVM or ROC models to be used for prediction purposes )47(.
Based on the accuracy of both SVM )100%( and SIMCA )97.2%( separating AD from controls we concluded that those models may be employed to classify unknown cases into AD or the control class. Nevertheless, SVM operates with the assumption that all cases should belong to one of the pre-specified classes and therefore SVM forces aMCI subjects to be classified as AD
)strangers( )47(. In this regard, SIMCA improves precision of the identification process because this technique allows to authenticate AD patients as belonging to the presumed AD class, and to identify unknown subjects as aliens, hybrids or strangers )47(. Therefore, our validated SIMCA models built using the control and AD classes may be used to identify aMCI patients.
The second major finding of our study is that aMCI as diagnosed with Petersen’ criteria )4( consists of three distinct subgroups. Using CERAD-NP scores, SIMCA assigned 68.3% of the patients to the control class )named: aMCI-HC(, 15% to the AD class )named: aMCI-AD(, while 16.6% did not belong to either class )aMCI-strangers(. It should be underscored that all our aMCI subjects scored 1.5 on the CDR Staging Dementia Instrument indicating that they suffered from very mild dementia with mild memory impairments, slight impairments in cummunity affairs without dysfunctions in personal care )45(. As such, an assignment of aMCI patients to the control or AD class indicates that their cognitive profile )but not behavioral symptoms or ADL( is quite similar to that of these target groups, but does not allow to conclude that these subjects may be diagnosed as AD or controls.
The two other aMCI subgroups defined by SIMCA showed a much lower CERAD total score that differed cosiderably from that of controls, namely 1.911 SDs for aMCI-strangers and 1.16 SDs for the aMCI-AD cases. Increasing levels of cognitive impairment in MCI are at-risk factors of AD )15, 49(, indicating that these two SIMCA subgroups may be at increased risk to the develop AD. The main characteristics of the aMCI-stranger subgroup were significantly lower scores on VFT, praxis and naming. As such this subgroup shows more selective deficits in language and fluency, semantic memory and praxis. It could be that this subgroup is a prodromal stage of semantic dementia )50(, which is accompanied by loss of fluent speech and poor category fluency without loss of episodic memory. The second subgroup )aMCI-AD( is clearly a dementia prodrome as the constellation of cognitive dysfuctions observed in these patients resembles that of AD, although with less severity. Once behavioral symptoms develop or personal care deteriorates these aMCI-AD subjects will be diagnosed as AD.
Although we did not measure the Global Deterioration Scale )GDS( for Assessment of Primary Degenerative Dementia )51( it is interesting to apply this staging scale to our SIMCA aMCI subgroups. Thus, the aMCI-HC patients probably belong to GDS stage 2 or very mild cognitive decline, while aMCI-strangers probably belong to GDS stage 3 or mild cognitive decline. Subjects allocated to the aMCI-AD subgroup belong to the transition zone from stage 3 to stage 4 )moderate cognitive decline( which is an early stage dementia.
show impairments on MMSE, SBT and CERAD total of around 1.2 SDs, but not 1.5 SDs, lower than the normative mean. In the current study we detected that a combination of different CERAD-NP features in a SIMCA model is a very adequate method to define a subgroup )aMCI-AD( of patients with a cognitive profile that is reminiscent of AD but cannot be classified as AD because ADL is still intact. Future prospective research in early AD recognition studies should therefore compare the predictive value of our SIMCA decision rule versus the case definitions of SMI, ECMI and LCMI as predictors of AD in larger study groups.
The third major finding of this study is that the SIMCA-derived aMCI-AD subgroup was externally validated by highly increased AGAP and lowered HCO3- values )but not ApoE4, FBG or AIP(. Recently, we reported that increased AGAP and lowered bicarbonate levels are associated with impairments in episodic and semantic memory in AD and aMCI and that interactions between AGAP and ApoE4 increase cognitive decline whereby among ApoE4 carriers, increased AGAP values are associated with increased cognitive impairments )40(. As such, the results of the current study show that increased levels of AGAP are associated with a possible dementia prodrome )aMCI-AD( and, therefore, possibly with the transition of aMCI to AD. Some previous studies reported that lowered bicarbonate levels are associated with confusion, delirium andcognitive and executive impairments )53-55(. One possible explanation is that increased AGAP or lowered bicarbonate levels may have inflammatory and pro-oxidative properties thereby aggravating the neuroinflammatory and neurodegenerative pathways leading to AD (40).
differentiated from controls by SMI and lowered delayed recall. The second subgroup displays signs of mild cognitive decline with lowered fluency and naming as important features and these subjects may be at an increased risk to develop dementia. The third subgroup comprises patients in the transition zone from moderate cognitive decline to early-stage dementia and, therefore, these patients show a dementia prodrome. Figure 12 shows clinical relevance of our SIMCA decision rule: once the clinical diagnosis of aMCI is made using Petersen’s criteria, the clinician may enter the 6 CERAD-NP test results in the SIMCA program, which consequently will classify the aMCI patients in the 3 clinically relevant subgroups. As such, SIMCA may identify aMCI patients who are at risk to develop AD or show an AD prodrome. Therefore, our SIMCA diagnosis may help in the early detection of AD and as a consequence may help to reduce the transition rate from aMCI to AD by targeting relevant and modifiable pathways, including increased AGAP.
Funding
This project was supported by the Chulalongkorn University, Thai Government Fund:
GRB_APS_10_57_30_08
Conflict of interest
The authors have no conflict of interest with any commercial or other association in connection with the submitted article.
All the contributing authors have participated in preparation of the manuscript. The work was designed by ST, IT, TS, SH, MM and CT. Data were collected by TS, CT, PC, ST and IT.
Laboratory analyses were conducted by TS. Statistical analyses were performed by AC and MM.
References
1. Barker WW, Luis CA, Kashuba A, Luis M, Harwood DG, Loewenstein D, et al. Relative frequencies of Alzheimer disease, Lewy body, vascular and frontotemporal dementia, and hippocampal sclerosis in the State of Florida Brain Bank. Alzheimer Disease and Associated Disorders. 2002;16)4(:203-212.
2. Burns A, Iliffe S. Alzheimer's disease. BMJ )Clinical research ed(. 2009 Feb 5;338:b158. 3. World Health Organization: Dementia fact sheet World Health Organization; 2017 [cited 2018 8 September]. Available from: http://www.who.int/en/news-room/fact-sheets/detail/dementia. 4.Petersen RC. Mild cognitive impairment as a diagnostic entity. Journal of Internal Medicine. 2004;256)3(:183-194.
5. Petersen RC, Caracciolo B, Brayne C, Gauthier S, Jelic V, Fratiglioni L. Mild cognitive impairment: a concept in evolution. Journal of Internal Medicine. 2014;275)3(:214-228.
6. Neugroschl J, Wang S. Alzheimer’s Disease: Diagnosis and Treatment Across the Spectrum of Disease Severity. The Mount Sinai Journal of Medicine, New York. 2011;78)4(:596-612.
9. Petersen RC, Smith GE, Waring SC, Ivnik RJ, Tangalos EG, Kokmen E. Mild cognitive impairment: clinical characterization and outcome. Archives of Neurology. 1999;56)3(:303-308. 10. Petersen RC, Negash S. Mild cognitive impairment: an overview. CNS Spectrums. 2008;13)1(:45-53.
11. Mitchell AJ, Shiri-Feshki M. Rate of progression of mild cognitive impairment to dementia--meta-analysis of 41 robust inception cohort studies. Acta Psychiatrica Scandinavica. 2009;119)4(:252-265.
12. Koivunen J, Scheinin N, Virta JR, Aalto S, Vahlberg T, Nagren K, et al. Amyloid PET imaging in patients with mild cognitive impairment: a 2-year follow-up study. Neurology. 2011;76)12(:1085-1090.
13. Buchhave P, Minthon L, Zetterberg H, Wallin AK, Blennow K, Hansson O. Cerebrospinal fluid levels of beta-amyloid 1-42, but not of tau, are fully changed already 5 to 10 years before the onset of Alzheimer dementia. Archives of General Psychiatry. 2012;69)1(:98-106.
14. Jessen F, Wiese B, Bachmann C, Eifflaender-Gorfer S, Haller F, Kolsch H, et al. Prediction of dementia by subjective memory impairment: effects of severity and temporal association with cognitive impairment. Archives of General Psychiatry. 2010;67)4(:414-422.
17. Dubois B, Feldman HH, Jacova C, Dekosky ST, Barberger-Gateau P, Cummings J, et al. Research criteria for the diagnosis of Alzheimer's disease: revising the NINCDS-ADRDA criteria. The Lancet Neurology. 2007;6)8(:734-46.
18. Morris JC, Mohs RC, Rogers H, Fillenbaum G, Heyman A. Consortium to establish a registry for Alzheimer's disease )CERAD( clinical and neuropsychological assessment of Alzheimer's disease. Psychopharmacology Bulletin. 1988;24)4(:641-652.
19. Morris JC, Heyman A, Mohs RC, Hughes JP, van Belle G, Fillenbaum G, et al. The Consortium to Establish a Registry for Alzheimer's Disease )CERAD(. Part I. Clinical and neuropsychological assessment of Alzheimer's disease. Neurology. 1989;39)9(:1159-1165. 20. Welsh K, Butters N, Hughes J, Mohs R, Heyman A. Detection of abnormal memory decline in mild cases of Alzheimer's disease using CERAD neuropsychological measures. Archives of Neurology. 1991;48)3(:278-281.
21. Paajanen T, Hanninen T, Tunnard C, Mecocci P, Sobow T, Tsolaki M, et al. CERAD neuropsychological battery total score in multinational mild cognitive impairment and control populations: the AddNeuroMed study. Journal of Alzheimer's Disease 2010;22)4(:1089-1097. 22. Seo EH, Lee DY, Lee JH, Choo IH, Kim JW, Kim SG, et al. Total scores of the CERAD neuropsychological assessment battery: validation for mild cognitive impairment and dementia patients with diverse etiologies. The American Journal of Geriatric Psychiatry. 2010;18)9(:801-809.
24. Karrasch M, Sinerva E, Gronholm P, Rinne J, Laine M. CERAD test performances in amnestic mild cognitive impairment and Alzheimer's disease. Acta Neurologica Scandinavica. 2005;111)3(:172-179.
25. Sotaniemi M, Pulliainen V, Hokkanen L, Pirttila T, Hallikainen I, Soininen H, et al. CERAD-neuropsychological battery in screening mild Alzheimer's disease. Acta Neurologica Scandinavica. 2012;125)1(:16-23.
26. Aguirre-Acevedo DC, Jaimes-Barragan F, Henao E, Tirado V, Munoz C, Reiman EM, et al. Diagnostic accuracy of CERAD total score in a Colombian cohort with mild cognitive impairment and Alzheimer's disease affected by E280A mutation on presenilin-1 gene. International Psychogeriatrics. 2016;28)3(:503-510.
27. Tunvirachaisakul C, Supasitthumrong T, Tangwongchai S, Hemrunroj S, Chuchuen P, Tawankanjanachot I, et al. Characteristics of Mild Cognitive Impairment Using the Thai Version of the Consortium to Establish a Registry for Alzheimer's Disease Tests: A Multivariate and Machine Learning Study. Dementia and Geriatric Cognitive Disorders. 2018;45)1-2(:38-48. 28. Aniwattanapong D, Tangwongchai S, Supasitthumrong T, Hemrunroj S, Tunvirachaisakul C, Tawankanjanachot I, et al. Validation of the Thai version of the short Boston Naming Test )T-BNT( in patients with Alzheimer's dementia and mild cognitive impairment: clinical and biomarker correlates. Aging & Mental Health. 2018;23:1-11.
29. Selkoe DJ, Hardy J. The amyloid hypothesis of Alzheimer's disease at 25 years. EMBO Molecular Medicine. 2016;8)6(:595-608. PubMed PMID: 27025652.
31. Farrer LA, Cupples LA, Haines JL, Hyman B, Kukull WA, Mayeux R, et al. Effects of age, sex, and ethnicity on the association between apolipoprotein E genotype and Alzheimer disease. A meta-analysis. APOE and Alzheimer Disease Meta Analysis Consortium. JAMA. 1997;278)16(:1349-13456.
32. Qian J, Wolters FJ, Beiser A, Haan M, Ikram MA, Karlawish J, et al. APOE-related risk of mild cognitive impairment and dementia for prevention trials: An analysis of four cohorts. PLoS medicine. 2017;14)3(:e1002254.
33. Schipper HM. Apolipoprotein E: implications for AD neurobiology, epidemiology and risk assessment. Neurobiology of Aging. 2011;32)5(:778-790.
34. Riedel BC, Thompson PM, Brinton RD. Age, APOE and sex: Triad of risk of Alzheimer's disease. The Journal of Steroid Biochemistry and Molecular Biology. 2016;160:134-147.
35. Tangwongchai S, Supasitthumrong T, Hemrunroj S, Tunvirachaisakul C, Chuchuen P, Houngngam N, et al. In Thai Nationals, the ApoE4 Allele Affects Multiple Domains of Neuropsychological, Biobehavioral, and Social Functioning Thereby Contributing to Alzheimer's Disorder, while the ApoE3 Allele Protects Against Neuropsychiatric Symptoms and Psychosocial Deficits. Molecular Neurobiology. 2018;55)8(:6449-6462.
36. Corder EH, Saunders AM, Strittmatter WJ, Schmechel DE, Gaskell PC, Small GW, et al. Gene dose of apolipoprotein E type 4 allele and the risk of Alzheimer's disease in late onset families. Science )New York, NY(. 1993;261)5123(:921-923.
38. Falahati F, Ferreira D, Muehlboeck JS, Eriksdotter M, Simmons A, Wahlund LO, et al. Monitoring disease progression in mild cognitive impairment: Associations between atrophy patterns, cognition, APOE and amyloid. NeuroImage Clinical. 2017;16:418-28.
39. Jefferson AL, Beiser AS, Seshadri S, Wolf PA, Au R. APOE and mild cognitive impairment: the Framingham Heart Study. Age and Ageing. 2015 Mar;44)2(:307-11.
40. Supasitthumrong T, Tunvirachaisakul C., Aniwattanapong D., Tangwongchai S., Chuchuen P., Tawankanjanachot I., Snabboon., Hemrungrojn S., Carvalho A F., Maes M. Peripheral blood biomarkers coupled with the Apolipoprotein E4 genotype are strongly associated with semantic and episodic memory impairments in elderly subjects with amestic mild cognitive impairment and Alzheimer's dementia. Preprints 2019; 2019010296 (doi: 10.20944/preprints201901.0296.v1).
41. McKhann GM, Knopman DS, Chertkow H, Hyman BT, Jack CR, Kawas CH, et al. The diagnosis of dementia due to Alzheimer’s disease: Recommendations from the National Institute on Aging-Alzheimer’s Association workgroups on diagnostic guidelines for Alzheimer’s disease. Alzheimer's & Dementia. 2011 May;7)3(:263-9.
42. Medical technology assessment project committee. The Comparison of the Test Performance Between the MMSE-Thai 2002 and the TMSE for Dementia Screening in the Elderly. Bangkok, Thailand: Thai Geriatric Medicine Institute, Ministry of Public Health; 2008.
43. Blessed G, Tomlinson BE, Roth M. The association between quantitative measures of dementia and of senile change in the cerebral grey matter of elderly subjects. The British Journal of Psychiatry. 1968;114)512(:797-811.
45. Morris JC. The Clinical Dementia Rating )CDR(: current version and scoring rules. Neurology. 1993;43)11(:2412-2414.
46. Folstein MF, Folstein SE, McHugh PR. "Mini-mental state". A practical method for grading the cognitive state of patients for the clinician. J Psychiatr Res. 1975;12)3(:189-98.
47. Al-Hakeim H. A-FS, Aldujaili A., Carvalho AF., Sriswasdi S., Maes M. Development of a novel neuro-immune and opioid-association fingerprint with a cross-validated ability to identify and authenticate unknown patients with major depression: far beyond differntiation, discrimination and classification. Molecular Neurobiology, in press; 2019.
48. Alamprese C, Casiraghi E. Application of FT-NIR and FT-IR spectroscopy to fish fillet authentication. LWT-Food Science and Technology. 2015;63:720-5.
49. Gomar JJ, Bobes-Bascaran MT, Conejero-Goldberg C, Davies P, Goldberg TE, Alzheimer's Disease Neuroimaging I. Utility of combinations of biomarkers, cognitive markers, and risk factors to predict conversion from mild cognitive impairment to Alzheimer disease in patients in the Alzheimer's disease neuroimaging initiative. Archives of General Psychiatry. 2011;68)9(:961-9.
50. Kertesz A, Jesso S, Harciarek M, Blair M, McMonagle P. What is semantic dementia?: a cohort study of diagnostic features and clinical boundaries. Archives of Neurology. 2010;67)4(:483-489.
51. Reisberg B, Ferris SH, de Leon MJ, Crook T. Global Deterioration Scale )GDS(. Psychopharmacology Bulletin. 1988;24)4(:661-663.
53. Dobre M, Gaussoin SA, Bates JT, Chonchol MB, Cohen DL, Hostetter TH, et al. Serum Bicarbonate Concentration and Cognitive Function in Hypertensive Adults. Clinical journal of the American Society of Nephrology : CJASN. 2018;13)4(:596-603.
54. Sozio SM, McAdams-DeMarco M. The Role of Bicarbonate in Cognition: Acidosis May Be Corrosive to the Brain. Clinical journal of the American Society of Nephrology: CJASN. 2018;13)4(:527-8. PubMed PMID: 29567860. Pubmed Central PMCID: 5969456.
Figure 1. Mean )SE( values of the z scores of the CERAD tests and the total CERAD score )CERADtot( in patients with amnestic mild cognitive impairment )aMCI( and Alzheimer’s disease )AD( and healthy controls )HC(.
Figure 4. Correlation loadings of CERAD test scores on principal component )PC(1 and PC2.
Figure 5. Results of Support Vector Machine with all CERAD tests as input variables.
Figure 6. Discrimination power of the CERAD test scores in separating patients with
Alzheimers’s disease from healthy controls.
Figure 9. Mean )SE( values of the z scores of the CERAD tests and the total CERAD score )CERADtot( in patients with Alzheimer’s Disease )AD( and healthy controls )HC( and amnestic mild cognitive impairment )aMCI(, divided into three subgroups.
aMCI-HC: aMCI patients assigned by SIMCA to the HC class aMCI-AD: aMCI patients assigned by SIMCA to the AD class
NO-GROUP: aMCI patients assigned by SIMCA neither to the AD nor the HC class
Figure 10. Mean )SE( values of the z scores of the CERAD tests and the total CERAD score )CERADtot( in patients with Alzheimer’s Disease )AD( and healthy controls )HC( and amnestic mild cognitive impairment )aMCI(, divided into three subgroups.
aMCI-HC: aMCI patients assigned by SIMCA to the HC class aMCI-AD: aMCI patients assigned by SIMCA to the AD class
NO-GROUP: aMCI patients assigned by SIMCA neither to the AD nor the HC class
Figure 11. Mean )SE( values of the z scores of the CERAD tests and the total CERAD score )CERADtot( in patients with Alzheimer’s Disease )AD( and healthy controls )HC( and amnestic mild cognitive impairment )aMCI(, divided into three subgroups.
aMCI-HC: aMCI patients assigned by SIMCA to the HC class aMCI-AD: aMCI patients assigned by SIMCA to the AD class
NO-GROUP: aMCI patients assigned by SIMCA neither to the AD nor the HC class
Figure 12. Indentification by SIMCA of patients with amnestic mild cognitive impairment into three different subgroups using the CERAD tests.
aMCI-HC: aMCI patients assigned by SIMCA to the HC class aMCI-AD: aMCI patients assigned by SIMCA to the AD class
aMCI-strangers: aMCI patients assigned by SIMCA neither to the AD nor the HC class CD: cognitive decline
Diagnosis aMCI according to Petersen criteria + SMI
aMCI-HC Very mild CD
Identify patients with aMCI as: Apply SIMCA models on
CERAD-NP test scores
aMCI-strangers Mild CD
aMCI-AD Mild to moderate CD
Table 1. Demographic, clinical and biomarker data of healthy controls (HC), amnestic mild cognitive impairment (aMCI)and Alzheimer’s disease (AD).
A,B,C : pairwise comparisons between the three study samples
CERAD: The Consortium to Establish a Registry for Alzheimer’s Disease
VFT: Verbal Fluency Test; BNT: Boston Naming Test; WLM: Word List Memory; FBG: Fasting blood glucose; HCO3-: Bicarbonate; AGAP: Anion GAP; AIP: Atherogenic index of plasma
Variables Total n=181 F/X2 df p
HC(n=61)A aMCI(n=60)B AD(n=60)C
Age 68.3 (5.5)B,C 74.8 (6.3)A,C 78.8 (7.1)A,B 42.94 2/178 0.000
Sex (M/F) 11/50 16/44 19/41 3.04 2 0.219
Education (years) 12.3 (5.0)B,C 10.0 (5.5)A,C 6.9 (5.7)A,B 15.17 2/178 0.000
CERAD Total 84.3 (5.9)B,C 72.8 (11.3)A,C 36.9 (10.8)A,B 398.46 2/178 0.000
VFT 21.1 (3.1)B,C 17.5 (4.6)A,C 9.2 (3.9)A,B 149.68 2/178 0.000
BNT 12.1 (2.0)B,C 10.8 (2.6)A,C 7.2 (2.4)A,B 70.93 2/178 0.000
WLM 22.8 (3.1)B,C 19.3 (3.8)A,C 8.6 (4.0)A,B 244.47 2/178 0.000
Constructional praxis 10.3 (1.4)C 9.7 (1.7)C 7.5 (2.5)A,B 34.94 2/178 0.000
WL True Recall 8.5 (1.3)B,C 6.8 (2.0)A,C 1.0 (1.3)A,B 385.10 2/178 0.000
WL Recognition 9.6 (0.9)B,C 8.8 (1.5)A,C 3.5 (3.0)A,B 164.99 2/178 0.000
Any ApoE4 (No/Yes) 52/9 C 52/8 C 26/34 A,B 19.09
2 0.000
FBG (mg/dL) 95.2 (17.9)B,C 102.7 (19.1)A 106.8 (23.6)A 5.00 2/177 0.008
HCO3- (mmol/L) 27.4 (2.8) 26.6 (2.6) 26.3 (3.3) 2.12 2/176 0.123
AGAP (mEq/L) 12.5 (2.4)C 13.1 (2.4) 13.7 (3.2)A 3.16 2/175 0.045
Table 2. Demographic, clinical and biomarker data of patients with amnestic mild cognitive impairment (aMCI)divided into three subgroups according to SIMCA identification
*All results of analyses of variance or contingency analyses with Alzheimer’s Disease patients, controls (see Table 1 for means) and the three aMCI subgroups as explanatory variable.
A,B,C: pairwise comparisons between the three study samples
CERAD: The Consortium to Establish a Registry for Alzheimer’s Disease
VFT: Verbal Fluency Test; BNT:Boston Naming Test; WLM: Word List Memory Variables
Total n=60
F/Χ2* df P
aMCI-HC (n=41)A
aMCI-strangers (n=10)B
aMCI-AD (n=9)C
Age 73.9 (6.0) 75.5 (6.6) 78.0 (6.6) 22.46 4/176 0.000
Sex (M/F) 11/50 16/44 19/41 3.04 2 0.219
Education (years) 11.5 (5.2)B 5.8 (4.7)A 8.0 (5.0) 10.70 4/176 0.000
CERAD Total 78.1 (8.4)B,C 64.1 (6.2)A 58.2 (8.6)A 398.46 4/176 0.000
VFT 19.4 (3.4)B,C 12.3 (3.9)A 14.7 (4.4)A 100.29 4/176 0.000
BNT 11.2 (2.4)C 9.9 (3.4) 9.4 (1.6)A 37.84 4/176 0.000
WLM 20.5 (3.2)C 18.8 (3.0)C 14.2 (3.3)A,B 144.14 4/176 0.000
Constructional praxis 10.1 (1.5)B 8.1 (1.9)A 9.2 (1.5) 20.76 4/176 0.000
WL True Recall 7.5 (1.4)C 6.9 (1.4)C 3.4 (1.2)A,B 280.93 4/176 0.000