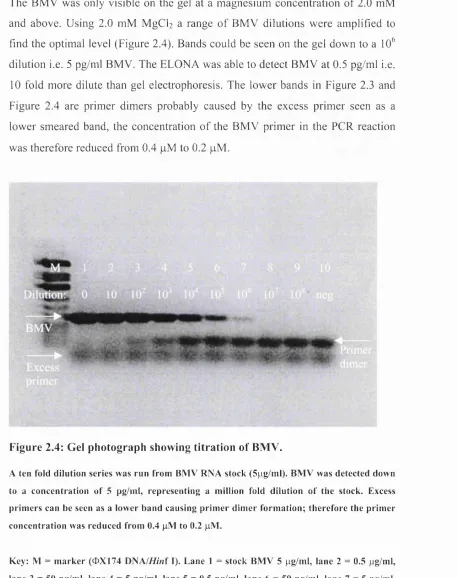
Development and application of nucleic acid
amplification technology (NAT) for the
detection of viruses in donated blood
By
Paul Robert Grant
A thesis submitted to the University o f London
in fulfdm ent o f the requirement fo r the degree o f Doctor o f Philosophy December 2002
Royal Free and University College Medieal School University College London
Windeyer Institute o f Medical Sciences Department o f Virology
46 Cleveland Street London W IT 4JF
ProQuest Number: U643370
All rights reserved
INFORMATION TO ALL USERS
The quality of this reproduction is dependent upon the quality of the copy submitted.
In the unlikely event that the author did not send a complete manuscript and there are missing pages, these will be noted. Also, if material had to be removed,
a note will indicate the deletion.
uest.
ProQuest U643370
Published by ProQuest LLC(2016). Copyright of the Dissertation is held by the Author.
All rights reserved.
This work is protected against unauthorized copying under Title 17, United States Code. Microform Edition © ProQuest LLC.
ProQuest LLC
789 East Eisenhower Parkway P.O. Box 1346
Abstract____________________________________________
Background and Objectives: To reduce the potential for transmission o f hepatitis C virus (HCV) from an RNA positive, anti-HCV negative blood donation, the National Blood Service (NBS) decided to introduce nucleic acid amplification technology (NAT) testing o f blood donations for HCV in England and Wales. The objective o f this thesis was to develop an automated assay using commercial components for the detection o f HCV RNA in blood donations for transfusion, and to validate sample handling and storage procedures.
Studies included in the thesis: The stability o f HCV in the plasma sample was investigated to define the appropriate sample handling and storage conditions needed to preserve HCV RNA in the blood sample before analysis by NAT. HCV RNA was found to be more stable than previously thought, with HCV levels remaining stable for 1 2 0 hours in un-separated whole blood at refrigerated or room temperature. The compatibility o f the Qiagen and Roche reagents were tested using manual assays and automated systems. This work has shown that it is possible to completely automate HCV NAT screening. Alternative techniques for virus detection such as TMA and HCV core antigen were also investigated and PCR was found superior to antigen and equivalent to TMA. The window period o f the HCV infection was further defined in a study o f window phase HCV samples from US plasma donors.
Acknowledgements
I would like to thank my supervisors Richard Tedder and John Barbara for all their helpful guidance and advice, both in the laboratory and writing this thesis. Also Jeremy Garson for helpful discussions in the development o f the quantitative RT-PCR methodology.
I would also like to thank all the other members o f the Virology Department past and present for a friendly work environment, for great help and advice, and the occasional ‘few ales’ especially Phil, Kev, Dave, Chris, Steve and Mark.
I am also very grateful to all o f those who have made these studies possible, especially Frank Krieg-Schneider for letting me play with robots and for all his great help and advice, Rita Sun for helpful advice on matters Amplicor, Alan Kitchen for donor sampling and storage in the stability study, Pat Hewitt for the HCV case details, Richard Bedford and Barbara Cant for definition o f NBS operational procedures and Liz Love, chair o f the NAT steering group which commissioned many o f the studies described in this thesis.
Table of contents
Title P a g e ... 1
Abstract... 2
Acknowledgements...3
Table of C ontents...4
List of Figures... 10
List of T a b les... 13
List of A bbreviations... 15
Collaborative studies presented in this thesis... 18
List of publications arising from this thesis... 19
Chapter 1 Introduction...20
1.1 Blood Transfusion... 20
1.1.1 Development o f blood transfusion, a historical perspective 20 1.1.2 M odem component transfusion...22
1.1.3 Transfusion com plications... 23
1.1.4 Plasma fractionation... 28
1.2 Transfusion transmitted viral infections... 31
1.2.1 History o f transfusion transmitted viral infections...31
1.2.2 Hepatitis C V im s... 35
1.2.3 Hepatitis B vims (HEV)... 41
1.2.4 Human immunodeficiency vims (H IV )... 46
1.3 Screening for viral infections transmitted by transfusion... 50
1.3.1 Introduction o f serological screening assays for viral TT I’s 50 1.3.2 Window phase and residual risk o f T T I...52
1.3.3 Introduction o f NAT testing o f donated blood...54
1.4 NAT M eth od s...57
1.4.1 Polymerase Chain Reaction (P C R )... 58
1.4.2 Transcription mediated amplification (TM A)...62
1.4.3 Nucleic acid sequence based amplification (N A SH A )... 64
1.5 Aims of the T h esis... 68
Chapter 2 General methods and development of
research techniques... 69
2.1 General M ethods...69
2.1.1 Extraction o f viral RNA from plasma using spin columns Qiagen QIAamp Viral RNA purification p ro to c o l...69
2.1.2 Automated extraction o f viral RNA from plasma using the BioRobot 9604 instrument and Qiagen QIAamp96 Viral RNA purification protocol... 70
2.1.3 Automated extraction o f viral nucleic acid from plasma using the BioRobot 9604- Qiagen QIAamp96 Virus purification pro to co l...71
2.1.4 Roche Amplicor HCV test (versions 1.0 and 2 .0 ) ... 72
2.1.5 Roche COBAS Amplicor HCV Monitor test version 2 .0 ... 76
2.1. 6 Roche COBAS AmpliScreen HCV test version 2 .0 ... 77
2.1.7 The Ortho HCV core antigen ELISA assay... 78
2.1.8 The Ortho Trak-C quantitative core antigen assay... 79
2.1.9 The Bayer TMA HCV assay...80
2.1.10 Detection o f PCR products by Enzyme Linked OligoNucleotide Assay (ELO N A )... 82
2.1.11 Detection o f PCR products by agarose gel electrophoresis:... 83
2.2 Development of HCV quantitative PCR with internal control... 85
2.2.1 Introduction... 85
2.2.2 Development o f HCV Quantitative P C R ...8 6 2.2.3 Introduction o f BMV internal control...8 8 2.2.4 Calibration o f an HCV standard with the WHO International HCV Standard...96
2.2.5 Calculation o f HCV level by analysis o f HCV/BMV r a tio ... 99
2.2.6 D iscussion... 103
2.3 Development of HCV genotyping by 5 -NCR sequence analysis... 105
2.3.1 Introduction... 105
2.3.2 Sequence extraction and am plification... 105
Chapter 3 Effects and handling and storage of
blood on stability of HCV R N A ... 108
3.1 Storage of Whole B lood... 108
3.1.1 Introduction... 108
3.1.2 Materials and M ethods...110
3.1.3 R esults...112
3.1.4 D iscussion... 118
3.2 Storage in M inipools...123
3.2.1 Introduction... 123
3.2.2 Materials and m ethods... 123
3.2.3 R esults...124
3.2.4 D iscussion... 127
3.3 Freeze-Thaw Studies...128
3.3.1 Introduction... 128
3.3.2 Materials and m ethods... 128
3.3.3 R esults...129
3.3.4 D iscussion... 130
Chapter 4 Development and characterisation of
NBS automated HCV NAT screening
assays... 132
4.1 Introduction...132
4.1.1 HCV RNA extraction using QIAamp spin colum ns... 134
4.1.2 Roche Amplicor V 1.0...134
4.1.3 Roche Amplicor v 2 .0 ...136
4.1.4 Extraction and amplification m eth o d s... 137
4.1.5 The BioRobot 9604...137
4.1. 6 The COBAS Amplicor A nalyser... 140
4.2 M ethods...142
4.2.1 QIAamp extraction with Amplicor v l.O ... 142
4.2.3 HCV RNA extraction using Qiagen BioRobot 9604
QIAamp 96 viral RNA protocol...143
4.2.4 Detection o f different HCV genotypes... 144
4.2.5 Sensitivity o f the BioRobot QIAamp 96 viral RNA protocol with Amplicor HCV v2.0 using the COBAS Amplicor analyser... 144
4.3 R esu lts... 146
4.3.1 Sensitivity o f Amplicor v l .0 using the QIAamp system for extraction o f HCV RNA...146
4.3.2 HCV sensitivity o f Roche Amplicor v 2 .0 ...148
4.3.3 Sensitivity o f Amplicor v2.0 using the QIAamp system for extraction o f HCV RNA...149
4.3.4 Sensitivity o f the BioRobot 9604 QIAamp 96 viral RNA protocol with Amplicor HCV v2.0 M W P... 150
4.3.5 Sensitivity o f the Amplicor v2.0 assay with BioRobot 9604 RNA extraction to HCV genotypes I to 4 ... 154
4.3.6 Investigation o f sample cross contamination using the B ioR obot...156
4.3.7 Sensitivity o f the BioRobot QIAamp 96 viral RNA protocol with Amplicor HCV v2.0 using the COBAS Amplicor analyser... 156
4.4 Discussion...160
4.5 BioRobot 9604 QIAamp 96 viral RNA extraction with Amplicor HIV Monitor v l .5 ... 164
4.5.1 Introduction...164
4.5.2 M ethods... 164
4.5.3 R esults... 166
4.5.4 D iscussion...168
4.6 BioRobot 9604 QIAamp 96 Virus protocol... 170
4.6.1 Introduction...170
4.6.2 M ethods... 171
4.6.3 R esults... 172
4.6.4 D iscussion...175
4.7.1 Introduction...178
4.7.2 M ethods... 179
4.7.3 R esults... 180
4.7.4 D iscussion...182
4.8 QIAamp 96 Virus protocol with the COBAS AmpliScreen HCV v2.0 - comparison with Amplicor and QIAamp 96 Viral RNA protocols (Four way cross study)... 185
4.8.1 Introduction...185
4.8.2 M ethods... 186
4.8.3 R esults... 187
4.8.4 D iscussion...194
4.9 General Discussion o f development of automated assays...197
Chapter 5 Alternative HCV detection methods...201
5.1 The Bayer HCV TMA a ssa y ... 202
5.1.1 Introduction... 202
5.1.2 M ethods...203
5.1.3 R esults... 203
5.1.4 D iseussion... 208
5.2 Detection of core antigen and quantification of RNA levels in hepatitis C virus pre-seroconversion donations...210
5.2.1 Introduction... 210
5.2.2 M ethods...211
5.2.3 R esults... 212
5.2.4 D iscussion... 216
5.3 The Ortho Trak-C HCV core antigen assay... 220
5.3.1 Introduction... 220
5.3.2 M ethods...221
5.3.3 R esults... 221
5.3.4 D iscussion... 227
Chapter 6 Results of NBS HCV NAT screening...228
6.1.1 Sample collection and pooling... 230
6.2 Sensitivity M onitoring...235
6.2.1 Development o f automated results analysis...237
6.3 Assay performance in routine u s e ... 245
6.4 Results of NAT testing in the N BS... 247
6.5 D iscussion... 249
Chapter 7 General Discussion...252
7.1 Other test system s... 254
7.2 Final Conclusions... 258
List o f R eferences...262
Appendix A: B uffers... 299
List of Figures
Figure 1.1: Reported transfusion transmitted infections in the
UK 1995 to 2001... 27
Figure 1.2: Plasma fractionation - Cohn method ... 29
Figure 1.3: Genomic structure o f FICV...36
Figure 1.4: The hepatitis B genome...42
Figure 1.5: HIV-1 genom e... 46
Figure 1.6: Polymerase Chain Reaction (P C R )...60
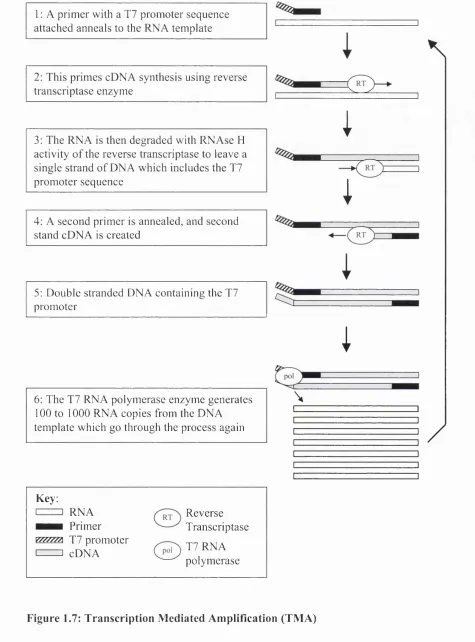
Figure 1.7: Transcription Mediated Amplification (TM A)... 63
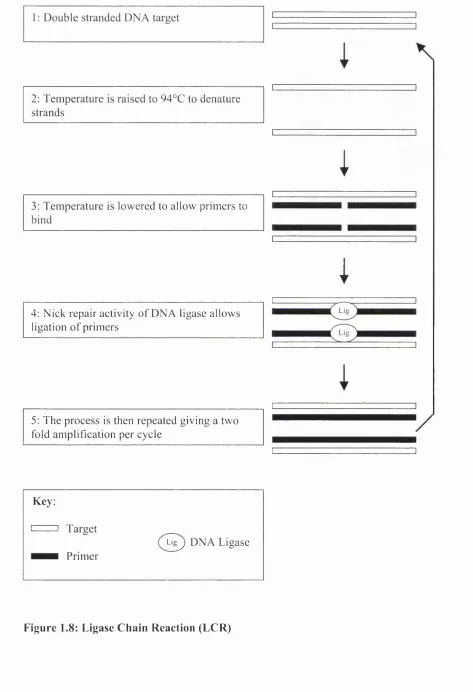
Figure 1.8: Ligase Chain Reaction (L C R )... 65
Figure 1.9: Branched DNA signal amplification... 67
Figure 2.1 : HCV Standard Curve with spin column extraction... 87
Figure 2.2: HCV standard curve with BioRobot extraction...8 8 Figure 2.3: Gel photograph showing effect of magnesium concentration... 89
Figure 2.4: Gel photograph showing titration o f BM V ... 90
Figure 2.5: Effect o f magnesium concentration on HCV standard curve... 91
Figure 2.6: Effect o f MgCL concentration... 92
Figure 2.7: Effect o f M gCh concentration on HCV qPCR... 92
Figure 2.8: Effect o f MgCL concentration on BM V... 93
Figure 2.9: Effect o f dNTP concentration...93
Figure 2.10: Titration o f extracted & non extracted BMV RN A ... 94
Figure 2.11: BMV signal with 1 000 000 copies/ml HCV... 95
Figure 2.12: HCV standard curve with and without BM V...96
Figure 2.13: Calibration o f in house standard ‘X ’ with WHO HCV standard 98 Figure 2.14: Logio HCV BMV ratio for HCV standard curve...99
Figure 2.15: Factors considered before result or comment is displayed... 101
Figure 2.16: Comparison with commercial Roche Monitor assay... 102
Figure 3.1: Comparison o f HCV storage in PPT and EDTA tubes at 4°C and 25°C... 114
Figure 3.2: HCV storage in citrate/EDTA whole blood at 4°C, 25°C and 37°C...116
Figure 4.1: The BioRobot 9 6 0 4 ...139
Figure 4.2: The COBAS Amplicor™ analyser...141
Figure 4.3: The COBAS Amplicor™ analyser components... 141
Figure 4.4: Comparison o f end point sensitivity between the BioRobot and spin column methods...158
Figure 4.5: Comparison o f the HCV optical densities (OD) at the limit o f detection between the MWP and COBAS versions o f HCV Amplicor v2.0...159
Figure 4.6: Effect o f standard and modified thermal cycling parameters on OD4 5 0 in the Roche HIV-1 Monitor v l.5 assay... 166
Figure 4.7: Sensitivity o f a modified version o f the Roche HIV-1 Monitor v l.5 assay using a Qiagen BioRobot 9604 extraction... 168
Figure 4.8: Comparison o f Qiagen BioRobot extraction methods with Manual and Automated Roche Amplicor... 174
Figure 4.9: Sensitivity o f AmpliScreen HCV Multiprep and standard m ethods... 182
Figure 4.10: Sensitivity o f BioRobot Virus protocol with Amplicor and AmpliScreen...189
Figure 4.11 : Sensitivity o f BioRobot viral RNA protocol with Amplicor and AmpliScreen... 189
Figure 4.12: HCV absorbance values for different assay com binations 192 Figure 4.13: Internal Control absorbance values for different assay combinations...193
Figure 5.1: Comparison o f detection o f HCV genotypes 1 -4 ... 205
Figure 5.2: Signal to cut-off ratio o f 100 HCV reactive m inipools... 207
Figure 5.3: Signal to cut-off ratio o f 100 HCV un-reactive m inipools... 207
Figure 5.4: Comparison between Monitor and in house HCV qPCR assays 212 Figure 5.5: Line fit plot o f signal to cut off against HCV RNA level... 213
Figure 5.6: Histogram o f signal to cut off ratios from samples below the cut-off o f the antigen assay... 214
Figure 5.7: Ortho Trak-C HCV antigen standard curve... 222
Figure 5.8: Effect o f wavelength on standard cu rve...223
Figure 5.9: Relationship between HCV core antigen and HCV R N A ... 224
Figure 5.11: Stability o f HCV core antigen... 225
Figure 5.12: Comparison o f sensitivity between first generation and Trak-C antigen assays in detection o f HCV RNA positive window phase samples...226
Figure 6.1: Cross-pooling o f a 96 well archive plate with a single positive 232 Figure 6.2: Cross pooling o f a 96 well archive plate with two positives... 233
Figure 6.3: Cross pooling o f a 96 well archive plate with two positives... 234
Figure 6.4: Relationship between IC OD and HCV sensitivity...236
Figure 6.5: COBAS analyser raw data text file... 239
Figure 6.6: A plot o f the COBAS OD results for a valid BioRobot ru n ...240
Figure 6.7: A plot o f the COBAS OD results for a failed BioRobot ru n ...241
Figure 6.8: Change in mean internal control OD before and after the change o f assay from RNA/Amplicor to Virus/AmpliScreen at the Brentwood NAT laboratory... 243
Figure 6.9: Change in mean 100 lU/ml control OD before and after the change o f assay from RNA/Amplicor to Virus/AmpliScreen at the Brentwood NAT laboratory... 244
List of Tables
Table 1.1: Blood group compatibilities... 24 Table 2.1: Interpretation o f Amplicor MWP results...75 Table 2.2: Interpretation o f equivocal Amplicor MWP results... 75 Table 2.3: Primer and probe sequences...8 6 Table 2.4: Calibration o f the in house standard ‘X ’... 97 Table 2.5: Primers used for HCV 5’NCR sequence an aly sis...106 Table 3.1: Effect o f tube type and storage temperature on stability o f
HCV RNA in b lo o d ...113 Table 3.2: Effect o f storage temperature on stability o f HCV RNA in
citrate/EDTA whole blood... 115 Table 3.3: Effect o f first 12 hours storage temperature on citrate/EDTA
whole blood stored at 4°C thereafter...117 Table 3.4: Effect o f temperature on stability o f HCV RNA in EDTA whole
b lo o d ...117 Table 3.5: Effect o f storage temperature and antibody status on stability o f
HCV RNA in individual samples and spiked into 96 donation
m inipools... 125 Table 3.6: HCV RNA level in each well and decline after each freeze thaw
cycle... 129 Table 4.1: Effect o f carrier RNA concentration on HCV detection sensitivity
with the QIAamp spin column protocol and Roche Amplicor v l.O . 147 Table 4.2: Sensitivity o f QIAamp spin column protocol with Amplicor vl.O... 148 Table 4.3: Sensitivity o f Roche Amplicor v2.0 performed to manufacturer’s
instructions... 148 Table 4.4: Sensitivity Amplicor v2.0 with QIAamp spin column RNA
extraction... 149 Table 4.5: Sensitivity o f the standard BioRobot QIAamp 96 viral RNA
protocol compared to the spin column pro to co l... 150 Table 4.6: Modifications to BioRobot QIAamp 96 viral RNA elution... 151 Table 4.7: Investigation o f the vacuum steps o f the QIAamp protocol using
Table 4.8: Modification o f the BioRobot QIAamp 96 viral RNA standard
protocol wash steps...153
Table 4.9: Comparison between the sensitivities o f the modified and standard BioRobot QIAamp 96 viral RNA protocols... 154
Table 4.10: Calculation o f copy number by Poisson distribution... 155
Table 4.11: Sensitivity o f detection of HCV genotypes 1-4... 155
Table 4.12: Sensitivity o f the modified BioRobot viral RNA protocol with COBAS and MWP Amplicor HCV v 2 .0 ...157
Table 4.13: Modification to manufacturer’s HIV-1 Monitor v l.5 RT-PCR cycling conditions...165
Table 4.14: Sensitivity o f Qiagen BioRobot 9604 with a modified Roche HIV-1 Monitor vl.5 assay...167
Table 4.15: Sensitivity o f BioRobot Virus protocol with COBAS and MWP Amplicor HCV v2.0...173
Table 4.16: Probit analysis... 173
Table 4.17: Sensitivity o f BioRobot Virus protocol with HBV P C R ...175
Table 4.18: Calculation o f PCR copy number giving 95% detection for HCV and H B V ... 177
Table 4.19: Comparison between Multiprep and Standard AmpliScreen sample preparation procedures... 180
Table 4.20: Sensitivity o f AmpliScreen HCV Multiprep and standard methods...181
Table 4.21 : Sensitivity...188
Table 4.22: Probit analysis showing 95% and 50% limits o f detection for the four assay combinations... 190
Table 4.23: Average HCV and IC OD values for the four assay combinations... 190
Table 5.1: Sensitivity o f the TMA assay with HCV genotypes 1 to 4 ... 204
Table 5.2: 95% limit o f detection by probit analysis...205
List of abbreviations
A absorbance
ACD acid citrate dextrose
AIDS acquired immune defieiency syndrome
AL Qiagen lysis buffer
ALT alanine aminotransferase
AMY avian myoblastoma virus
AST aspartase aminotransferase
Av-HRP avidin - horse radish peroxidase eonjugate
AVL Qiagen viral lysis buffer
AW Qiagen wash buffer
AZT 3 '-azido-3 '-deoxythymidine
bDNA branehed deoxyribonucleie aeid
BMV brome mosaie virus
bp base pair
BPL Bio Products Laboratory
BVDV Bovine diarrhoea virus
CBER Center for Biologies Evaluation and Research
CDC Centers for Disease Control and Prevention
cDNA complementary DNA
Cl confidence interval
CMV cytomegalovirus
CPDA-1 citrate phosphate dextrose adenine-one (anticoagulant)
cpm counts per minute
CPMP Committee for Proprietary Medieinal Products
cps counts per seeond
CV coefficient o f variation
DNA deoxyribonucleic acid
dNTP deoxynucleoside triphosphates
DROG donor recipient outcome group (NBS)
DTT dithiothreitol
EBV Epstein-Barr virus
EDTA ethylenediaminetetraacetate
EIA enzyme immunoassay
ELISA enzyme-linked immunosorbent assay
ELONA enzyme-linked oligonueleotide assay
EPP exposure prone proeedure
FDA Food and Drug Administration
FFP fresh-frozen plasma
FRET fluoreseence resonanee energy transfer
g gram
g gravity
GVHD graft-versus-host disease
HAART highly active antiretroviral therapy
HAY hepatitis A virus
HBIG Elepatitis B immunoglobulin
HBc hepatitis B core antigen
HBV hepatitis B virus
HCV hepatitis C virus
HIV-1 human immunodeficiency virus type 1
HIV-2 human immunodeficiency virus type 2
HTLV-I human T-lymphotropic virus type I
HTLV-II human T-lymphotropic virus type II
HVR hyper variable region
IC Internal control
IFN interferon
Ig immunoglobulin
IND investigational new drug
1RES internal ribosome entry site
ISDR Interferon sensitivity determining region
lU International Unit
IVDU Intravenous drug user
kb kilobase
kDa kilodalton
L litre
LAN local area network
LAV lymphadenopathy associated virus
LCR ligase chain reaction
LDL low density lipoprotein
m metre
M molar
mA milli ampere
MHC major histocompatibility complex
min minute
MAb monoclonal antibody
mol mole
MRC medical research council
mRNA messenger RNA
MWP microwell plate
n number
NA not applicable
NAT nucleic acid amplification technology
NANB Non A non B hepatitis
NaOH Sodium hydroxide
NBA National blood authority
NBS National blood service
NCR noncoding region
NGI National Genetics Institute
NHIG normal human immunoglobulin
NIBSC National Institute o f Biological Standards
NIH National Institutes o f Health
NJ neighbour joining
NLBTC North London blood transfusion centre
NRTI nucleoside analogue reverse transcriptase
NS non structural
NT not tested
OPD o-phenylenediamine
P probability
PBMC(s) peripheral blood mononuclear cell(s)
PBS phosphate-buffered saline
PC personal computer
PCR polymerase chain reaction
PEG polyethylene glycol
PEI Paul Ehrlich Institute
pH negative logarithm o f hydrogen ion activity
PELS public health laboratory service
PPT plasma preparation tube
PTP post transfusion purpura
QC quality control
qPCR quantitative polymerase chain reaction
r correlation coefficient
RFLP restriction fragment length polymorphism
RIA radioimmunoassay
RIBA recombinant immunoblot assay
RNA ribonucleic acid
rpm revolutions per minute
RSP robotic sample processor
RT reverse transcriptase
RT- PCR reverse transcriptase- polymerase chain reaction
KTth pol recombinant Thermus thermophilus polymerase
SD standard deviation
S/D solvent/detergent
SH serum hepatitis
SHOT serious hazards o f transfusion
SVR sustained virological response
Taq Thermus aquaticus
TRALI transfusion-related acute lung injury
Tris tris(hydroxyethyl) aminomethane
TMA Transcription-mediated amplification
TMB 3,3 \5 ,5 ’-tetramethylbenzidine
TTA tris tween azide
TTI transfusion transmitted infection
UCL University College London
UK United Kingdom
UNO uracil-N-glycosylase
US United States
UV ultraviolet
v-CJD Variant Creutzfeldt-Jakob disease
VLDL very low density lipoprotein
VZIG Varicella zoster immunoglobulin
Collaborative studies included in this thesis_____________
While most o f the work presented in this thesis is my own, some collaborative studies have been included where the work o f others is presented. These studies are as follows:
Chapter 3.1 Storage o f Whole Blood:
The studies described here were carried out in collaboration with NLBTC where Dr. Alan Kitchen performed blood storage and sampling.
Chapter 3.2 Storage in Minipools:
This study was performed in collaboration with BPL where Dr. Cate Sims carried out the storage and sampling.
Chapter 3.3 Freeze thaw studies:
This study was performed in collaboration with the Brentwood blood centre where Steve Tassen carried out the freeze thaw cycling and sampling.
Chapter 6: Results o f NBS HCV NAT screening:
List of publications arising from this thesis
Grant PR, Kitchen A, Barbara JA, Hewitt P, Sims CM, Garson JA, Tedder RS: Effects o f handling and storage of blood on the stability o f hepatitis C virus RNA: Implications for NAT testing in transfusion practice. Vox Sang 2000; 78:137-142
Grant PR , Sims CM, Krieg-Schneider F, Love EM, Eglin R, Tedder RS: Automated screening o f blood donations for hepatitis C virus RNA using the Qiagen BioRobot 9604 and the Roche COBAS HCV Amplicor assay. Vox Sang 2002; 82:169-176
Grant PR, Sims CM, Tedder RS: Quantification o f HCV RNA levels and detection o f core antigen in donations before seroconversion. Transfusion 2002; 42:1032-1036
Chapter 1
Introduction
1.1 B lood T ran sfusion
1.1.1 Development of blood transfusion, a historical perspective
The first blood transfusions in man were documented in the 17^*^ century. In 1667 Jean-Baptiste Denis in France and Richard Lower and Edmund King in England transfused the blood from a sheep and a calf into men as a cure for madness (King and Lower, 1667). A few years later after several deaths the practice was banned throughout most o f Europe. Transfusions in humans were not carried out for another 150 years.
In the early 19^^ century James Blundell an obstetrician at G uy’s and St. Thom as’s hospitals in London noted the high mortality rate from haemorrhage in women giving birth and thought about replacing the lost blood. He was also against the idea o f transfusing animal blood into humans, thinking that only human blood should be given to humans. In December 1818 he carried out a blood transfusion in a patient with internal bleeding using blood collected from several assistants (Blundell, 1818). Although the patient later died, Blundell carried out transfusions in other patients o f which around h alf survived, and his efforts led to a revival o f interest in the technique.
AB, this reacted with plasma from both groups A and B (Von Decastello and Sturli, 1902). Landsteiner’s blood grouping system was largely ignored for many years but he was later recognised for his discovery when in 1930 he was awarded the Nobel Prize for Medicine. Landsteiner later discovered the rhesus blood group (Rh) in 1940.
In the early 1900’s blood transfusions were carried out directly by stitching the blood vessels between donor and recipient together, but later the technique was improved by the use o f needles and rubber tubing with pumping apparatus. A major problem with this method was blood clotting, which occurred after around three to five minutes, blocking the tubing and preventing further transfusion. It was not until 1915 that the American physician Richard Lewisohn published the results o f his experiments with the anticoagulant sodium citrate (Lewisohn, 1915). The anticoagulant properties o f sodium citrate had been described in 1914 but at concentrations that were toxic in humans. Lewisohn had experimented with the concentration and found that a 0.2% solution o f sodium citrate prevented clotting and was not toxic to the patient. However it was noted that febrile reactions occurred in around 1 0% o f transfused patients and this was thought to be caused by the citrate anticoagulant. It was several years before the cause o f these reactions was found to be bacterial endotoxins remaining after autoclaving o f solutions and equipment (Seibert, 1923).
A year after Lewisohn described sodium citrate Rous and Turner noted that haemolysis o f the red cells would occur after a week in the anticoagulant. However the addition o f a dextrose solution to the anticoagulated blood would keep the red cells intact for up to four weeks (Rous and Turner, 1916a; Rous and Turner, 1916b).
containing anticoagulant and this blood was then transfused into the patient. This arrangement continued until World War II when it was realised that more blood would be needed to treat the expected number o f casualties. Four blood banks were set up on the outskirts o f London where blood was collected and stored in refrigerators. Later the MRC estimated that the four centres collected and distributed over 6 8 500 gallons o f blood during the entire course o f the war.
It was also during World W ar II that the transfusion o f blood components, rather than whole blood became common. Doctors had noted during World War I that patients could die from shock due to the collapse o f the circulatory system even after modest losses o f blood. Experiments had been performed to try to increase the blood volume with artificial substitutes before it was shown that plasma could be used effectively to treat these patients. With America set to enter World War II it was clear that whole blood could not survive the journey across the Atlantic, but it was noted that when blood was stored for several hours it separated into three layers, the red cells at the bottom, a thin layer o f white cells and platelets called the huffy coat and the top layer o f plasma. The plasma could be stored for several weeks and did not require blood typing before transfusion.
1.1.2 Modern component transfusion
Today when blood donations are collected they are separated into blood components, i.e. red cells, platelets and plasma. In the UK the whole blood unit is filtered to remove the leucocytes (leucodepletion), the blood pack is then centrifuged and the components are collected into individual packs via linking tubes. The different blood components are then used to treat different conditions.
expanders such as saline solution to increase the volume o f the blood, thereby avoiding shock.
The platelet component may be used to treat microvascular bleeding. Platelets may either be recovered from the huffy coat o f whole blood donations, where the huffy coats from four units o f whole blood are pooled to give one unit o f platelets. Alternatively platelets may be derived from apheresis, a process where platelets or plasma are removed from the donor’s blood and the red cells are returned to the donor.
The plasma component is used in patients who have suffered massive blood loss and multiple transfusions. In these cases where the entire volume o f the blood has been lost and replaced the coagulation factors will be lost, leading to further bleeding. Fresh frozen plasma must be given in these cases, or cryoprecipitate, (which is rich in fibrinogen).
1.1.3 Transfusion complications
Serious hazards of transfusion (SHOT) reporting
Acute haemolytic transfusion reaction
This can occur with a one in three chance when ABO group incompatible red cells are transfused. The compatible blood groups are shown in Table 1.1. The recipient’s anti-A or anti-B antibodies can lyse the red cells that are transfused. The lysed red cells release haemoglobin, which damages the kidneys causing acute renal failure. The cell membrane fragments activate complement causing disseminated intravascular coagulation (DIG).
Table 1.1; Blood group compatibilities
Recipient
i
o
Q
A B AB 0
A Yes No Yes No
B No Yes Yes No
AB No No Yes No
0 Yes Yes Yes Yes
Blood group O is known as the universal donor because there is no anti-0, so group O cells will not be destroyed by any group. Group AB is known as the universal recipient because it contains neither anti-A nor B. The worst haemolytic reaction occurs in group O patients receiving o f group A red cells.
Bacterial contamination
Transfusion related acute lung injury (TRALI)
TRALI is a severe post transfusion reaction caused by antibodies in the donor’s plasma reacting with leucocytes in the patient. This condition occurs within one to six hours o f a plasma containing transfusion and is fatal in 6-10% (Engelfriet and Reesink, 2001). The symptoms include chills, fever, non-productive cough and breathlessness. In most cases o f TRALI the donor will be a multiparous woman (Popovsky and Davenport, 2001).
Fluid overload
This occurs when too much fluid is transfused or the transfusion is too rapid, it can lead to pulmonary oedema and acute respiratory failure or acute left ventricular failure. Fluid overload is a particular risk with albumin solutions and in patients with chronic anaemia who may be hypervolaemic even before any transfusion.
Severe allergic reaction and anaphylaxis
These are rare but possibly life threatening conditions, caused by re-exposure to allergens in transfusions. If the patient has a severe IgA deficiency, anaphylaxis can occur when they are exposed to IgA in a transfusion.
Delayed haemolytic reaction
Transfusion-associated graft-versus-host disease (TA-GvHD)
This is caused by transfused T-lymphocytes, which recognise the host as foreign. It can occur when the patient is immuno-compromised but has also occurred in immuno-competent patients receiving donations from relatives. It is almost always fatal and is not prevented by leucodepletion, however it can be prevented by gamma-irradiation o f the donation (Williamson, 1998).
Post transfusion purpura (FTP)
This is caused by platelet specific alloantibodies, and is potentially fatal. It is more usually found in female patients who develop a low platelet count and bleeding about 5-9 days after a red eell or platelet transfusion (Mueller-Eckhardt,
1986).
Transfusion transmitted infections
The three major transfusion transmitted infections; hepatitis C virus (HCV), hepatitis B virus (HBV) and human immunodeficiency virus (HIV) are discussed in section 1.2. Treponema pallidum is also screened for by serological testing in all blood donations. Human T-lymphotropic virus (HTLV) type I and II screening by serology has recently been introduced (July 2002). Cytomegalovirus (CMV) screening is carried out on donations in special circumstances such as donations for premature infants and CMV seronegative bone marrow allograft recipients in which primary CMV infection can be fatal. W ith leucodepletion the risk o f CMV and HTLV infection is reduced, as these viruses are mostly cell associated.
Bacterial contamination o f blood can cause serious or fatal reactions as discussed above, cryophilic strains such as Pseudomonas fluorescens or Yersinia enterocolitica can proliferate in red cell packs in refrigerated storage (McDonald
contamination with Staphylococci present on donor skin, so they cannot be stored for more than five days.
A total o f 38 transfusion-transmitted infections were reported to SHOT between 1995 and 2001 (Figure 1.1), of these 22 (58%) were bacterial, six o f which were fatal. The only other fatal infection was from malaria. Interestingly only two cases of post transfusion HCV were reported during this period, and yet it is HCV that has been the infection targeted for NAT screening.
M alaria (1 )-x ^ HTLV-I (1)
H A V (1) H C V (2)
HIV (3)
HBV (9)
Bacteria (22)
Figure 1.1: Reported transfusion transmitted infections in the UK 1995 to 2001.
D ata collected from 1995 to 2001 and published in SHOT annual report for
2000 - 2001 (A sher et al., 2002). N um ber o f cases shown in b rackets. T here m ay have been under reporting o f cases before SHOT reporting began in
1.1.4 Plasma fractionation
During World War II with plasma being shipped across the Atlantic from the USA to the allied front in Europe, an American protein chemist Edwin Cohn began work on purifying the proteins in plasma. He knew o f the value of plasma transfusion as an anti-shock treatment for soldiers wounded in battle, but that it could easily become contaminated with bacteria. He also knew that the plasma was made up o f several proteins and thought that if these could be purified they might also confer the anti-shock properties o f whole plasma.
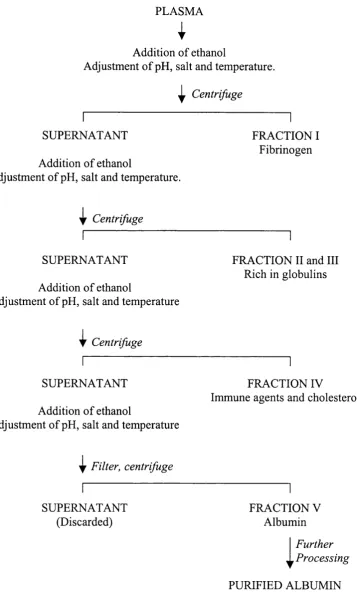
Cohn used ethanol to precipitate the plasma proteins and by adding the ethanol in several stages, each time adjusting the temperature, salt content and pH, different protein fractions could be extracted from the plasma. This became known as the Cohn method o f plasma fractionation (Cohn et a l, 1946), (Figure 1.2).
During his studies Cohn determined that the first fraction (I) consisted mainly o f fibrinogen but also some factor VIII. Fractions II and III contained immunoglobulins, and fraction IV contained cholesterol and immune agents. It was the final fraction (V) that was o f most interest as it contained albumin. This protein could be further purified and when injected into shock victims had the capacity to draw fluid into the blood vessels from the surrounding tissues, thereby increasing the volume o f the blood. The benefits o f the albumin solution produced at Cohn’s Harvard laboratory were first shown in treatment o f casualties after the attack on Pearl Harbour in December 1941. After this the production o f albumin on an industrial scale was initiated at several pharmaceutical companies.
PLASMA
I
Addition o f ethanol
Adjustment o f pH, salt and temperature.
^ Centrifuge
SUPERNATANT
Addition o f ethanol
Adjustment o f pH, salt and temperature.
FRACTION I Fibrinogen
i|r Centrifuge
SUPERNATANT
Addition o f ethanol
Adjustment o f pH, salt and temperature
FRACTION II and III Rieh in globulins
I
CentrifugeSUPERNATANT
Addition o f ethanol
Adjustment o f pH, salt and temperature
FRACTION IV
Immune agents and cholesterol
^ Filter, centrifuge
SUPERNATANT (Discarded)
FRACTION V Albumin
i
Further ProcessingPURIFIED ALBUMIN
Apart from the production o f albumin, modem plasma fractionation is probably best known for the production o f anti-baemopbilic factors such as factor VIII which is deficient in haemophilia A, and factor IX which is deficient in haemophilia B. There are also a number o f other clotting factors that can be used to treat other disorders such as von W illebrand’s disease.
The other plasma products are immunoglobulins, which may be used intravenously in the treatment o f immunological disorders such as immune
cytopaenias and primary hypogammaglobulinaemia. Normal human
immunoglobulin (NHIG) and specific immunoglobulin are also used intramuscularly in the prevention o f infection by passive immunisation in situations when a vaccine cannot be used or in combination with a vaccine.
NHIG may be used to give short-term protection against hepatitis A virus (HAY) in travellers and contacts o f HAY cases, protection against measles in immuno compromised patients coming into contact with measles and in pregnant women who come into contact with rubella.
1.2 T ran sfu sion tran sm itted viral infections
Many infections can be blood borne but will not usually be transmitted by transfusions because they cause obvious illness which precludes donation or because the viraemia is only transient. Infections that cause most transfusion transmitted infections (TTI’s) are generally asymptomatic or subclinical with long lasting viraemia and which are stable in stored blood and prevalent in the population such as HBV, HCV and HIV.
The three main viruses associated with transfusion transmission are described in the following sections. Although these are not the only viruses that are transmitted by transfusion they are considered the most clinically important.
1.2.1 History of transfusion transmitted viral infections
The infectious nature o f hepatitis has long been known, with infectious hepatitis being described by Hippocrates. Other outbreaks o f hepatitis have been described with terms such as ‘epidemic catarrhal jaundice’. It was thought that this disease was transmitted by contaminated food or water, airborne or spread by biting insects.
Hepatitis associated with blood has been described more recently; in 1883 an outbreak o f hepatitis among shipyard workers in Bremen was described that was caused by inoculation with smallpox vaccine containing glycerated human lymph (Lurman, 1885). More cases o f this disease occurred in the early 20th century when non-sterilised needles were used for repeated injections in large numbers o f patients such as salvarsan therapy for syphilis.
largest outbreaks occurred in World War II troops who had received yellow fever vaccine containing human serum (Findlay et a l, 1944). These cases became known as ‘homologous serum jaundice’ (Ministry o f Health, 1943) or ‘serum hepatitis’ and it was recognised that this was a different type o f hepatitis than the ‘infectious hepatitis’ that was food borne or caused by close contact with jaundiced patients. The terms hepatitis A and hepatitis B were introduced in 1947 to distinguish between the short incubation period infectious hepatitis (A) and the longer incubation period serum hepatitis (B); (MacCallum, 1947). In the following years it had become suspected that post transfusion hepatitis had a viral cause.
The distinction between the two types o f hepatitis was defined in a study o f the children at the Willowbrook State School (Krugman et a l, 1967; Krugman and Giles, 1970). They isolated two strains, which they called MS-1 and MS-2. These were isolated from the same patient with MS-1 being taken during an attack o f infectious type hepatitis and MS-2 being taken during a second episode o f hepatitis occurring six months later and resembling type B hepatitis. The first isolate MS-1 caused hepatitis with a short incubation period averaging 32 days after oral or parenteral exposure. The second isolate MS-2 caused hepatitis with a long incubation period o f approximately 65 days after a parenteral exposure and 98 days after an oral exposure.
The agent responsible for serum or type B hepatitis began to be elucidated with the discovery o f an antigen ‘in foci o f hepatic parenchymal cells’ by Prince and colleagues (Prince et a l, 1964). Further evidence was found by Blumberg and colleagues when they discovered an antigen in the blood o f an Australian Aborigine that precipitated with antibodies in the serum from a haemophiliac, they named this Australia antigen (Blumberg et a l, 1965). In the original paper Blumberg postulated that Australia antigen was linked to leukaemia, but subsequently showed a link with hepatitis (Blumberg et a l, 1967).
showed that antibody to SH antigen could be found in multiply transfused patients. Prince later proved that the SH antigen and the Australia antigen were similar or identical (Prince, 1968b). The Australia or SH antigen is now known to be the surface protein o f HBV and has been re-named hepatitis B surface antigen (HBsAg).
The viral source o f the Australia antigen, hepatitis B virus was identified by Dane and colleagues in 1970 (Dane et a l , 1970). The 42 nm viral particle was distinguished from the 22 nm spherical or filamentous forms o f HBsAg using immune electron microscopy on sera from patients with the Australia antigen, and became known as the Dane particle.
The viral cause o f type A hepatitis was discovered in 1973, by immune electron microscopy, in the stools o f volunteers who had been inoculated with the MS-1 strain o f HAY (Feinstone et a l, 1973). The 27 nm particles were associated with an antigen allowing the development o f a screening test. Look back studies showed that HAY was not strongly associated with transfusion transmission (Feinstone et a l, 1975; Dienstag et a l , 1977; Stevens et a l, 1978).
Although the introduction o f HBsAg testing dramatically reduced the level of post transfusion hepatitis (Alter et a l, 1972), there were still cases that were not caused by either HAY or HBY. Studies carried out on cases o f post transfusion hepatitis with blood screened for HBsAg showed that up to 90% o f these cases were not due to HAY or HBY, but were due to other infectious agents as yet undiscovered (Prince et a l , 1974; Feinstone et a l , 1975; Alter et a l , 1975; Dienstag et a l , 1977).
Although the term type C hepatitis was suggested (Prince et a l, 1974) it was thought that there may be more than one causative agent and therefore these became known as non-A non-B (NANB) hepatitis.
a l, 1990), and in September 1991 screening for anti-HCV was introduced in the NBS (MacLennan et a l, 1994).
A major transfusion transmitted infection crisis had hit the blood services o f the world in the 1980’s. Acquired immunodeficiency syndrome (AIDS) was first recognised in 1981 as a cluster o f eases o f Pneumocystis carinii and Kaposi’s sarcoma in young homosexual men (Gottlieb et a l , 1981; M asur et a l, 1981; Siegal et a l, 1981; CDC, 1981). These diseases were not usually associated with young and otherwise healthy people, and at first the new condition was associated with the lifestyle o f these homosexual men. When AIDS eases began to be found among injecting drug users (Gold et a l, 1982), haemophiliacs (Davis
et a l, 1983) and transfusion recipients (Jett et a l, 1983; Curran et a l , 1984; Jaffe
et a l , 1984) an infectious agent began to be suspected (Francis et a l , 1983).
In 1983 a French group isolated a virus related to human T-cell lymphotropic virus (HTLV) from a patient with AIDS, they named this virus lymphadenopathy associated virus (LAV); (Barré-Sinoussi et a l, 1983). Further evidence came a year later when Gallo and colleagues, who had first described HTLV, also isolated a virus from AIDS patients that they called HTLV-III (Popovie et a l,
1.2.2 Hepatitis C Virus
Hepatitis C vims was first described in 1989 by Choo and colleagues at Chiron Corporation (Choo et a l, 1989; Kuo et a l , 1989). Due to difficulties isolating the vims by more conventional methods Choo and colleagues decided to try to isolate the vims from the acute phase semm o f a chimpanzee that had been infected with NANB. The nucleic acid was isolated from the semm, reverse transcribed and the cDNA library was cloned into a bacteriophage expression vector. The cDNA library was then screened with a series o f NANB sera and negative controls, and a clone designated 5-1-1 was isolated and shown to hybridise with a single strand positive sense RNA o f around 10 000 nucleotides in length (Choo et a l, 1989). Using this 5-1-1 clone in a serological assay it was shown that the vast majority o f NANB post transfusion hepatitis was caused by this vims which they designated hepatitis C vims (Kuo et a l , 1989; Choo et a l,
1990).
Genomic Structure
Choo and colleagues went on to sequence the entire genome o f HCV (Choo et a l , 1991). These studies have shown that HCV is a positive sense RNA vims o f approximately 9.6 kb in length with an open reading frame coding for a polyprotein o f around 3000 amino acids. It has similarities to the vimses in both the genus Pestivirus and the genus Flavivims and was therefore grouped as a third genus - Hepacivirus within the vims family Flaviviridae.
0 nt 2000 4000 6000 8000
0 aa 1000 2000 3000
w
o \
5 NCR
C E l E2
pV
NS2 NS3 4a NS4b NS5a NS5b 3 NCRFigure 1.3: Genomic structure o f HCV
T h e sin gle p olyp rotein is flan k ed b y tw o non cod in g region s (N C R ). T he p olyprotein is cleaved into the n u cleocap sid core p rotein (C ), th e en velop e
The genome contains a 5' non coding region (5' NCR) which has a strong sequence similarity with the pestiviruses with a 48% similarity to hog cholera virus (now known as classical swine fever virus) and a 45% similarity to bovine viral diarrhoea virus (BVDV); (Han et a l, 1991). The 5' NCR also shows conservation between different isolates o f HCV from around the world (Takeuchi
et a i, 1990). The 5' NCR contains an internal ribosome entry site (1RES) which requires specific conformation o f the secondary structure, this requirement tends to conserve the sequence in this region (Tsukiyama-Kohara et a l , 1992; Wang et
a/., 1993).
The 1RES initiates translation o f the single open reading frame into a polyprotein o f 3011 amino acids (Choo et a l, 1991). The polyprotein is then cleaved into ten distinct products, starting at the amino terminus with the core nucleocapsid protein C and the two envelope glycoproteins E l and E2. The three structural proteins are cleaved from the polyprotein by host cell pepsidases. The envelope protein E2 contains two hyper-variable regions (HVR 1 and 2); (Weiner et a l,
1991). These areas show a very high mutation rate thought to be caused by selective pressure from the host immune system. E2 also contains the binding site for CD81 which has been suggested as a cellular receptor for the virus (Pileri
et a l, 1998). Another candidate receptor for HCV, the low or very low density lipoprotein (LDL / VLDL) has also been associated with the envelope protein (Monazahian et a l, 1999; Agnello et a l, 1999).
Gale et a l , 1997). Lastly, NS5b is an RNA dependant RNA polymerase enzyme (Behrens et a l , 1996).
There is another non coding region o f at the 3 ' end the genome which consists o f a variable sequence o f around 40 bases then a poly-U region o f variable length followed by a highly conserved region o f 98 bases (Tanaka et a l , 1995).
Sequence variation
The average mutation rate for HCV is 10'^ to lO'"^ base substitutions per genome per year (Ogata et a l, 1991) due to errors in the incorporation o f nucleotides by the viral RNA polymerase which has no proof reading function. This high mutation rate is one o f the mechanisms by which the virus evades the host immune system (Kato et a l , 1993). However the rate o f change is not constant throughout the genome; the 5' and 3'NCRs are relatively conserved (Takeuchi et a l , 1990; Tanaka et a l, 1995), whereas there are hyper variable regions of sequence in the envelope gene E2 (Weiner et a l, 1991).
The high mutation rate has resulted in sequence diversity between different strains o f HCV with variants showing only around 70% sequence homology. Phylogenetic analysis has shown that there are six distinct groups or genotypes o f HCV (Simmonds et a l, 1993). Viruses within each genotype can be grouped into subtypes. A common nomenclature o f the HCV genotypes has been proposed by Simmonds and colleagues (Simmonds et a l, 1994). The different genotypes o f HCV are related to the geographical location o f the isolate (McOmish et a l,
1994). Types 1 to 3 are found most commonly in the UK, with type 4 associated with the Egypt and the Middle East, type 5 associated with South Africa and type 6 associated with Hong Kong (Davidson et a l, 1995). The HCV genotype is also related to the response rate to antiviral therapy, with type 1 showing significantly less response to interferon alpha treatment than types 2 and 3 (Garson et a l,
Disease progression
Acute infection with hepatitis C virus is asymptomatic in around 80% o f cases, the remaining 20% are icteric with symptoms including malaise and nausea. In very rare cases fulminant hepatitic failure can occur (Farci et a l , 1996), although this may be more common in cases where there is a super-infection with hepatitis A virus (Vento et ah, 1998). Approximately 80% o f acute HCV infections result in chronic HCV, which can last up to 30 years before the onset o f symptoms. Chronic HCV infection can result in varying degrees o f liver disease during a lifetime but in around 30% o f cases severe progressive liver disease occurs which can lead to liver cirrhosis and hepatocellular carcinoma (HCC) which is ultimately fatal (Di Bisceglie et a l, 1991; Seeff et a l , 1992). There are several factors that have been associated with an increased risk o f development o f liver cirrhosis in chronic HCV, these include being male, being over 50 years old when infected, alcohol consumption and co-infection with HIV-1 or HBV (Poynard et a l , 1997; Soto et a l, 1997; Zarski et a l , 1998). The liver enzymes alanine transaminase (ALT) and aspartate transaminase (AST) are released into the peripheral blood when the liver is damaged and can therefore be used as markers o f liver disease.
Treatment
it has been noted that those with HCV genotype 2 or 3 have a significantly better SVR rate than those with genotype 1, in a recent trial this was 79% for type 2 and 3 versus 33% for type 1 (Manns et a l, 2001). This is an improvement over interferon monotherapy which only resulted in an average o f 17% SVR rate (Thevenot et a l , 2001).
Recent trials have shown that pegylation o f the interferon alpha-2b can double the SVR in comparison to the standard non-pegylated interferon (Zeuzem et a l,
2000; Heathcote et a l, 2000; Lindsay et a l, 2001). The addition o f the poly ethylene glycol (PEG) molecule to the drug decreases its h alf life in the body allowing it to remain active for longer so that it can be given once a week instead o f the more usual three times a week. When pegylated interferon alpha-2b is used in combination with ribavirin SVR rates o f 54% and 56% have been shown after 48 weeks (Manns et a l, 2001; Fried et a l , 2001). In these recent studies it appears to be the patients with genotype 1 virus that have shown the greatest increase in SVR from around 30% with standard interferon to around 40% with pegylated interferon.
1.2.3 Hepatitis B virus (HBV)
The hepatitis B virus was first identified in 1970 by immune electron microscopy (Dane et a l, 1970). Although its surface antigen HBsAg had been discovered some years earlier (Blumberg et a l, 1965) and linked with type B hepatitis (Blumberg et a l , 1967; Prince, 1968a) as described in section 1.2.1.
HBV is a member o f the family Hepadnaviridae', this family includes mammalian viruses in the genus Orthohepadnavirus such as HBV and the woodchuck hepatitis virus and avian viruses in the genus Avihepadnavirus such as duck hepatitis virus.
Viral characteristics and genome structure
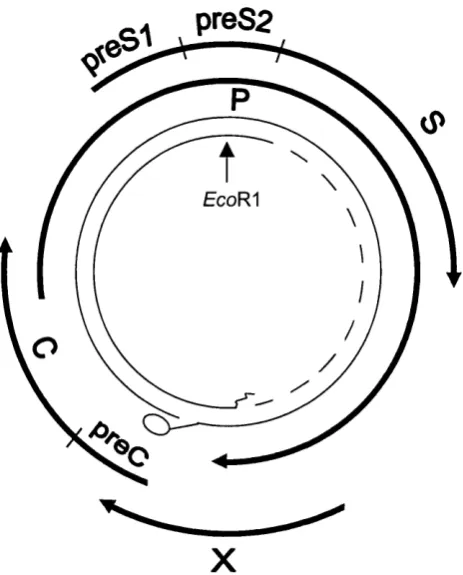
The 42nm Dane particle is the infectious virus, which contains a nucleocapsid core (HBcAg) enclosing the nucleic acid. The envelope material or surface antigen is present in vast excess o f the virus in the form o f 22nm spheres and filaments and may be detected in the plasma by serological assays. The genome is circular partially double stranded DNA o f around 3.2kb in length (Figure 1.4).
preS2
EcoR^
X
Figure 1.4: The hepatitis B genome.
H B V has a 3 .2k b , partially d oub le stranded circular D N A genom e. T h e relative p ositions o f
the four v iral gen es (p r eS l/p re S 2 /S , preC /C , P and X) are sh ow n . A p rotein is linked to the
5 ' end o f th e fu ll length D N A stran d, and an oligon u cleotide is lin k ed to the 5 ' end o f the
short strand.
Epidemiology
horizontal between young adults. Infections can result from intravenous drug use, sexual activity, blood transfusion and haemodialysis. The virus may also be transmitted by health care workers undertaking exposure prone procedures (EPP), (Sundkvist et a l , 1998). However, measures are now underway to ensure that carriers o f the virus are do not carry out EPP’s if they have a viral load greater than 1000 copies/ml (Gilbert et a l, 2002).
Disease Progression
Most HBV infections in adults result in an acute infection with only 5% developing chronic infection, the infection results in icteric disease in around a third o f those infected. The situation is reversed in neonates and infants in whom the majority o f infections result in chronic disease (Peters et a l , 1991). The infection starts with an incubation phase o f around 45 to 120 days, during this phase the virus replicates prolifically with viral titres reaching lO'^ copies/ml in the plasma. Viral DNA, HBsAg and HBeAg can be detected during this period and later anti-HBc develops.
In the second stage o f the infection the host immune response to the virus reduces the viral levels as well as causing inflammation o f the liver. There is a short prodromal phase o f around a week characterized by mild fever, fatigue, malaise and nausea, after which the icteric disease begins in the patient, (co incident with anti-HBc) lasting for four to six weeks. As a result o f the hepatic injury the aminotransferase levels become elevated. Fulminant hepatic failure can also occur although it is rare (Berk and Popper, 1978; Lee, 1993).
infection has been completely cleared and HBV DNA is no longer detectable, the anti-HBs response is also protective, preventing re-infection with the virus.
In chronic HBV infection, the HBsAg and HBeAg are not cleared quickly but remain for many years indicating continued viral replication, which can lead to liver cirrhosis and hepatocellular carcinoma. The chronic carrier state is usually defined as HBsAg remaining detectable for more than six months. The carrier state can spontaneously resolve with the disappearance o f HBeAg and the detection o f anti-HBe. This signals a decline in HBsAg which eventually becomes undetectable. Anti-HBs may or may not appear after loss o f HBsAg in chronic carriers resolving infection.
In both acute and chronic cases anti-HBc becomes detectable a few weeks after the appearance o f HBsAg and remains detectable throughout the course o f infection and for many years afterwards. At the time o f writing anti-HBc detection in donated blood is not performed in the NBS, however this is currently under review and may be implemented in pooled donations in the future. Anti- HBc is important in transfusion screening because it remains detectable at the end o f the infection in the period between loss o f HBsAg and development o f anti-HBs during which time the blood may still be infectious (Allain et a l,
1999).
Prevention and therapy
The first vaccines for HBV were HBsAg preparations purified from human serum (Maupas et a l, 1978). However concerns over safety o f these vaccines particularly after the discovery of HIV-1 in the early 1980’s led to the development o f recombinant HBsAg expressed from yeast cells (McAleer et a l,
1984).
stage three disease, i.e. HBeAg to anti-HBe sero-conversion, a small percentage may even clear HBsAg. Standard treatment has been a four month course o f interferon alpha 2b (Hoofnagle and Di Bisceglie, 1997) which can result in a sustained response in approximately a third o f patients (Wong et a l , 1993). Long term follow up o f the responders to interferon treatment show improved clinical outcome (Niederau et a l, 1996).
1.2.4 Human immunodeficiency virus (HIV)
Human immunodeficiency virus, the causative agent o f acquired
immunodeficiency syndrome (AIDS) was discovered in 1983 (Barré-Sinoussi et a l, 1983) and was later shown to be transmitted by blood transfusion (Jett et a l,
1983).
Genome structure and sequence variation
HlV-1 is a member o f the genus Lentivirus within the family Retroviridae, it is an enveloped virus o f 120nm in diameter with a diploid RNA genome o f 9.2 kb. The genome shares the attributes o f the other retroviruses with the main genes being gag, p ol and env (Figure 1.5). The gag gene codes for several struetural proteins including those used in the nucleocapsid. The second gene p o l codes for a protein which is cleaved into the integrase (IN), reverse transcriptase (RT) and protease (PR) proteins. The env gene codes for the gpl20 and gp41 envelope glycoproteins. The genes tat and rev code for proteins with regulatory functions, and the genes nef, vif, vpu and vpr also code for proteins that may have accessory functions some o f which are still unclear.
re
pol vpr env nef
gag v if <— vpu
LTR LTR
Figure 1.5: HIV-1 genome
T h e H IV -1 gen om e show s the sam e layout o f the stru ctural gen es g a g , p o l and en v as other retroviru ses. In ad dition there are the regulatory genes ta t and rev, and the accessory genes
A second virus known as HIV-2 was isolated from patients in West Africa in 1986 (Clavel et a l, 1986). The two viruses are related but have a sequence similarity o f only around 50%. HIV-2 has mostly remained confined to West Africa and is generally thought to be less transmissible and pathogenic than HIV-
1 (Pepin et a l, 1991).
HIV-1 sequence diversity in isolates from different areas o f the world have led to its classification into groups and further classification into subtypes or clades. There are three groups o f H IV -1 based on sequence diversity, these are; group M (main), group O (outlier), and group N (new). The main group o f HIV-1, group M is classified into subtypes A to K which can vary by 20-25% in their envelope sequences. The more distantly related strains o f the outlier group O were first isolated from a patient in the Cameroon, with a sequence similarity to HIV-1 group M o f only 65% (Gurtler et a l, 1994). Another group o f viruses also isolated in the Cameroon have been described which do not cluster with either HIV-1 group M or O, these have been designated group-N (Simon et a l , 1998).
Epidemiology
At the end o f 2001 more than 40 million people were living with HIV, and over 60 million people have been infected with the virus since the epidemic began (UNAIDS/WHO, 2001). The vast majority o f those affected are in Sub-Saharan Africa, with South and South-East Asia the second highest affected. HIV-1 group M viruses are responsible for the majority o f the epidemic, with HIV-1 groups N and O and HIV-2 largely confined to West Africa. HIV-1 subtype C viruses represent the majority worldwide, being prevalent in Africa and India. However subtype B is the most common HIV-1 subtype in western countries. Subtype E is present in a rapidly expanding epidemic in South East Asia. In the UK the predominant subtype is B, however the other subtypes are also present (Clewley
et a l, 1996).
intercourse. Reeently however, heterosexual transmission has been found to have overtaken homosexual as the main route o f spread in the UK (Kent, 2001). The virus is also spread by parenteral transmission partieularly intravenous drug use, but also by needle stick injuries in healthcare workers, transfusion o f blood or blood produets and organ transplantation. Another route o f infection is perinatal from an infected mother to her baby either through the placenta, during birth or through breast feeding.
Disease progression
The acute primary infection o f H IV -1 may be asymptomatic in around half o f the cases, but where there are symptoms they include a mild flu or mononueleosis like illness with fever, rash, pharyngitis and lymphadenopathy lasting for about three weeks (Kinloeh-de Loes et a i, 1993). The symptoms usually eoincide with sero-eonversion two weeks to three months after exposure. There then follows a variable asymptomatie period o f eight to eleven years (Collaborative group on AIDS Incubation and HIV Survival including the CASCADE EU Concerted Action, 2000). During this period there may still be symptoms o f generalised lymphadenopathy and fatigue.
As the disease progresses, the CD4+ cell count slowly declines with further symptoms o f reduced immunity occurring when the CD4+ cell count falls below 500 cells per pi. When the CD4+ cell eount falls below 200 eells per pi a variety o f opportunistic infections and other conditions associated with a depressed cell mediated immunity characterise the symptomatic stage defined as full blown AIDS (CDC, 1993). This final symptomatie stage often presents with
Treatment
The first anti retroviral drug to be used for HIV therapy in 1985 was the nucleoside analogue reverse transcriptase inhibitor (NRTI) 3'-azido-3'- deoxythymidine (AZT); (Fischl et a l, 1987). However, the use o f this drug for prolonged periods selected viral mutants with reduced drug susceptibility. When further N RTI’s were developed the use o f these drugs in combination gave superior results to monotherapy. In the mid 1990’s the first protease inhibitors were developed and when used in combination with the N R TI’s gave a further improvement. The highly active antiretroviral therapy (HAART) triple combination therapies in use today are able to reduce viral loads to undetectable levels and significantly reduce the rate o f progression to AIDS (Palella et a l,