1 Title: Motoneuron excitability of the quadriceps decreases during a fatiguing submaximal isometric 1
contraction 2
3
Authors: Harrison T Finn 1, 2, David M Rouffet 3, 4, 5, David S Kennedy 6, 7, Simon Green 8, Janet L Taylor 4
1, 2, 9
5
1 Neuroscience Research Australia, Randwick, NSW, Australia
6
2 University of New South Wales, Kensington, NSW, Australia
7
3 Victoria University, Melbourne, VIC, Australia
8
4 Australian Institute for Musculoskeletal Science (AIMSS), Victoria University, Melbourne, Australia
9
5 Institute of Sport, Exercise and Active Living (ISEAL), Victoria University, Melbourne, Australia
10
6 University of Sydney, Cumberland, NSW, Australia
11
7 University of Technology, Ultimo, NSW, Australia
12
8 Western Sydney University, Campbelltown, NSW, Australia
13
9 Edith Cowan University, Perth, WA, Australia
14 15
Author contributions: Finn, Rouffet and Taylor conceptualized the study and designed the 16
methodological approach. Finn, Taylor, Rouffet and Kennedy participated in data collection. Finn 17
analysed the data. All authors contributed to interpretation of the data, manuscript preparation and 18
revision. 19
20
Running title: Quadriceps motoneuron excitability during fatigue 21
22
Corresponding author: 23
Janet Taylor, M.D. 24
Neuroscience Research Australia, 25
Barker St, Randwick, 26
NSW, 2031, Australia 27
Tel: +61 93991716 28
2
ABSTRACT:
30
During fatiguing voluntary contractions, the excitability of motoneurons innervating arm muscles 31
decreases. However, the behavior of motoneurons innervating quadriceps muscles is unclear. 32
Findings may be inconsistent because descending cortical input influences motoneuron excitability 33
and confounds measures during exercise. To overcome this limitation, we examined effects of 34
fatigue on quadriceps motoneuron excitability tested during brief pauses in descending cortical drive 35
after transcranial magnetic stimulation (TMS). Participants (n=14) performed brief (~5 s) isometric 36
knee extension contractions before and after a 10-min sustained contraction at ~25% maximal EMG 37
of vastus medialis (VM) on one (n=5) or two days (n=9). Electrical stimulation over thoracic spine 38
elicited thoracic motor evoked potentials (TMEP) in quadriceps muscles during ongoing voluntary 39
drive and 100ms into the silent period following TMS (TMS-TMEP). Femoral nerve stimulation 40
elicited maximal M-waves (Mmax). On the two days, either large (~50% Mmax) or small (~15% 41
Mmax) TMS-TMEPs were elicited. During the 10-min contraction, VM EMG was maintained (P=0.39) 42
whereas force decreased by 52% (SD 13%) (P<0.001). TMEP area remained unchanged (P=0.9), 43
whereas large TMS-TMEPs decreased by 49% (SD 28%) (P=0.001) and small TMS-TMEPs by 71% (SD 44
22%) (P<0.001). This decline was greater for small TMS-TMEPs (P=0.019; n=9). Therefore, without 45
the influence of descending drive, quadriceps TMS-TMEPs decreased during fatigue. The greater 46
reduction for smaller responses, which tested motoneurons that were most active during the 47
contraction suggests a mechanism related to repetitive activity contributes to reduced quadriceps 48
motoneuron excitability during fatigue. By contrast, the unchanged TMEP suggests that ongoing 49
drive compensates for altered motoneuron excitability. 50
51
NEW & NOTEWORTHY:
52We provide evidence that the excitability of quadriceps motoneurons decreases with fatigue. Our 53
results suggest that altered intrinsic properties brought about by repetitive activation of the 54
3 voluntary contraction may not reflect the underlying depression of motoneuron excitability due to 56
changes in ongoing voluntary drive. Thus, this study provides evidence that processes intrinsic to the 57
motoneuron contribute to muscle fatigue of the knee extensors. 58
59
Keywords: motoneuron, fatigue, quadriceps, EMG, TMS 60
61
INTRODUCTION:
62Motoneurons are the final common pathway of descending motor commands (32) and directly 63
innervate muscle fibers. During fatiguing exercise, part of the reduction in maximal force can be 64
attributed to processes within the central nervous system that result in a reduced firing of 65
motoneurons (11). The likelihood that motoneurons will fire in response to a given input is not only 66
dependent on the intrinsic properties of the motoneurons, but also the sum of the multiple inputs 67
received by the motoneurons (7, 17) all of which may be altered during fatiguing exercise (8, 21, 24). 68
69
One method to assess the excitability of motoneurons is to stimulate the descending spinal tracts 70
below the motor cortex at either the cervicomedullary junction or over the upper thoracic spine. 71
These stimuli provide descending synaptic input to the motoneurons that can be adjusted by altering 72
stimulation intensity. The number of motoneurons that fire in response to this synaptic input is 73
reflected by the sum of action potentials measured at the muscle level. These responses are 74
commonly referred to as cervicomedullary motor evoked potentials (CMEP) or thoracic motor 75
evoked potentials, (TMEP) (25, 36). A reduction in size of the CMEP or TMEP during fatigue suggests 76
that the motoneuron pool has become less responsive to descending input, but many factors 77
contribute to this reduction (8, 27, 28). One likely factor is change in the intrinsic properties of the 78
motoneurons related to repetitive activation (4, 15, 19, 22, 27, 35). For example, when motoneurons 79
4 continue to decline gradually over minutes in a process known as late spike frequency adaptation 81
(22, 35). 82
83
For the motoneurons of the quadriceps muscles, the effect of fatigue is not clear as increases (34) 84
and no change (21, 33, 37) in motoneuron excitability have all been reported. In accounting for the 85
heterogeneous results, it is important to note that different exercise modalities (single limb 86
isometric, dynamic, and whole-body exercise) were used in these studies. In addition, these 87
investigations all assessed the motoneurons during contractions when the motoneurons were firing 88
in response to different levels of ongoing excitatory voluntary descending drive (21, 33, 34, 37). 89
While this is often necessary to achieve evoked responses from stimulation, it introduces a 90
confounding effect as changes in voluntary descending drive will influence the measure of 91
motoneuron excitability. This can be seen in an unfatigued state, where the size of the evoked 92
responses first increases and then decreases as the strength of voluntary contraction increases (25, 93
38). Therefore, measuring motoneuron excitability with changing levels of descending drive, as 94
would occur during fatiguing contractions, means that the evoked response will likely reflect both 95
changes at the motoneurons and changes in voluntary descending drive, and it will be difficult to 96
discriminate the contributions of each. 97
98
An experimental technique that reduces the confounding effect of ongoing descending drive on 99
measures of motoneuron excitability is to evoke CMEPs or TMEPs during the brief pause in voluntary 100
descending drive that follows a single transcranial magnetic stimulation (TMS) pulse to the motor 101
cortex during a voluntary contraction. TMS during voluntary contraction causes a short-latency 102
excitatory response which is followed by a brief silent period (~200 ms duration) in the ongoing 103
electromyogram (EMG) activity. During the silent period, inhibition at a cortical level suppresses 104
voluntary cortical output to the motoneurons (9). Hence, with stimulation of the descending tract 105
5 are not acted upon by descending drive and not actively firing. When this technique was used in the 107
upper arm during both a sustained maximal contraction (28), and a prolonged submaximal 108
contraction (27), the size of the biceps brachii CMEP evoked after TMS was profoundly reduced 109
compared to a CMEP without preceding TMS. Thus, reductions in biceps motoneuron excitability 110
during fatigue were revealed by pausing ongoing descending drive which otherwise may 111
compensate for these reductions. Moreover, smaller CMEPs were reduced more than larger CMEPs 112
(27). Because smaller CMEPs reflected responses from motoneurons that were mostly active in the 113
submaximal contraction whereas the larger CMEP reflected responses from those same active 114
motoneurons plus additional non-active motoneurons, it was concluded that excitability is 115
specifically reduced in the motoneurons of the biceps brachii that are repetitively activated during a 116
fatiguing contraction of submaximal intensity. 117
118
Here we aimed to better understand the changes that occur during fatiguing exercise of the 119
quadriceps by assessing quadriceps motoneurons in the absence of voluntary descending drive. 120
Testing was carried out with TMEPs delivered in the silent period following TMS (TMS-TMEP). 121
We hypothesised that during fatigue the quadriceps motoneurons would become profoundly less 122
responsive as indicated by a reduction in the size of the TMS-TMEP. Excitability was also assessed 123
with ongoing drive (TMEP) and we expected that the TMEP would remained unchanged as successful 124
performance of the fatiguing task required excitatory voluntary drive acting on the motoneurons to 125
maintain motoneuron firing. In addition, we used a submaximal task with a constant level of EMG 126
and two different sizes of TMS-TMEPs, small and large, to test the hypothesis that active 127
motoneurons would have a greater reduction in excitability than non-active motoneurons. We 128
expected that during our task, the small TMS-TMEP would be made up of a greater proportion of 129
motoneurons that were active during the task and therefore show greater reductions in size. 130
6
MATERIALS AND METHODS:
132
Participants 133
Seventeen healthy participants were recruited for the study. Three participants were not tested 134
either because responses could not be elicited (n = 2) or due to stimulation discomfort (n = 1). The 135
experiment was completed by fourteen participants (5 female) with an average age of 22.5 (4.8) 136
years (mean and standard deviation). Of those tested, the required baseline response to test smaller 137
and larger portions of the motoneuron pool was achieved in 9 participants (4 females), who were 138
then tested on two separate days, one with large responses and another with small responses 139
chosen in a block randomised order. The other 5 participants were tested on one day only using 140
stimulation intensities to elicit small responses. All studies were approved by Human Research Ethics 141
Committee at the University of New South Wales and conformed to the Declaration of Helsinki 142
(2008). Written consent was obtained from each of the participants. 143
144
Experimental setup 145
Participants were seated in a custom-built chair with hips at 70 degrees (0 is extended neutral 146
position) and left knee at 70 degrees (knee fully extended is 0 degrees). The left ankle was secured 147
to a force transducer by a Velcro strap and an adjustable strap was placed over the hip and was 148
tightened to secure the participant before contractions. Knee extension force was measured with a 149
linear strain gauge (linear to 1 kN; XTran, Melbourne, Australia). Electromyograms (EMG) of the 150
vastus medialis (VM), vastus lateralis (VL), and the rectus femoris (RF) were recorded via adhesive 151
Ag-AgCl electrodes (20 mm diameter Conmed ClearTrace ECG Sensor Electrodes Utica, NY) arranged 152
in a bipolar fashion. The VM electrodes were positioned two centimetres and seven centimetres 153
proximal to the superior medial border of the patella on the muscle following the orientation of the 154
muscle fibers. The proximal VL and RF electrodes were placed two thirds of the distance from the 155
anterior superior iliac spine to the lateral and superior borders of the patella, respectively, with the 156
7 brief knee extension contraction. A 70 mm by 40 mm (3M Universal Electrosurgical Pad, AUS) ground 158
electrode was placed across the upper thigh between the recording electrodes and femoral nerve 159
stimulating electrodes. In all experiments, force and EMG signals were recorded to computer using a 160
16-bit A/D converter (CED 1401; Cambridge Electronic Design Ltd, Cambridge, UK) in conjunction 161
with Spike2 software (v. 7.12 Cambridge Electronic Design). EMG signals were amplified (x100) and 162
bandpass filtered (16 - 1000 Hz) using CED 1902 amplifiers (Cambridge Electronic Design) and force 163
and EMG signals were sampled at 1000 and 2000 Hz, respectively. During the experiment, visual 164
feedback of vastus medialis EMG activity was provided to the participant via an external monitor. 165
The EMG signal was root mean square (rms) processed in real time using a 40 ms time constant. The 166
vastus medialis was the main muscle of interest, and stimulation intensity and EMG feedback for the 167
task were set for this muscle. 168
169
Femoral nerve stimulation. A constant current stimulator (DS7AH, Digitmer, Welwyn Garden City, 170
UK) was used to deliver single electrical stimuli (500 µs pulse width) to the femoral nerve to record 171
the maximal compound muscle action potential (Mmax) of the three muscles. The anode was a 70 172
mm by 40 mm electrode (3M Universal Electrosurgical Pad, Australia) placed over the gluteus 173
minimus with the top edge along the iliac crest on the left side of the body. The cathode was a 174
custom made circular probe (20 mm diameter) which was placed over the femoral nerve along the 175
inguinal ligament and secured with a Velcro strap. Optimal cathode placement was established by 176
moving the probe along the inguinal ligament and stimulating (30 mA) at each site. The intensity of 177
the stimulation was then progressively increased (10 mA steps) until there was no increase in the 178
peak-to-peak amplitude of the M-wave in all three muscles. Stimulus intensity was then set at 150% 179
of the current required to produce Mmax (60 - 250 mA). 180
181
Transcranial magnetic stimulation. Stimulation of the motor cortex was delivered close to the vertex 182
8 Dyffed, UK) discharging simultaneously. Optimal TMS location was established by stimulating at 184
positions close to the vertex for the location that produced the largest motor evoked potentials 185
(MEP) in all three muscles at rest. This position, which was typically 1-2 cm to the right of the vertex, 186
was marked on the head and used throughout the experiment. TMS intensity was then adjusted to 187
produce a 200 ms silent period during a brief contraction at the level of VM EMG required to 188
produce 25% maximal force (50 - 80% of stimulator output). 189
190
Thoracic stimulation. A constant voltage stimulator (D180, Digitimer) was used to stimulate the 191
descending corticospinal tracts to elicit a thoracic motor evoked potential (TMEP) in the three 192
muscles. The anode was placed over the spinous processes between T1 - T2 and the cathode was 193
placed between T5 - T6 using 30 x 25 mm electrodes (3M Universal Electrosurgical Pad). TMS was 194
paired with thoracic stimulation to elicit a TMEP in the silent period (TMS-TMEP). The thoracic 195
stimulation (100 µs duration) was triggered 100 ms after TMS during contraction at the level of EMG 196
required for a force of 25% maximum. During such contractions, thoracic stimulation intensity was 197
set to evoke TMS-TMEPs in VM of either 15% of Mmax area on the small day, or 50% of Mmax area 198
on the large day. This same intensity was used to elicit TMEPs, which were not preceded by TMS. 199
200
Experimental procedures 201
The procedures for the two days of the experiment were identical apart from the size of the evoked 202
TMS-TMEP in the VM, either small or large. The experiment began with a maximal voluntary 203
contraction (MVC) to determine maximal force. The participant then used visual feedback displayed 204
on a monitor to perform a 5-s contraction at 25% maximal force. The average VM rmsEMG during 205
this 25% force contraction was then calculated. This level of rmsEMG activity was used as the new 206
target displayed on the monitor. Participants used the real-time visual feedback of the rmsEMG 207
activity for the fatiguing task and all baseline and recovery measures. Once stimulus intensities were 208
9 assessment of TMS-TMEPs, TMEPs, and then M-waves (only on the first and last set) during separate 210
brief contractions (Figure 1). 211
212
The fatigue task required the participants to sustain a 25% EMG contraction for 10 min. From 5 s into 213
the contraction and then every minute after, TMS-TMEP, TMEP, and Mmax were elicited with 5 s 214
between stimuli. At every minute (prior to stimulation) the participants were asked to verbally 215
report their rating of perceived effort (RPE) on a scale from 0 - 10. After the cessation of the 216
sustained task, recovery measures were performed in identical style to baseline measures. These 217
were performed every min starting at 30 s and then every 2 min from 3:30 for 10 min (see Figure 1). 218
219
Data analysis and statistics 220
During off-line analysis both Spike2 (v. 7.12) and Signal software (v. 4.06) were used to determine all 221
measures. Mean force and rmsEMG activity for each contraction were calculated over a 1-s period 222
finishing 50 ms before stimulation was delivered. MVC force was calculated as the maximal force of 223
the initial brief contractions. The amplitude and areas of Mmax, TMEP, and TMS-TMEP were 224
measured between cursors placed on the initial deflection from baseline to the second crossing of 225
the horizontal axis (26, 27) but only area was included in the statistical analysis. To account for any 226
changes in the muscle action potential, the TMEPs and TMS-TMEPs were normalised to the nearest 227
recorded Mmax during the protocol. Two sets of statistical analyses were performed. 228
229
First, all participants that completed the experiment with small TMS-TMEPs evoked at baseline 230
(n = 14) were analysed together using one-way repeated measures ANOVAs for changes in force, 231
VM rmsEMG, RPE, TMS-TMEP area/Mmax, and TMEP area/Mmax from baseline to the end of the 232
10-min contraction (GraphPad Prism v. 7.02). Another one-way ANOVA was completed for the same 233
measures but for an effect of time during the recovery period compared to baseline with 234
10 time points different from baseline included using paired t test results which were then compared to 236
a Dunnett’s table to control for multiple comparisons. 237
Second, participants that completed two days of the experiment (n = 9) were analysed and days 238
compared. Student’s t tests were used to compare baseline MVC force, rmsEMG, Mmax, TMS-TMEP, 239
and TMEP between days. Two-way repeated measures ANOVAs with time and day as factors were 240
used to compare rmsEMG, force, RPE, Mmax area, TMS-TMEP area/Mmax, TMEP area /Mmax, 241
TMS-TMEP area/Mmax (% baseline) and TMEP area/Mmax (% baseline) during the 10-min sustained 242
contraction and then again in recovery (GraphPad Prism v. 7.02). When a main effect of day was 243
seen, post-hoc t tests with Bonferroni corrections were used to determine differences between days 244
for each time point. In addition, when an effect of day occurred, one-way repeated measures 245
ANOVA was used to assess the effect of time for each day. To determine time points different from 246
baseline, paired t test results were compared with a Dunnett’s table to control for multiple 247
comparisons. All data in text and in figures are reported as mean (SD). The significance level was set 248
to P < 0.05. 249
250
RESULTS: 251
In the course of a 10-min sustained submaximal contraction, during which rmsEMG was maintained 252
at a set level corresponding to 25% initial maximal force, perceived effort increased progressively, 253
and force declined. The size of the vastus medialis (VM) TMS-TMEP decreased greatly during the 254
sustained contraction, whereas the size of the TMEP did not change. Similar changes were seen in 255
both the vastus lateralis (VL) and the rectus femoris (RF). In addition, small TMS-TMEPs were more 256
affected than large TMS-TMEPs. 257
258
Small TMS-TMEPs and TMEPs 259
During the brief baseline contractions, the average VM rmsEMG was 20.9% (SD 7.1) of the maximal 260
11 (SD 164). One-way ANOVA comparing VM rmsEMG in baseline contractions and during the sustained 262
submaximal contraction showed no significant effect of time (F 5.2,68.8 = 2.09, P = 0.073) (Figure 2A).
263
VM rmsEMG during recovery contractions was initially higher than baseline, before returning to 264
similar values to baseline (F 4.4,58.4 = 2.81, P = 0.029). By contrast, force decreased over the course of
265
the submaximal contraction by 60.1% (SD 19.1) (F 2.7,35.2 = 41.71, P < 0.001), and remained lower
266
during recovery contractions compared to baseline (F 4.2,55.3 = 11.03, P < 0.001). Rating of perceived
267
effort (RPE) increased during the sustained contraction from 2.2 (SD 1.6) to 7.3 (SD 1.7) on a scale of 268
0 - 10 (F 2.7,35.2 = 67, P < 0.001) (Figure 2A). In recovery, RPE decreased (F 2.5,32.7 = 4.94, P = 0.009) and
269
from 1.5 min post contraction, ratings were similar to the reported values at the start of the 270
sustained contraction. 271
272
During the sustained contraction, there was a decline in VM TMS-TMEP area expressed as a 273
percentage of Mmax (F 2.2,28.1 = 17.31, P < 0.001). Area was reduced from 13.4% Mmax (SD 4.6) at
274
baseline to 4.3% Mmax (SD 5.2) by the end of the fatiguing contraction (Figure 2B). There was a main 275
effect of time during recovery (F 2.8,36.5 = 3.65, P = 0.023) with TMS-TMEPs increasing in size towards
276
baseline values. The area of the VM TMEP did not change during the protocol with no effect of time 277
during the sustained contraction (F 4.8,62.6 = 1.05, P = 0.391) nor in recovery (F 4.3,56.1 = 0.13, P = 0.977).
278 279
Comparison between Large and Small TMS-TMEPs and TMEPs 280
Nine of the fourteen participants completed the protocol on two days with the only difference being 281
the size of the baseline VM TMS-TMEP area. Thoracic stimulation intensity was set to elicit a small 282
(~15% of Mmax) or large (~50% of Mmax) TMS-TMEP with the actual means corresponding to 13.8% 283
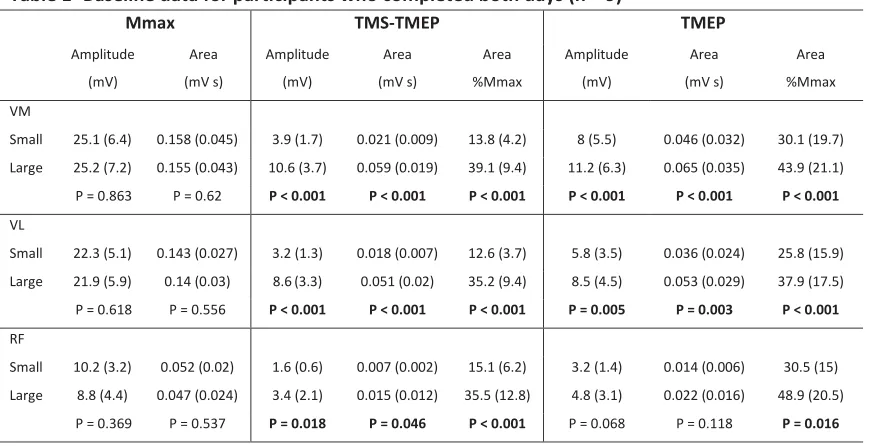
(SD 4.2) and 39.1% (SD 9.4) of Mmax area respectively (P < 0.001) (Table 1). MVC force (P = 0.562), 284
normalised VM rmsEMG (P = 0.079) and normalised force during baseline contractions (P = 0.987) 285
12 and 26.2% MVC (SD 3.9) respectively. The amplitude and areas of Mmax, TMS-TMEPs, and TMEPs for 287
VM, VL, and RF are reported in Table 1 for participants who completed both days. 288
289
TMEP and TMS-TMEP. For VM, both the large and small TMS-TMEPs decreased during the sustained
290
contraction (Figures 3A, 4A & C), whereas the large or small TMEPs remained unchanged (Figures 3B, 291
4B & D). Repeated measures ANOVA showed that TMS-TMEPs in VM displayed an effect of time 292
(F 11,88 = 15.16, P < 0.001), day (F 1,8 = 8.21, P = 0.021) and an interaction (F 11,88 = 2.42, P = 0.011) with
293
the large responses decreasing relatively less than the smaller responses (Figure 4C). Large 294
TMS-TMEPs decreased by ~49% from baseline whereas small TMS-TMEPs decreased by ~71%. 295
In recovery, there was an effect of time (F 7,56 = 3.27, P = 0.005) but no difference between days
296
(F 1,8 = 0.231, P = 0.643). By contrast, the TMEP area (normalised to baseline) (Figure 4D) was
297
unchanged during the sustained contraction (F 11,88 = 0.72, P = 0.719) with no difference between
298
days (F 1,8 = 0.99, P = 0.348) nor interaction. In recovery, the TMEP areas remained unchanged
299
(F 7,56 = 0.42, P = 0.882) with no difference between days (F 1,8 = 1.33, P = 0.289).
300 301
In the vastus lateralis, TMS-TMEPs and TMEPs behaved similarly to those in VM. VL TMS-TMEPs 302
showed an effect of time (F 11,88 = 16.63, P < 0.001) and day (F 1,8 = 9.02, P = 0.017), with the large
303
day having larger relative areas (Figure 5A). In addition, there was a non-significant interaction 304
(F 11,88 = 1.74, P = 0.078). Large TMS-TMEPs decreased by ~53% and small TMS-TMEPs decreased by
305
~71.8%. In recovery, there was an effect of time (F 7,56 = 3.18, P = 0.029) with recovery towards
306
baseline, and no difference between days (F 1,8 = 0.29 P = 0.605). TMEP area (normalised to baseline)
307
was unchanged during the sustained contraction (F 11,88 = 0.71, P = 0.725) with no difference
308
between days (F 1,8 = 0.09, P = 0.772). In recovery, the areas remained
309
unchanged (F 7,56 = 0.73, P = 0.645) and there was no difference between days
310
(F 1,8 = 0.28, P = 0.606).
13 For the rectus femoris, comparison of the normalised TMS-TMEP between small and large responses 313
showed an effect of time (F 11,88 = 11.08, P < 0.001), but no day effect (F 1,8 = 0.64, P = 0.448) nor
314
interaction (F 11,88 = 0.79, P = 0.643) (Figure 5B). Large responses decreased by ~45% and small
315
decreased by ~60%. In recovery, there was no day effect (F 1,8 = 0.72, P = 0.421) but there was an
316
effect of time (F 7,56 = 3.44, P = 0.004) such that the TMS-TMEP size increased to values similar to
317
baseline. The TMEP area was unchanged during the sustained contraction (F 11,88 = 0.76, P = 0.671)
318
with no difference between days (F 1,8 = 0.07, P = 0.803). In recovery, the areas remained unchanged
319
(F 7,56 = 1.3, P = 0.267) and displayed no difference between days (F 1,8 = 1.93, P = 0.202).
320 321
EMG. Participants successfully maintained the rmsEMG target during the sustained contraction as 322
VM rmsEMG was unchanged from baseline (F 11,88 = 0.87, P = 0.574) and was on average ~21% of
323
MVC throughout the sustained contraction. However, there was an unintended significant difference 324
between days (F 1,8 = 7.78, P = 0.023). VM rmsEMG during the sustained contraction was higher on
325
the day that large responses were evoked by a pooled average of 1.7% (SD 1.9) MVC. For VL, there 326
was no change in rmsEMG during the sustained contraction (F 11,88 = 1.7, P = 0.086) at ~21% MVC,
327
and no effect of day (F 1,8 < 0.001, P = 0.971). Additionally, RF rmsEMG was unchanged (F 11,88 = 1.34,
328
P = 0.217) at ~20% with no difference between days (F 1,8 = 0.02, P = 0.893). In recovery, VM
329
rmsEMG was higher than baseline particularly at the beginning of recovery (F 7,56 = 2.51, P = 0.025)
330
and the average size of the increase was 2.5%. In addition, there was an effect of day with the large 331
response day showing higher VM rmsEMG (2.6% SD 1.9) than on the small day (F 1,8 = 17.24, P =
332
0.003). During recovery, there was an increase in VL rmsEMG (F 7,56 = 2.54, P = 0.024), but there was
333
no change in RF rmsEMG (F 7,56 = 1.45, P = 0.567).
334 335
Force. As expected, force declined during the maintained rmsEMG sustained contraction
336
(F 3.2,54.2 = 29.46, P < 0.001). Force from baseline was approximately halved, falling from 26.2% (SD
337
14 on the two days (F 1,8 = 0.01, P = 0.956). During the recovery contractions, the force during the brief
339
contraction increased towards baseline values (F 4.1,68.7 = 10.91, P < 0.001).
340 341
Perceived effort. During the sustained contraction, the rating of perceived effort (RPE) increased
342
progressively (F 2.9,50.7 = 113.3, P < 0.001) during the 10-min contraction from 1.6 (SD 1) to 7.3
343
(SD 1.5), and there was no difference between days (F 1,8 = 2.02, P = 0.192). In recovery, there was an
344
effect of time (F 2.7,46.9 = 6.943, P < 0.001) such that at the start of recovery, RPE was still higher than
345
at the start of the sustained contraction but became similar from 2.5 min onwards. 346
347
Maximal M-wave. VM Mmax area decreased slightly by ~6.6% (SD 10.2) by the end of the 10-min
348
contraction (F 11,88 = 3.21, P = 0.01) with no difference between days (F 1,8 = 0.09, P = 0.77). During
349
recovery VM Mmax remained below baseline (F 7,56 = 4.3, P < 0.001). VL Mmax area also decreased
350
by ~2.9% (SD 5.9) (F 3.3,56.8 = 3.28, P = 0.023) during the contractions, with no difference between
351
days (F 1,8 = 0.35, P = 0.569). There was no change in the RF Mmax area (F 2.4,41.7 = 2.41, P = 0.091)
352
and no difference between days (F 1,8 = 0.48, P = 0.506).
353 354
DISCUSSION: 355
In the present study, performance of a fatiguing sustained submaximal contraction of the knee 356
extensors resulted in decreased excitability of quadriceps motoneurons as evident by a reduction in 357
the size of the TMS-TMEP which assessed excitability during brief periods of paused voluntary 358
descending drive. By contrast, when tested with maintained ongoing descending drive, excitability of 359
the motoneurons was unchanged (i.e. the size of the TMEPs without prior TMS remained the same). 360
These findings were consistent for all muscles measured. Furthermore, small TMS-TMEPs, evoked by 361
weak stimulation, declined more than large TMS-TMEPs. This difference suggests that 362
activity-dependent mechanisms contribute to the observed reduction in excitability as active 363
15 365
TMS-TMEP
366
For the three measured quadriceps muscles, the TMS-TMEPs became smaller during the sustained 367
contraction and thus, indicate reductions in motoneuron excitability. TMS-TMEPs are a measure of 368
motoneuron excitability elicited through stimulation of the corticospinal tracts at a subcortical level 369
during the brief silent period that follows TMS. TMS first elicits an excitatory response from the 370
motor cortex and then a period of inhibition of motor cortical output (39). The inhibition of 371
descending drive from the motor cortex removes one source of excitatory input to the motoneurons 372
at time of assessment making the resulting TMS-TMEP more sensitive to other influences that affect 373
motoneuron excitability including changes of motoneuron properties and changes to other 374
descending or afferent inputs during exercise. Our results for the quadriceps are consistent with 375
those for the biceps brachii when tested in similar circumstances (27) and strongly suggest that 376
during fatiguing contractions of the knee extensor muscles changes occur at the level of the 377
motoneurons and lead to reduced efficacy of descending drive to excite motoneurons. Therefore, to 378
maintain motoneuron output, greater descending drive is required. In the context of past studies 379
looking at the quadriceps, our findings suggest that assessments during ongoing descending drive 380
may underestimate underlying changes in motoneuron excitability during fatigue, but may better 381
represent the efficacy of the multiple inputs onto the motoneurons to maintain motoneuron 382
excitability during contractions. 383
384
Small TMS-TMEPs were more affected during fatigue than large TMS-TMEPs. This difference was 385
clear both in vastus medialis, our muscle of interest, and in the vastus lateralis, although it was not 386
significant for the rectus femoris. The rectus femoris is a bi-articular muscle and the RF EMG during 387
that task, as well as the size of the TMS-TMEPs was not controlled which may have introduced 388
variability and thus, explain the non-significant differences. As TMEPs recruit motoneurons 389
16 responses should test different proportions of the quadriceps motoneuron pool. As MEPs, evoked 391
via TMS, recruit motoneurons in the same order as a voluntary contraction (10), and TMEPs and 392
MEPs travel through similar descending corticospinal axons to activate motoneurons (25), we expect 393
TMEPs to also recruit motoneurons in an orderly manner from small, lower threshold motoneurons 394
to large, high threshold motoneurons. During the current study, the sustained contraction was 395
performed to a constant level of EMG in the VM, ~20% of maximum, which was designed to 396
minimise the recruitment of addition motoneurons and therefore keep a similar number of number 397
of active motoneurons throughout the contractions. With the relatively weak submaximal 398
contraction, mostly smaller, low threshold motoneurons would be active (1) and this roughly split 399
the motoneuron pool into two populations, motoneurons that were active during contraction and 400
those that were not recruited. Then by testing with smaller and larger TMS-TMEPs (~13% and ~40% 401
of Mmax respectively), the effects of fatigue could be compared for a mostly active population of 402
motoneurons (recruited into the small response) versus a combination of the active population with 403
a number of inactive motoneurons (recruited into the large response). The relatively greater decline 404
in small TMS-TMEPs suggests that the motoneurons that were most active during the contraction 405
became less excitable. These results for the quadriceps are consistent with similar findings in the 406
upper arm (27) and suggest that similar processes of inhibition related to repetitive firing occurs in 407
motoneurons innervating the arm and leg muscles. 408
409
The inhibition of motoneurons related to activity-dependent changes from repetitive firing may be 410
due to changes to the intrinsic properties of the active motoneurons. When motoneurons are 411
exposed to a constant injected current, there is an initial (2s) rapid decline of firing which is then 412
followed by a slow decline in discharge rate over tens of seconds (14, 22, 29). This phenomenon is 413
termed spike frequency adaptation with the slow decline termed late adaptation. Late adaptation is 414
consistent with reduced firing rates of quadriceps motoneurons during a sustained 2 min MVC, and 415
17 Additional evidence consistent with intrinsic motoneuron changes comes from in-vivo single motor 417
unit studies which show that greater descending voluntary drive is required to maintain the firing of 418
a recorded motoneuron over time (15, 19). While the specific mechanisms of late spike frequency 419
adaptation have not been completely identified (e.g. (41)), slow inactivation of Na+ channels may 420
contribute and could alter the threshold for action potential activation (6, 29). A requirement for 421
greater input to generate action potentials is consistent with the decrease in TMS-TMEP seen in our 422
study, where fewer motoneurons are recruited by the same stimulus after the motoneurons have 423
fired repetitively in the sustained contraction. 424
425
Another component to the observed depression in motoneuron excitability may be due to inhibitory 426
feedback from group III and IV muscle afferents. As these afferents respond to mechanical and 427
metabolic perturbations their firing is elevated during fatiguing exercise (20, 30). In the upper arm, 428
high rates of firing of these afferents have been associated with reduced excitability of extensor 429
motoneurons, but excitation of flexors (24). As the quadriceps are extensor muscles, they may also 430
be susceptible to inhibition by afferent feedback during exercise (12, 13, 40) c.f (34). Although our 431
current study design does not allow us to comment on the contribution of these afferents to our 432
observed results we would expect afferent feedback to influence the whole motoneuron pool (31) 433
and it could contribute to the depression of both the small and large TMS-TMEPs. 434
435
TMEP
436
By contrast to the decline in the TMS-TMEP, the size of the TMEP was unchanged during the 437
sustained contraction. This finding was expected as the task required the maintenance of 438
motoneuron output in the form of maintaining a constant level of EMG. As the unchanged TMEP 439
occurred despite an underlying reduction in motoneuron excitability shown by the TMS-TMEP, we 440
propose that during the fatiguing contraction, increases in voluntary descending drive were required 441
18 by a progressive rise in the perceived effort required to hold the same level of EMG although 443
increased feedback from group III/IV afferents may also be contributing to increases in RPE (2, 3). A 444
similar pattern of progressive rise in RPE during a maintained EMG contraction has been observed 445
during fatiguing submaximal contractions of the elbow flexors (18, 27). 446
447
Our result showing the reduction in TMS-TMEP but an unchanged TMEP highlights the influence of 448
ongoing descending drive on the evoked motoneuron response. Past studies that measure 449
motoneuron excitability during ongoing drive may underestimate the underlying change in 450
motoneuron responsiveness, but better describe the sum of opposing changes in motoneuron 451
properties, afferent feedback, and descending drive on excitability (21). Indeed, Weavil and 452
colleagues (37) provided evidence that the lack of change in CMEPs during fatiguing cycling with 453
increasing EMG was in fact suggestive of reduced excitability, as the same increase in EMG in an 454
unfatigued muscle resulted in a larger CMEP. In other muscles, progressive increases in EMG during 455
a constant force task have been shown to result in increases in the size of CMEP (16, 23). In these 456
circumstances, increasing excitatory descending drive presumably outweighs reductions in 457
underlying motoneuron excitability. The different changes in evoked potentials in different fatiguing 458
tasks emphasises that interpretation of changes in motoneuron excitability is difficult during 459
voluntary contractions when excitability reflects the integration of many varying inputs, as well the 460
intrinsic properties of the motoneurons (6, 33). 461
462
Recovery
463
By 30 s after the end of the sustained contraction, the excitability of the motoneurons had, on 464
average, recovered towards baseline for both the small and large responses and in all muscles 465
(Figure 2A, 4A C, & 5). Previously a single motor unit experiment reported that ~63% of the recovery 466
of triceps brachii motoneurons after sustained firing occurs in the first 28 s of rest with full recovery 467
19 measure excitability either during the fatiguing task or immediately after, as assessments even 30s 469
later may underestimate the effects of fatigue. 470
In addition, we report that there was a markedly reduced rating of perceived effort coupled with 471
unintended higher task EMG during the first few recovery contractions. Together, these suggest an 472
initial overestimation of descending drive needed to reach the target given that motoneuron 473
excitability had recovered from the end of the sustained contraction. 474
475
In conclusion, this study shows that motoneurons of the quadriceps become less responsive during a 476
fatiguing contraction. This is seen only when tested in the absence of ongoing descending voluntary 477
drive and is likely due to activity-dependent changes of the intrinsic properties of the motoneurons. 478
Furthermore, the increase in RPE indirectly suggests that to maintain motoneuron firing during 479
fatigue, voluntary descending drive must be increased to overcome the reduced excitability. 480
481
Acknowledgements 482
Grants 483
This work was supported by the National Health and Medical Research Council of Australia. HF 484
received support from an Australian Postgraduate Award and the Neuroscience Research Australia 485
Supplementary Scholarship. 486
Disclosures 487
The authors report no conflicts of interest. 488
20 References
490
1. Adam A, and De Luca CJ. Firing rates of motor units in human vastus lateralis muscle during 491
fatiguing isometric contractions. J Appl Physiol 99: 268-280, 2005. 492
2. Amann M, Blain GM, Proctor LT, Sebranek JJ, Pegelow DF, and Dempsey JA. Group III and 493
IV muscle afferents contribute to ventilatory and cardiovascular response to rhythmic exercise in 494
humans. J Appl Physiol 109: 966-976, 2010. 495
3. Amann M, Proctor LT, Sebranek JJ, Eldridge MW, Pegelow DF, and Dempsey JA. 496
Somatosensory feedback from the limbs exerts inhibitory influences on central neural drive during 497
whole body endurance exercise. J Appl Physiol 105: 1714-1724, 2008. 498
4. Bawa P, and Murnaghan C. Motor unit rotation in a variety of human muscles. 499
J Neurophysiol 102: 2265-2272, 2009. 500
5. Bigland-Ritche BR, Dawson NJ, Johansson RS, and Lippold OC. Reflex origin for the slowing 501
of motoneurone firing rates in fatigue of human voluntary contractions. J Physiol 451-459, 1986. 502
6. Brownstone RM, Krawitz S, and Jordan LM. Reversal of the late phase of spike frequency 503
adaptation in cat spinal motoneurons during fictive locomotion. J Neurophysiol 105: 1045-1050, 504
2011. 505
7. Burke R. Spinal motoneurons. In: Neuroscience in the 21st Century. Springer New York, 2013, 506
p. 1027-1062. 507
8. Butler JE, Taylor JL, and Gandevia SC. Responses of human motoneurons to corticospinal 508
stimulation during maximal voluntary contractions and ischemia. J Neurosci 23: 10224-10230, 2003. 509
9. Fuhr P, Agostino R, and Hallett M. Spinal motor neuron excitability during the silent period 510
after cortical stimulation. Electroencephalogr Clin Neurophysiol 81: 257-262, 1991. 511
10. Gandevia S, and Rothwell J. Knowledge of motor commands and the recruitment of human 512
motoneurons. Brain 110: 1117-1130, 1987. 513
11. Gandevia SC. Spinal and supraspinal factors in human muscle fatigue. Physiol Rev 81: 1725-514
1789, 2001. 515
12. Garland SJ. Role of small diameter afferents in reflex inhibition during human muscle 516
fatigue. J Physiol 435: 547, 1991. 517
13. Garland SJ, and McComas A. Reflex inhibition of human soleus muscle during fatigue. J
518
Physiol 429: 17, 1990. 519
14. Gorman R, McDonagh J, Hornby T, Reinking R, and Stuart D. Measurement and nature of 520
firing rate adaptation in turtle spinal neurons. J Comp Physiol A 191: 583-603, 2005. 521
15. Heroux ME, Butler AA, Gandevia SC, Taylor JL, and Butler JE. Time course of human 522
motoneuron recovery after sustained low-level voluntary activity. J Neurophysiol 115: 803-812, 523
21 16. Hoffman BW, Oya T, Carroll TJ, and Cresswell aG. Increases in corticospinal responsiveness 525
during a sustained submaximal plantar flexion. J Appl Physiol 107: 112-120, 2009. 526
17. Hounsgaard J. Motor neurons. Compr Physiol 7: 463-484, 2017. 527
18. Hunter SK, McNeil CJ, Butler JE, Gandevia SC, and Taylor JL. Short-interval cortical inhibition 528
and intracortical facilitation during submaximal voluntary contractions changes with fatigue. Exp
529
Brain Res 234: 2541-2551, 2016. 530
19. Johnson K, Edwards S, Van Tongeren C, and Bawa P. Properties of human motor units after 531
prolonged activity at a constant firing rate. Exp Brain Res 154: 479-487, 2004. 532
20. Kaufman MP, and Rybicki KJ. Discharge properties of group III and IV muscle afferents: their 533
responses to mechanical and metabolic stimuli. Circ Res 61: I60-65, 1987. 534
21. Kennedy DS, McNeil CJ, Gandevia SC, and Taylor JL. Effects of fatigue on corticospinal 535
excitability of the human knee extensors. Exp Physiol 101: 1552-1564, 2016. 536
22. Kernell D, and Monster A. Time course and properties of late adaptation in spinal 537
motoneurones of the cat. Exp Brain Res 46: 191-196, 1982. 538
23. Lévénez M, Garland SJ, Klass M, and Duchateau J. Cortical and spinal modulation of 539
antagonist coactivation during a submaximal fatiguing contraction in humans. J Neurophysiol 99: 540
554-563, 2008. 541
24. Martin PG, Smith JL, Butler JE, Gandevia SC, and Taylor JL. Fatigue-sensitive afferents 542
inhibit extensor but not flexor motoneurons in humans. J Neurosci 26: 4796-4802, 2006. 543
25. Martin PG, Butler JE, Gandevia SC, and Taylor JL. Noninvasive stimulation of human 544
corticospinal axons innervating leg muscles. J Neurophysiol 100: 1080-1086, 2008. 545
26. Martin PG, Gandevia SC, and Taylor JL. Output of human motoneuron pools to corticospinal 546
inputs during voluntary contractions. J Neurophysiol 95: 3512-3518, 2006. 547
27. McNeil CJ, Giesebrecht S, Gandevia SC, and Taylor JL. Behaviour of the motoneurone pool 548
in a fatiguing submaximal contraction. J Physiol 589: 3533-3544, 2011. 549
28. McNeil CJ, Martin PG, Gandevia SC, and Taylor JL. The response to paired motor cortical 550
stimuli is abolished at a spinal level during human muscle fatigue. J Physiol 587: 5601-5612, 2009. 551
29. Miles G, Dai Y, and Brownstone R. Mechanisms underlying the early phase of spike 552
frequency adaptation in mouse spinal motoneurones. J Physiol 566: 519-532, 2005. 553
30. Pollak KA, Swenson JD, Vanhaitsma TA, Hughen RW, Jo D, White AT, Light KC, 554
Schweinhardt P, Amann M, and Light AR. Exogenously applied muscle metabolites synergistically 555
evoke sensations of muscle fatigue and pain in human subjects. Exp Physiol 99: 368-380, 2014. 556
31. Schomburg ED, Steffens H, and Kniffki KD. Contribution of group III and IV muscle afferents 557
22 32. Sherrington CS. The integrative action of the nervous system. CUP Archive, 1910.
559
33. Sidhu SK, Cresswell AG, and Carroll TJ. Motor cortex excitability does not increase during 560
sustained cycling exercise to volitional exhaustion. J Appl Physiol 113: 401-409, 2012. 561
34. Sidhu SK, Weavil JC, Mangum TS, Jessop JE, Richardson RS, Morgan DE, and Amann M. 562
Group III/IV locomotor muscle afferents alter motor cortical and corticospinal excitability and 563
promote central fatigue during cycling exercise. Clin Neurophysiol 128: 44-55, 2016. 564
35. Spielmann J, Laouris Y, Nordstrom M, Robinson G, Reinking R, and Stuart D. Adaptation of 565
cat motoneurons to sustained and intermittent extracellular activation. J Physiol 464: 75-120, 1993. 566
36. Taylor JL. Stimulation at the cervicomedullary junction in human subjects. J Electromyogr
567
Kinesiol 16: 215-223, 2006. 568
37. Weavil JC, Sidhu SK, Mangum TS, Richardson RS, and Amann M. Fatigue diminishes 569
motoneuronal excitability during cycling exercise. J Neurophysiol 116: 1743-1751, 2016. 570
38. Weavil JC, Sidhu SK, Mangum TS, Richardson RS, and Amann M. Intensity-dependent 571
alterations in the excitability of cortical and spinal projections to the knee extensors during isometric 572
and locomotor exercise. Am J Physiol Regul Integr Comp Physiol 308: 998-1007, 2015. 573
39. Wilson S, Lockwood R, Thickbroom G, and Mastaglia F. The muscle silent period following 574
transcranial magnetic cortical stimulation. J Neurol Sci 114: 216-222, 1993. 575
40. Woods JJ, Furbush F, and Bigland-Ritchie B. Evidence for a fatigue-induced reflex inhibition 576
of motoneuron firing rates. J Neurophysiol 58: 125-137, 1987. 577
41. Zeng J, Powers RK, Newkirk G, Yonkers M, and Binder MD. Contribution of persistent 578
sodium currents to spike-frequency adaptation in rat hypoglossal motoneurons. J Neurophysiol 93: 579
1035-1041, 2005. 580
23 Figure captions
582
Figure 1. Experimental protocol. At baseline, five sets of brief contractions were performed to a 583
level of rmsEMG required to generate a force of 25% of MVC. During each contraction, either a 584
TMS-TMEP (closed circle), TMEP (open triangle), or maximal M-wave (closed diamond) was elicited. 585
M-waves were only included in two of the baseline sets. During the 10-min sustained contraction, 586
the stimulation sequence of TMS-TMEP, TMEP and M-wave was performed every minute. From 30s 587
post sustained contraction, recovery measures were performed in a similar manner to baseline 588
measurements with M-waves always included in each set. RPE was reported every minute during the 589
fatigue protocol and after each recovery measure. 590
Figure 2. Task performance and changes in vastus medialis (VM) potentials for all participants 591
stimulated to elicit small baseline TMS-TMEPs (n = 14). A. Force (closed diamonds) and rmsEMG of 592
VM (open triangles) normalised to MVC during the 10-min contraction and recovery contractions. 593
Ratings of perceived effort (RPE; 0 - 10) are displayed on the right y-axis by the grey bars. B. Area of 594
VM TMEPs (open circles) and TMS-TMEPs (closed circles) normalised to Mmax area. Grey shading on 595
the x-axis indicates the recovery measures, which were performed in brief contractions. * indicates 596
significant difference from baseline. For RPE, * indicates significant difference from the start of the 597
sustained contraction (P < 0.05). Data are mean and SD. 598
Figure 3. Overlaid raw traces from the vastus medialis in a single participant across the 599
experiment. A. TMS-TMEPs, recorded on the large or small day (arrows indicate thoracic 600
stimulation). TMS-TMEPs were evoked in the silent period following TMS. The MEP evoked by TMS 601
(circles) is coloured in grey for clarity. Note the decline in the TMS-TMEP from baseline during the 602
10-min sustained contraction (large grey shaded box). Dashed horizontal lines indicate the mean 603
amplitude of the baseline TMS-TMEP or TMEP B. TMEPs on the large and small day. TMEPs were 604
evoked during ongoing EMG. 605
Figure 4. Areas of thoracic motor evoked potentials (TMEPs) and TMS-TMEPS in vastus medialis 606
(VM) for the two days. Each panel presents group data (n = 9; mean and SD) for the large (circles) 607
and small (triangles) days. The top panels show the TMS-TMEP (A) and TMEP (B) normalised to 608
Mmax. For comparison between the large and small responses the bottom panels show the TMS-609
TMEP/Mmax (C) and the TMEP/Mmax (D) when normalised to baseline (bl). * denotes different 610
24 Figure 5. Areas of TMS-TMEPs in vastus lateralis normalised to baseline (bl). Group data (n = 9; 612
mean and SD) is displayed for the large (circles) and small (triangles) days. * denotes different from 613
Amplitude
(mV)
Area
(mV s)
Amplitude
(mV)
Area
(mV s)
Area
%Mmax
Amplitude
(mV)
Area
(mV s)
Area
%Mmax
VM
Small 25.1 (6.4) 0.158 (0.045) 3.9 (1.7) 0.021 (0.009) 13.8 (4.2) 8 (5.5) 0.046 (0.032) 30.1 (19.7)
Large 25.2 (7.2) 0.155 (0.043) 10.6 (3.7) 0.059 (0.019) 39.1 (9.4) 11.2 (6.3) 0.065 (0.035) 43.9 (21.1)
P = 0.863 P = 0.62 P < 0.001 P < 0.001 P < 0.001 P < 0.001 P < 0.001 P < 0.001
VL
Small 22.3 (5.1) 0.143 (0.027) 3.2 (1.3) 0.018 (0.007) 12.6 (3.7) 5.8 (3.5) 0.036 (0.024) 25.8 (15.9)
Large 21.9 (5.9) 0.14 (0.03) 8.6(3.3) 0.051 (0.02) 35.2 (9.4) 8.5 (4.5) 0.053 (0.029) 37.9 (17.5)
P = 0.618 P = 0.556 P < 0.001 P < 0.001 P < 0.001 P = 0.005 P = 0.003 P < 0.001
RF
Small 10.2 (3.2) 0.052 (0.02) 1.6 (0.6) 0.007 (0.002) 15.1 (6.2) 3.2 (1.4) 0.014 (0.006) 30.5 (15)
Large 8.8 (4.4) 0.047 (0.024) 3.4 (2.1) 0.015 (0.012) 35.5 (12.8) 4.8 (3.1) 0.022 (0.016) 48.9 (20.5)
P = 0.369 P = 0.537 P = 0.018 P = 0.046 P < 0.001 P = 0.068 P = 0.118 P = 0.016
Recovery 0:30, 1:30...9:30 TMEP M-wave
Baseline measures 10 minute sustained contraction at 25% EMG 1min
TMS-TMEP
25% EMG 5s
5s 5s
0 5 10 15 20 25 30
Time (min)
*
*
*
*
* *
*
% MVC
bl 5s 2 4 6 8 10 0.5 2.5 5.5 7.5 9.5
0 5 10
RPE
0 10 20 30 40 50 60
Time (min)
*
TMS-TMEP TMEP
B
bl 5s 2 4 6 8 10 0.5 2.5 5.5 7.5 9.5
TMEP
area (% Mm
ax
Large
Small
Large
6 mV
50 ms Small
10-min sustained contraction MEP
TMS-TMEP
TMEP
A
*
*
25 50 75 100 125 150 175
D
C
0 10 20 30 40 50
0 10 20 30 40 50 60 70
0 25 50 75 100 125 150
*
#
TMS-TMEP
area/Mmax
(% baseline)
TMS-TMEP
area (% Mmax
)
*
bl 5s 2 4 6 8 10 0.5 2.5 5.5 7.5 9.5 Time (min)
bl 5s 2 4 6 8 10 0.5 2.5 5.5 7.5 9.5 Time (min)
bl 5s 2 4 6 8 10 0.5 2.5 5.5 7.5 9.5 0
Time (min) bl 5s 2 4 6 8 10 0.5 2.5 5.5 7.5 9.5
Time (min)
TMEP
area (% Mm
ax
)
TMEP
area/Mm
a
x
(% baseline)
Large
0 25 50 75 100
#
Large Small
TMS-TMEP
area/Mmax
(% baseline)
bl 5s 2 4 6 8 10 0.5 2.5 5.5 7.5 9.5
Time (min)