| GENOMIC SELECTION
Evaluating Sequence-Based Genomic Prediction with
an Ef
fi
cient New Simulator
Miguel Pérez-Enciso,*,†,‡,1Natalia Forneris,* Gustavo de los Campos,§,** and Andrés Legarra††
*Centre for Research in Agricultural Genomics (CRAG), Consejo Superior de Investigaciones Científicas - Institut de Recerca i Tegnologia Agroalimentàrias - Universitat Autònoma de Barcelona - Universitat de Barcelona (CSIC-IRTA-UAB-UB) Consortium and†Departament de Ciència Animal i dels Aliments, Universitat Autònoma de Barcelona, 08193 Bellaterra, Barcelona, Spain,‡Institut Català de Recerca i Estudis Avançats (ICREA), 08010 Barcelona, Spain,§Department of Epidemiology and Biostatistics and **Department of Statistics, Michigan State University, East Lansing, Michigan 48824, and††Institut National de la Recherche Agronomique (INRA), Unité Mixte de Recherche 1388 GENPHYSE, Castanet-Tolosan 31326, France ORCID IDs: 0000-0003-3524-995X (M.P.-E.); 0000-0001-8893-7620 (A.L.)
ABSTRACTThe vast amount of sequence data generated to analyze complex traits is posing new challenges in terms of the analysis and interpretation of the results. Although simulation is a fundamental tool to investigate the reliability of genomic analyses and to optimize experimental design, existing software cannot realistically simulate complete genomes. To remedy this, we have developed a new strategy (Sequence-Based Virtual Breeding, SBVB) that uses real sequence data and simulates new offspring genomes and phenotypes in a very efficient andflexible manner. Using this tool, we studied the efficiency of full sequence in genomic prediction compared to SNP arrays. We used real porcine sequences from three breeds as founder genomes of a 2500-animal pedigree and two genetic architectures:“neutral”and“selective.”In the neutral architecture, frequencies and allele effects were sampled independently whereas, in the selective case, SNPs were sites putatively under selection after domestication and a negative correlation between effect and frequency was induced. We compared the effectiveness of different genotyping strategies for genomic selection, including the use of full sequence commercial arrays or randomly chosen SNP sets in both outbred and crossbred experimental designs. We found that accuracy increases using sequence instead of commercial chips but modestly, perhaps by#4%. This result was robust to extreme genetic architectures. We conclude that full sequence is unlikely to offset commercial arrays for predicting genetic value when the number of loci is relatively large and the prior given to each SNP is uniform. Using sequence to improve selection thus requires optimized prior information and, likely, increased population sizes. The code and manual for SBVB are available at
https://github.com/mperezenciso/sbvb0.
KEYWORDScomplex trait; genomic selection; sequence; forward simulation; pig; GenPred; shared data resource
A
SCERTAINING the genetic basis of complex traits has been a goal of geneticists for decades; however, this endeavor is proving to be more difficult to attain than antic-ipated, even with current massive data sets. Nevertheless, molecular information can still be used for genetic prediction. Genomic selection (GS) relies on linkage disequilibrium (LD) between markers and the causal mutations, without the need to identify them (Meuwissen et al. 2001). So far, GS andgenome-wide association studies (GWAS) have been mainly performed with manufactured genotyping array SNPs, but the current genomics status quo is being challenged by the dramatic improvement in sequencing technologies. Array-based experimental designs are now being superseded by analyses of sequence data at population scale. Similarly, for agriculture, the drop in sequencing costs makes it conceiv-able that GS programs can routinely employ genome se-quencing instead of genotyping arrays in the near future.
Sequence data contains all the information needed (i.e., the causal variants) to make the most accurate prediction of genetic merit possible and its use in GS should, in principle, minimize the need to recalibrate prediction equa-tions (Meuwissen and Goddard 2010). Still, the cost of whole-genome sequencing is currently at least one order of Copyright © 2017 by the Genetics Society of America
doi: 10.1534/genetics.116.194878
Manuscript received August 17, 2016; accepted for publication November 23, 2016; published Early Online December 1, 2016.
Supplemental material is available online atwww.genetics.org/lookup/suppl/doi:10. 1534/genetics.116.194878/-/DC1.
magnitude larger than that of array genotyping, and it is likely that this difference will remain large unless very shal-low sequencing is employed. Therefore, it is reasonable to ask under what circumstances the investment in sequencing would pay off, and what outcome can we expect out of large-scale population-scale sequencing studies as compared to high-density genotyping arrays.
This broad question needs to be framed within a specific context, because a variety of factors will influence the re-sponse. This is especially pertinent here, as large discrepancies have been found between simulation and empirical results, even if the latter are still scarce (Hayeset al.2014, 2016; van Binsbergenet al.2015; Caluset al.2016; Heidaritabaret al. 2016). Thefirst factor is the genetic architecture of the trait, together with the demographic history of the population. The second one is the design of the breeding scheme. Finally, the statistical method used to derive prediction equations plays a role as well. The genetic determinism of complex traits is not understood in detail and few causal mutations have been identified so far. Yet, a combination of theoretical, simula-tion, and empirical results has broadened our understanding in recent years. First, the number of causal loci seems to be quite large, at least in the hundreds, and partially population-specific (Hill 2012; Pickrellet al.2016). The latter can be due to either false discoveries that are not replicated or to low power because of small effects. Also, evolutionary forces such as mutation and drift modify the frequency of potentially causal loci in the populations. Second, the SNPs uncovered by even the largest GWAS usually account for only a modest fraction of total genetic variance. This reinforces the hypoth-esis of abundant small genetic effects. Third, the distribution of QTN effects is highly leptokurtic and can be reasonably well approximated by a gamma density (Hayes and Goddard 2001; Eyre-Walker and Keightley 2007; Caballero et al. 2015). In addition, a critical parameter determining the dis-tribution of loci variances is the correlation betweenfitness and the trait studied. Caballeroet al.(2015) found by simu-lation that common (q .0.05) variants of at least modest effects will be responsible for most of the genetic variance in traits loosely correlated tofitness or neutral traits, whereas rare variants of large effect are relevant for highly selected traits or fitness itself. Furthermore, selection is expected to induce a negative correlation between effect and frequency, simply because large-effect QTNs at intermediate frequencies reach fixation or near fixation quickly, e.g., IGF2 in pigs (Ojedaet al.2008), and they would contribute very little to total variance. However, sometimes alleles of large effect can have both positive and detrimental effects and they keep segregating by balancing selection, such asDGAT1in cattle (Grisartet al.2002) or Socs2 in sheep (Ruppet al.2015). To our knowledge, no GS simulation study has included all these
“subtleties”when modeling the quantitative trait.
Regarding the breeding scheme, thus far, GS simulation and empirical studies have paid special attention to dairy cattle genetic improvement. This was thefirst species where GS was applied due to its peculiar population structure, since
GS can be quite effective in reducing the long generation interval in dairy cattle (García-Ruizet al.2016). Currently, GS is being extended to other species. Domestic species are usu-ally structured in populations with limited genetic exchange (breeds). This is important because accuracy depends, among other factors, on the size of the training population and some populations have an upper barrier due to small size. In this scenario, implementing GS is more challenging due to heterogeneous and small populations, and the combi-nation of different breeds to increase training population size has been proposed (de Rooset al.2009; Zhonget al.2009). However, the increase in accuracy is not automatic and de-pends crucially on the existence of shared segregating loci of large effect (Hayeset al.2009; Karouiet al.2012). It has been argued that the use of sequence could overcome this prob-lem, allowing accurate predictions across populations (van den Berget al.2016).
The choice of GS method to be used for any largep/smalln statistical problem requires either shrinkage or variable se-lection (or a combination of both). This issue is unavoidable with sequence data irrespective of data size; note thatp(the number of regressors or SNPs from sequence) will always be much larger than the number of individuals (n), since SNP number increases proportionally toP2i¼n1211=i;in a neutral model, and this function increases monotonically. Therefore, even with the largest of population sizes, we need to set additional restrictions (priors) on the regressors for the model to be applicable. Note that in a p .nscenario, the influence of prior distribution does not vanish even asn in-creases (Gianola 2013). In practice, two main strategies are being used for prediction in GS: genomic best linear unbiased prediction (GBLUP) (VanRaden 2008), which employs all markers to build a genomic relationship matrix (GRM) and induces homogeneous shrinkage of their effects, and the fam-ily of Bayes methods that select a subset of variables such as Bayes B (Meuwissenet al.2001) or BayesR (Erbeet al.2012). From a computational perspective, GBLUP is the method of choice because it naturally accommodates very complex models (e.g., multiple trait and genotype-by-environment in-teraction) and very efficient algorithms exist (VanRaden 2008; Misztal 2016). Bayesian methods should, in contrast, provide better insight on the true state of nature than GBLUP by identifying neutral and causative SNPs. They also extend very naturally to genome-wide association methods (Moser et al.2015).
contrast, Macleodet al.(2016) reported a modest increase in the accuracy of genomic prediction for mixed breed popula-tions when different weight priors in coding and regulatory regions were used, compared to high-density SNP genotypes with flat priors. These empirical results contrast with most simulation studies, which were much more optimistic (Meuwissen and Goddard 2010), although broadly agree with our previous simulation study (Pérez-Enciso et al. 2015), where we used a mixed coalescence gene dropping method together with a leptokurtic distribution of gene effects.
Simulation is a fundamental tool to evaluate alternative experimental designs or to interpret the outcome of selection in complex scenarios. Although numerous simulation tools do exist (e.g., Peng et al. 2012; Kessner and Novembre 2013; Messer 2013; Chenget al.2015), they suffer from different limitations that may be critical when complete genomes need to be considered. Forqs (Kessner and Novembre 2013) was conceived for population genetic applications rather than plant and animal breeding, and using real sequence data or complicated genetic architectures (e.g., epistasis) is not straightforward. In fact, extant simulation tools such as co-alescence and gene dropping, which incorporate mutation, are unable to efficiently simulate complete genomes in a re-alistic manner. One of their limitations is the impossibility of simulating complete large genomes and retrieving the ob-served patterns of LD and of variability. This may lead to implausible or biased conclusions: the general overoptimistic predictions reported for sequence-based GS compared to ar-ray genotyping suggest that simulations may not be com-pletely accurate.
To remedy this, and improving our previous approach (Pérez-Encisoet al.2015), we here propose using real com-plete genome data and simulating new genomes by gene dropping in a very efficient manner: the Sequence-Based Vir-tual Breeding (SBVB) approach. By using real sequence data, we avoid the computationally intensive, yet likely unrealistic, effort needed to generate full sequence data, and we are able to accurately investigate the performance of actual commer-cial arrays. Using this tool, we investigate the performance of full sequence for GS in the pig species, compared to alterna-tive strategies. Furthermore, we consider alternaalterna-tive genetic architectures based on the considerations discussed above.
Methods
SBVB algorithm
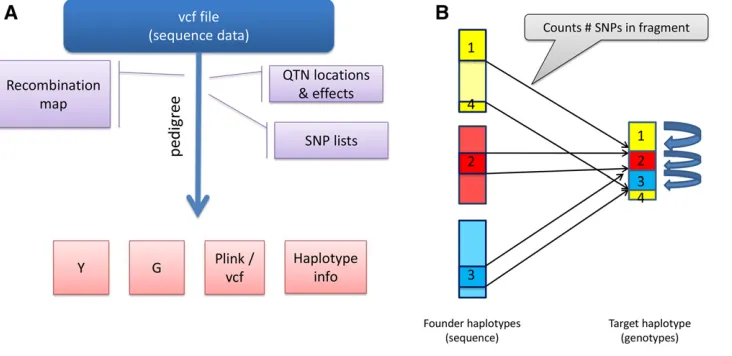
SBVB is a flexible tool for the generation of molecular and phenotypic data using real sequence data, according to spec-ified genetic architectures and pedigrees. Figure 1A shows a graphical representation of the SBVB software. The program requires a parameterfile, auxiliaryfiles such as a recombina-tion map, pedigreefile to perform gene dropping, causal SNP (QTN) positions, and afile containing all sequence genotypes in standard vcf format (Liet al.2009). No missing genotypes
are allowed, and data must be phased so that SBVB can iden-tify the haplotypes to be transmitted to the offspring. Starting with the haplotypes provided as inputs, which act as“ foun-der,”the algorithm performs gene dropping. The user can specify variable recombination rates along the genome and between sexes as well as sex chromosomes. Importantly, while doing gene dropping, SBVB stores only the recombina-tion breaks and keeps track of the haplotype id from the founder individuals (Figure 1B) (Pérez-Encisoet al.2000). This results in computer time (CPU) and memory demands that increase linearly with the number of individuals and total genetic map length, but not on the number of markers. This, together with efficient algorithms to recover the marker genotype at desired positions, makes it able to very quickly simulate sequence data for thousands of individuals.
Trait architecture: SBVB is extremelyflexible in terms of
genetic architecture, as any number of traits with their own QTNs and allelic effects can be specified. At a minimum, the QTN positions for each trait must be specified, and these must be present in the vcffile or they are otherwise ignored. Additive and dominant effects can either be specified (hard-coded) or sampled from gamma, normal, or uniform distributions. In this latter case, effects are sampled indepen-dently of QTN frequencies. This can be appropriate if the trait is neutral, yet it is not expected under selection. To produce more realistic sampling, SBVB allows the generation of cor-related additive effects and frequencies. This is done by sorting allele effects and frequencies that correspond to maximum attainable correlation. Next, a dummy variable is generated by adding a random deviate to the allele effects such that the correlation between the dummy variable and the frequency is as expected;finally, true effects are back-sorted according to dummy order. Epistatic action (two loci) can also be specified and each trait can have its own epistatic basis. Environmental variance is determined given desired broad- or narrow-sense heritability.
Genotyping arrays:SBVB can handle any number of
geno-typing arrays simultaneously. This means that the program can compute GRMs or print molecular information, e.g., in Plink format (Purcellet al.2007) obtained with different SNP lists in the same run. Each SNP list needs to be specified in separatefiles, and the only prerequisite is that SNPs must be present in the vcffile or are ignored. As a future step, we will implement an option to validate imputation.
Recombination: The recombination map file specifies the
experimentally observed in most species (Mercieret al.2015), although this bound can be modified. The actual number is sampled from a truncated Poisson. No interference is consid-ered, i.e., recombination breakpoints are sampled indepen-dently. Sex chromosomes can be modeled.
Any number of SNPs can be handled by saving only the recombination breakpoints and accessing each of the individ-uals’nonrecombinant blocks in an efficient manner (Figure 1B). This is done by traversing the nonrecombinant block boundaries only (which is typically orders of magnitude smaller than the number of markers), and keeping track of which genotype corresponds to each marker, given the block and the founder haplotype id. The assignment of genotype to founder haplotypes’id needs to be done only once, saving CPU time. SBVB saves the haplotype structure, which allows restarting the program with different parameters (e.g., differ-ent QTN positions, effects, orh2).
Selection: SBVB only performs gene dropping following a
predefined pedigree, but selection such as in a current breed-ing program can be implemented easily (Supplemental Ma-terial,Figure S5). This is possible since the software can save the haplotype structure of all individuals in the pedigree up to the current generation. Then, individuals can be selected and a new generation can be added to the pedigree. The next run of SBVB reads all current haplotypes and generates the new offspring genomes, conditional on extant ones. Haplotype information contains only recombination breakpoints and haplotype ids, so can be quickly read and written.
SBVB output includes phenotypes, true breeding values, and QTN information (e.g., variance explained and substitution ef-fects). In addition, SBVB can also print individual genotypes and GRMs obtained for each desired genotyping array, including sequence. Source code and examples are at https://github. com/mperezenciso/sbvb0. A manual is also attached inFile S1.
Sequence data analysis
We downloaded 107 public pig sequences from the short-read archive, http://www.ncbi.nlm.nih.gov/sra (Groenen et al. 2012; Molnár et al. 2014; Ai et al. 2015; Bianco et al. 2015a; Choi et al. 2015), pertaining to 32 Large White (LW), 19 Landrace (LR), 14 Pietrain (PI), 27 Duroc (DU), and 15 Meishan (MS) pigs. Alignment was carried out with BWA (Li and Durbin 2009), PCR duplicates were removed with samtools, and bam files were then realigned around indels with GATK IndelRealigner tool (McKenna et al. 2010). SNP calling was performed with samtools/bcftools suite v. 1.2.1 (Liet al.2009) separately for each individual. SNPs were called in positions with read depth bounded be-tween 53and twice the average depth plus one. Only auto-somal SNPs were considered. We extracted the regions with minimum and maximum depth using samtools depth, further filtering by minimum map and base qualities and then, using bedtools (Quinlan 2014), we intersected these regions with the homozygous blocks provided in the individ-ual gvcffile. This resulted in a modified gvcffile where both SNPs and homozygous blocks had beenfiltered by the same criteria. Finally, all vcffiles were merged in a singlefile for the 107 individuals. All SNPs found with at least two copies of the nonreference allele and missing rate ,30% were retained, making a total of 28,391,011 SNPs. Finally, missing SNPs and phases were predicted with Beagle 4 (Browning and Browning 2013). Given the weak structure and the close-ness between LW, LR, and PI, we merged them into a single LW population, consisting of 65 sequences that we generi-cally called LW.
Population structure
three discrete generations of half and full sibs in LW, and two generations in DU and MS. Within each breed, each sire was mated to two sows and produced six offspring. About 160 (6%) individuals were inbred, and the inbreeding co-efficient was.0.25 in30 of those. The total number of LW, DU, and MS samples was 1829, 291, and 315, respec-tively, including base animals. The total number of pigs in the pedigree was thus 2435. This was designed to mimic a scenario with a predominant breed and additional breeds of lesser importance, a setting that has been typically advo-cated as the most favorable for the use of sequence data when compared to SNP arrays (de Roos et al. 2009). In the three-way crossbred pedigree (3WC), the 65 LW pigs were crossed to the 27 DU, and the resulting 300 F1 animals were mated to the 15 MS samples producing a total of 3000 3WC animals. The total pedigree size was 3410. The recombination map in Tortereau et al. (2012) was employed.
Genetic architecture
The precise genetic architecture of complex traits is un-known, but the increasing number of empirical and simula-tion studies is helping to delineate plausible ranges of parameters. For the distribution of allelic effects, numerous studies (Eyre-Walker and Keightley 2007) confirm that it is highly leptokurtic, with many near-zero effects and a few large effects. This distribution can be approximated by a gamma, and here we used aG(shape = 0.2 and scale = 5) based on the simulation study by Caballeroet al.(2015); the shape of this distribution is not too different from the review in Hayes and Goddard (2001) and employed previously by us (Pérez-Encisoet al.2015). Heritability of the simulated phenotype was 0.5.
1. In the neutral architecture, 1000 SNPs were randomly sampled among the 28 million SNPs andG-sampled addi-tive effects were randomly assigned. SinceGalways takes positive values, which implies that the alternative allele increases the phenotypic value, 50% of additive effects were randomly assigned a negative sign.
2. In the selective architecture,ca. 1000 SNPs were chosen from those in genes with lowest Tajima’s D in LW and largest Fst between LW and European wild boar. Among those SNPs, we selected as causal QTN those that had a high or moderate effect as inferred from a variant effect predictor tool (McLaren et al. 2010) plus a fraction of SNPs in UTR regions. Again, additive effects were sampled from aG(0.2 and 5), but in this case a negative correlation between absolute additive effect and frequency was in-ducedr=20.60, as found empirically (Caballero et al. 2015; Yanget al.2015).
Note that we used only LW as the breed to model the selective architecture, instead of all breeds, even if QTN effects were constant across breeds. The rationale was that selection usually acts locally, and that breeds are selected for different phenotypes.
Genomic prediction
With GBLUP, we evaluated the predictive performance of alternative GRMs:
1. QTN: all causal variants.
2. GENES: all SNPs within any causal gene. This option was used only in the selective model, the rationale being that the notion of gene is not defined in a pure infinitesimal model, as it assumes that causal variants are distributed uniformly through the genome.
3. SEQ: Sequence,i.e., all 28 million SNPs.
4. 50KI: Illumina’s 60,000 array. It contained about 50,000 informative SNPs in the data set.
5. 700KA: Affymetrix 700,000 array. It contained about 500,000 informative SNPs.
6. 50KR: 50,000 randomly sampled SNPs. 7. 500KR: 500,000 randomly sampled SNPs.
8. MAF01: GRM computed with 1 million random SNPs with minimum allele frequency (MAF),0.10.
9. MAF10: GRM computed with 1 million random SNPs with MAF.0.10.
10. 2MAF: a model comprising MAF01 and MAF10.
For each evaluation model (i.e., each GRM), we considered four cross validation scenarios in the outbred pedigree:
1. 50% of LW phenotypes from the last generation were re-moved and their breeding values predicted.
2. 50% of DU phenotypes from the last generation were re-moved and breeding values predicted.
3. 50% of MS phenotypes from the last generation were re-moved and breeding values predicted.
4. All DU phenotypes were removed and breeding values predicted.
In the 3WC, the strategies compared were:
1. All 3WC pig genetic values were predicted using only pure LW, DU, and MS.
2. 20% of 3WC pig genotypes were predicted using LW, DU, MS, and the rest of 3WC.
3. 20% of 3WC pig genotypes were predicted using LW, DU, MS, F1, and the rest of 3WC.
run 10 times. The same pedigree was used across replicates but QTN effects, genotypes, haplotypes, and phenotypes varied.
GBLUP blindly uses all marker genotypes to compute the GRM. This method may not be optimal when variance con-tribution from each locus is highly heterogeneous (Daetwyler et al.2010). To compare with GBLUP, we employed BayesR, a hierarchical Bayesian mixture model (Erbe et al. 2012). BayesR samples the SNPs to have an effect in the model and assigns them to discrete classes, according to a
prespeci-fied contribution to total genetic variance. By default, SNPs are grouped in four classes that explain 0, 1024, 1023, and
1022of total genetic variance, respectively. Although we used
the efficient implementation in Moseret al.(2015), BayesR was not feasible in all scenarios, such as with the 28 million sequence SNPs. For that reason, BayesR was run in a limited number of scenarios: QTN, 700KA (Affymetrix array), 500KR, and all 2 million SNPs from MAF01 and MAF10 plus the causal SNPs, as a substitute for using complete sequence. We assessed predictive performance for 10 replicates of the outbred pedigree in which either 50% of LW or 50% of MS from the last generation were removed and predicted, as with GBLUP. For the“sequence”(SEQ) analysis, 100,000 iterates were employed and 50,000 (the default) for the rest of cases. Thefirst 20,000 samples were discarded as burn-in.
Data availability
The authors state that all data necessary for confirming the conclusions presented in the article are represented fully within the article.
Results
Genetic architectures
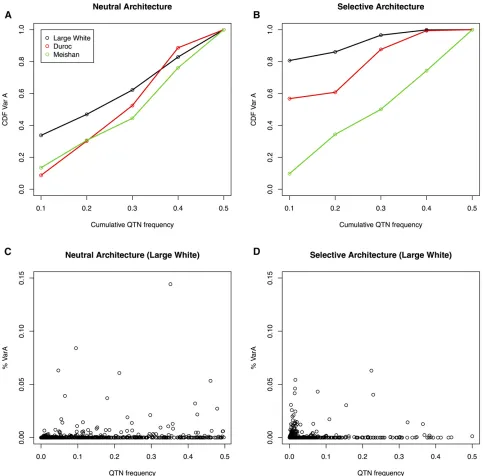
The QTN site frequency spectra (SFS) for both the neutral and selective architecture can be compared inFigure S1for LW. The selective architecture is enriched in rare variants, com-pared to the neutral SFS. Then,a priori, the selective scenario should be favorable to the use of sequence compared to SNP arrays, which are biased toward high MAF variants. Impor-tantly, the two genetic architectures result in distinct contri-butions to total additive variance when QTNs are grouped by MAF. Under a neutral architecture, theory dictates that the fraction of genetic variance explained by SNPs at MAF,qis q%, because variance is proportional toq(12q) and the folded SFS is proportional to 1/q3(12q). This is what we observe in our neutral simulations for all three breeds (Figure 2A). The cumulative distribution is, in contrast, highly distorted in the selective architecture (Figure 2B). In this case, up to 80% of genetic variation is due to variants of MAF,0.10 in LW. In contrast, MS is not affected by a selective architecture in LW, despite identical QTN positions and allele effects, due to the large genetic distance between both breeds (see below). DU architecture is somewhat closer to LW than to MS. Figure 2, C and D plot QTN frequency vs.its contribution to total
vari-ance for the LW breed. Thefigure shows that loci at moderate or high frequency may occasionally explain a large part ofh2
(#15% in the case shown) in neutral architectures whereas this is much rarer in the selective case. These results are in agreement with empirical results from Yanget al.(2015) (see their Figure 4A), or simulations (Caballeroet al.2015).
Importantly, differences between breeds regarding the distribution of genetic variances (Figure 2, A and B) are due only to differences in SNP frequencies, since allele effects are constant. Therefore, it is illuminating to consider the joint SFS of QTNs between breeds (Figure S2). The correlations in QTN frequencies between LW and DU were0.74 and 0.80 for the neutral and selective architectures, respectively, but they were much lower, 0.47 and 0.38, between LW and MS, respectively. In the selective architecture,550 out of near 800 segregating QTNs in LW were fixed in the MS breed. Previous genome-wide variability studies have shown that SFS are markedly different between European and Asian breeds (Bianco et al. 2015b), and that this is exacerbated in the case of a selective architecture, as a result of low-frequency variant enrichment. Logically, this has a strong im-pact on the amount of genetic variance explained by the same QTN in two breeds. The correlation in additive genetic vari-ances explained by each QTN was only0.18 in the selective architecture between LW and MS populations, whereas it was 0.50 for the neutral case. The top 16 QTN that explained 85% ofh2in MS only accounted for 12% ofh2in LW. Divergence in
allele frequencies between breeds is a major issue that has a dramatic impact on genetic correlation, even when causal mutations and effects are the same (Figure 3). Domestic spe-cies are highly structured in breeds with limited or no genetic interchange, and we can therefore expect that results similar to those in Figure 3 orFigure S2will be the rule rather than the exception. This, together with small effects and limited sample size, might also explain the low replication rate that is sometimes observed between GWAS studies; logically, in-creasing sample size and stringency in declaring an associa-tion increases repeatability (Visscheret al.2012).
GBLUP genomic prediction in outbred populations
Next, we investigated the influence of the genetic architecture and the effects of the use of sequence data on prediction accuracy by Monte Carlo simulation in the 2435 pig genome pedigree of LW, DU, and MS breeds, arranged in half- and full-sib families. Molecular data were assumed to be available for all animals in all scenarios. In the current implementation of SBVB and for the data size described, the pig simulation itself consumed negligible amounts of CPU time (,1 min) in a linux workstation compared to parsing and reading the 28 million polymorphism file (20 min), obtaining the GRMs for 500,000 SNPs (20 min) or obtaining the GRM with sequence (10 hr).
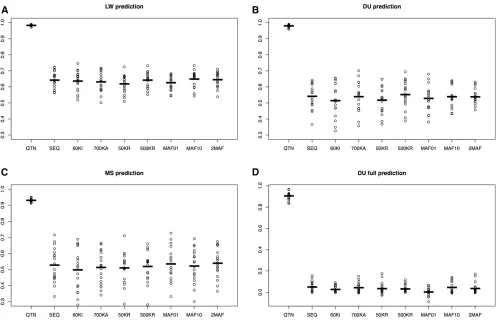
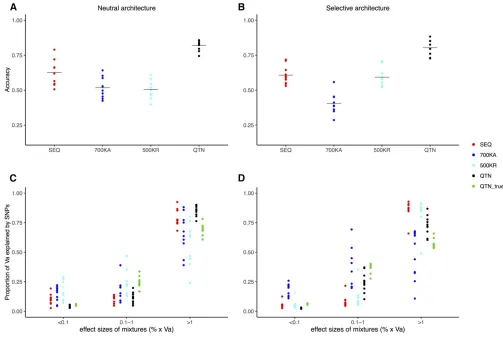
Results of 10 replicates for the neutral architecture are in Figure 4. Values reported are accuracies with GBLUP,
prediction within LW (r20.63 on average), while accuracies
were similar in either DU (r20.54) or MS (r20.52). This
shows that the amount of data has a larger influence on GS performance than genetic distance between populations: there were 1829 LW, 291 DU, and 315 MS in the pedigree. In agreement with this, prediction was impossible when no individuals from the DU breed were phenotyped, unless QTNs were known (Figure 4D).
Figure 4 also shows that differences across SNP sets were minimal except in the unlikely scenario where all
causal mutations were known (QTN). All breeds combined (Figure 4, A–C), the average accuracy obtained with se-quence was 0.57,i.e., 4% larger than with the 60k Illu-mina array (0.55) and 2% larger than with the higher density 700k Affymetrix array. There were no differences between using complete sequence, 500,000 random SNPs (500KR) or when SNPs were selected among those with MAF . 0.1 (MAF10). A model with two random effects (2MAF) did not provide any substantive improvement ei-ther (,1%).
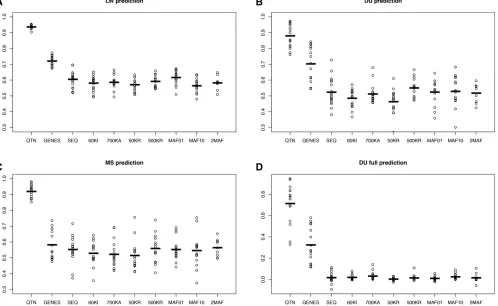
Figure 5 presents the outcome for the selective architec-ture. In this case, we considered an additional model where all SNPs located within genes containing any QTN were in-cluded in the model (“GENES”model). For the neutral archi-tecture, we assumed that any SNP has the same probability of being causal and therefore the concept of “causal gene” is undefined in this case. The GENES model in fact evaluates how much accuracy is gained had all SNPs in tight disequi-librium with QTNs been identified, which isa prioria less ambitious goal than identifying all causal mutations. The GENES model resulted in an important increase in accuracy (20%) compared to SEQ, although it was quite dependent on the actual experimental design; it was associated with larger variances across replicates and the advantage when predicting MS breeding values was minimal (Figure 5C). The GENES model was an improvement compared to SEQ and the rest of the models but still unsatisfactory (r20.30,
Figure 5D). Knowing the causal genes may not be enough if the genetic distance between breeds is large.
Overall, results for the neutral and selective architectures were similar (Figure 4 and Figure 5), suggesting that GS performance, at least with GBLUP, is relatively independent of the genetic architectures considered. For the selective ar-chitecture and in the LW breed, SEQ resulted in an increase of 3% in accuracy compared to Illumina’s 60k or Affymetrix
700k, and only 1.7% higher compared to 500KR. In con-trast, using only rare SNPs to build up the GRM (MAF01) resulted in a modest increase in accuracy compared to SEQ (2%). For either DU or MS, this small improvement of MAF01 was not observed, likely because of the low correlation be-tween breeds in terms of their joint SFS (Figure S2).
BayesR performance
We tested the performance of BayesR in our data but, due to much larger CPU time requirements than GBLUP, we chose a subset offive representative evaluation models only (see Ma-terials and Methods). In agreement with GBLUP, the most favorable scenario was prediction within LW (r20.55 when
averaged over SEQ, 700KA, and 500KR models), while accu-racies were lower for MS (r20.42), evidencing once again
variability across replicates with the Affymetrix array (700KA model) than with the other arrays. All this suggests that, depending on the relevance of rare frequency variants, cus-tom arrays where SNPs are discovered in the target sample may be more effective than commercial arrays if BayesR or comparable methods are to be used, and if rare variants are important for the genetic determination of the trait. Other-wise, commercial arrays should suffice.
An advantage of BayesR over GBLUP is that it provides a classification of SNPs according to their predicted contribu-tion to total genetic variance, facilitating the inference of genetic architecture. By default, BayesR classifies causal SNPs in three classes: those explaining 1024, 1023, and 1022units
of genetic variance (Erbeet al.2012). Overall, BayesR was able to detect an increased fraction of variance caused by small-effect QTNs under the selective architecture (Figure 6 and Figure S3) with the Affymetrix array or if QTN were known, although estimates were associated with a large var-iability. Note in particular that the fraction of medium-effect QTNs was systematically underestimated with sequence data.
Crossed population
In many livestock and plant species, crosses are exploited commercially instead of purebred individuals. A potentially important role of GS would be to predict the performance of commercially crossed animals based on data from purebred individuals. We ran SBVB through a 3WC pedigree that in-volved the three breeds and comprised a total of 3400 animals (see Materials and Methods). The ideal target would be to predict 3WC performance based solely on purebred perfor-mance. We found that accuracy in this case was relatively modest (r20.45 for all models,Figure S4A) but, in practice,
the advantage of being able to predict the performance of crosses may overcome this low accuracy. Importantly, even knowing all QTN did not improve accuracy dramatically (r20.53). The next two settings compared whether it is
use-ful to phenotype and genotype F1 individuals, provided that corresponding data from a subset of the 3WC animals are already available (Figure S4, B and C). Interestingly, the sim-ulations show that genotyping, or sequencing, the F1 was not useful, provided data from the 3WC are available; overall accuracies were almost identical (Figure S4B vs. Figure
S4C). Again, similar performance between SEQ and the other models was also observed for the crossed individuals.
Discussion
Currently, the availability of genome data at a population level, such as the UK10K project (www.uk10k.org) and com-parable initiatives in humans but also in agriculture or model species, pose new challenges for simulation software. Argu-ably, neither coalescence nor extant forward methods can tackle the realistic simulation of complete large genomes at this scale. Here, as an improvement on Pérez-Enciso et al. (2015), we propose instead the simple, yet powerful, ap-proach of using real data and use efficient forward algorithms to investigate the use of complete sequence at the population scale. We have also proposed new genetic architectures that should be more realistic than those in Pérez-Enciso et al. (2015), and have explored the scenario of crossed popula-tions. Surprisingly, our conclusions are similar.
SBVB is a very flexible tool that implements efficient algorithms. In particular, it keeps track of recombination
increasing parallelization. Similarly, reading and writing largefiles can be sped up if binary instead of text files are managed.
Genomes are extremely complex and the demography of any population under study is typically unknown, obliging us to simplify simulation studies. Using real data circum-vents this limitation. A potential problem is that, with this approach, one is sampling a single realization of the co-alescence process. Here, for instance, we used most of the main breed sequences that are publicly available, but it was still a modest number. However, from a Bayesian inference perspective, this is no obstacle. More practically, using real data may restrict the generality of the results but, logically, our approach can also be started with simulated data under simplified assumptions. Some errors are incurred in using real sequence with imputed and phased genotypes. Never-theless, we believe this should have a very mild effect for our purposes, since they would primarily affect rare variants, and simulations are conditional on the data provided. A more serious limitation, in our opinion, is the availability of
enough complete sequences for the founder populations. Although this will be of lesser relevance as data accrues, it is a serious hindrance at present. To palliate this as of now, we propose to generate small random dummy pedigrees that, starting with extant real genomes, will result in a new recombinant genome that can be used as additional foun-ders. SBVB has built in this option already, and both the number of generations and the number of founders of the dummy pedigree can be specified. The current algorithm ensures that founders are evenly sampled from the avail-able sequences.
cattle, where a single breed has a dominant part of the market and where GS has been efficiently implemented, pig breeding depends on a larger number of breeds and the commercial product is a cross between breeds. Under this setting, the usefulness of GS will diminish since predic-tive accuracy decreases as the training population size de-creases, but it is also a scenario where sequence could be most useful. Prediction across breeds is a topic of practical relevance that was also investigated here. Our study shows that there exists an advantage of using sequence over com-mercial or random SNP arrays, but that the gains in predic-tion accuracy were modest (,4% on average), and this result was independent of the genetic architectures consid-ered when GBLUP was employed (but not with BayesR). This seems to be in conflict with simulation studies report-ing an influence of genetic architecture performance (Daetwyler et al. 2010). The simulations of Daetwyler et al.(2010) assumed a neutral architecture, and the differ-ences found depended on the number of QTNs, with equal effects sampled from a normal distribution; here we instead assumed leptokurtic distribution for QTN effects and a rel-atively large number of QTNs, as found in the literature. Nevertheless, we did find an influence of genetic architec-ture,e.g., accuracy with Illumina’s 60k array was 0.64 and 0.58 in the neutral and selective architectures, respectively, although the relative advantage of SEQ compared to com-mercial arrays was consistently 2–4%. Other authors have found an important effect of LD or of effective population size (MacLeodet al.2014), and we should note that we are using species with long-range LD.
It has been found (e.g., Daetwyleret al.2010) that vari-able selection methods such as BayesR tend to overperform pure shrinkage methods such as GBLUP when a small num-ber of loci with large effect exist. Such major loci were rare in our simulations; although some QTN could occasionally explain near 15% of total genetic variance in the neutral architecture, their individual effects were often much
,5% (Figure 2). In agreement with this, we did notfind a net improvement of BayesR over GBLUP in accuracy (Fig-ure 6 andFigure S3vs.Figure S4andFigure S5). BayesR was much more sensitive to genetic architecture and to the SNP set used than GBLUP (Figure 6), as also reported by Daetwyler et al. (2010). Importantly, BayesR performed better with a random set of SNPs than with commercial SNP arrays. It has been proposed that having customized arrays with SNPs segregating in the population of interest can be a good alternative to sequencing (Pérez-Enciso 2014), and our simulations tend to confirm this if BayesR or similar methods are used. BayesR groups SNPs by their fraction of genetic variance explained. Here, we observed an increased shrinkage with sequence and an ensuing overestimated fraction of SNPs of largest effect. Therefore, it seems that the classification provided by BayesR should be treated with caution at very high marker density be-cause of overshrinkage or confounding between SNP estimates.
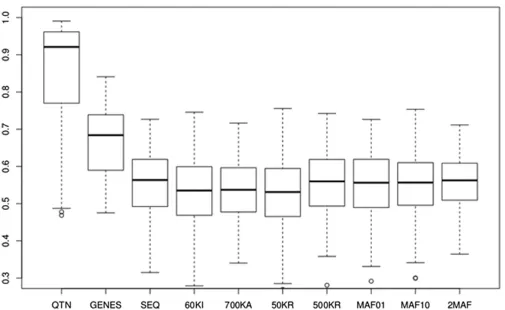
Evidence regarding the use of sequence for GS so far has been conflicting. While earlier simulation studies suggested that response could be boosted by as much as 40% (Meuwissen and Goddard 2010), the very few empirical studies so far have reported either no or a small advantage (Hayes et al. 2014, 2016; Calus et al.2016; Heidaritabar et al.2016). As a summary, Figure 7 shows the accuracies obtained with GBLUP by averaging all simulations across architectures and designs, outbred and crossbred combined. Overall, we predict an increase in accuracy of SEQvs. Illu-mina’s 60k of3.8% and of 2.8% over Affymetrix’s 700k array. In turn, we found no advantage of sequence over 500KRs, or when GRMs are computed by groups of SNPs according to frequency (MAF01, MAF10, and 2MAF). Yang et al.(2015) proposed partitioning SNPs according to their MAFs and computing separate GRMs, showing that this multi-random model was able to recover all missing herita-bility in human height and body mass index. Here, wefind that using MAF01 or MAF10 can improve accuracy in the selective or neutral architectures, respectively, i.e., when rare or common variants are most relevant, but that the improvement was marginal. Model 2MAF resulted in a minimal increase (0.7%) compared to SEQ. These results suggest that the improvement of sequence vs.commercial arrays for predicting genetic merit is likely to be small even in a multiple breed scenario, at least with GBLUP and flat priors.
According to Goddard (2009), prediction accuracy de-pends on two main factors: (i) the proportion of variance at QTN that can be captured by markers (the so-called“genomic heritability”) (e.g., de los Camposet al. 2015) and (ii) the accuracy of estimated effects. Thefirst factor depends on the extent of disequilibrium between markers and QTN. The sec-ond one depends mainly on the ratio between sample size and the number of markers used in the model. However, there are important tradeoffs between these two factors. With sequence data, the genomic heritability can achieve its upper-bound (the trait heritability); yet, the number of effects to be estimated is large and this reduces the accuracy of estimated effects. Therefore, one of the explanations of why models based on SNP arrays perform similarly to models based on full sequence is the relatively small sample size used in most GS studies (small in the sense thatn,,p). Big data may be needed to obtain the most out of sequence information.
recent sequencing work using 35,000 diabetics and 110,000 controls revealed that common variants explain most of the genetic determinism for this disease (Morris et al.2012). The second approach is to give unequal weights to each SNP according to biological knowledge, such as non-synonymousvs.synonymous variants; recent works suggest that this can enhance the value of sequence as well in prac-tice (MacLeodet al.2016).
Here, we have applied our tool to study the performance of GS in very large genomic data sets. Certainly, there are other important potential applications of SBVB, in addition to those investigated here, particularly in the evaluating the performance of GWAS full sequence studies or studying the genome dynamics of actual plant or animal breeding schemes. Several ongoing GWAS experiments have pro-duced or have plans to obtain hundreds or thousands of complete genomes. This amount of sequence data has sparked an interest in developing specific tests for “rare” variants (actually the most common set of variants) such as SKAT (Ionita-Lazaet al.2013) or others (Hoffmann and Witte 2015). Our approach makes it possible to test their
performance under a variety of genetic architectures in re-alistic data sets. A reliable assessment of power and false discovery rate seems essential to correctly interpret the re-sults of these studies, and SBVB can be used for this purpose in an efficient andflexible manner.
In conclusion, we propose to use real sequences as initial population genomes for realistic simulation studies in mas-sive genomic data sets. In this way, we ensure faithful representation of the properties of real commercial arrays or of specific SNP positions. With this approach, we have found that sequence-based GS may increase response to GS, but modestly, perhaps by up to 4% in our scenario, and this result is robust to extreme genetic architectures. This applies at least when GBLUP with equal priors given to each SNP is employed and the number of loci is relatively large. Our results are far less optimistic than initial simulations but, importantly, agree with incipient empirical evidence on the use of sequence to predict genetic merit. In our opinion, future efforts should focus on methods to optimize the prior information in prediction tools, including accurate mapping of causal mutations.
Acknowledgments
We thank J. Leno-Colorado for running part of the bio-informatic pipelines with sequence data, and A. Caballero for discussions. The work was funded by project grants AGL2013-41834-R and AGL2016-78709-R awarded to M.P.-E. by the Ministerio de Economía y Competitividad, Spain; Institut National de la Recherche Agronomique metapro-gram SelGen (France) to A.L.; and National Institutes of Health grant R01-GM-101219 to G.d.l.C.
Literature Cited
Ai, H., X. Fang, B. Yang, Z. Huang, H. Chen et al.,
2015 Adaptation and possible ancient interspecies introgres-sion in pigs identified by whole-genome sequencing. Nat. Genet. 47: 217–225.
Bianco, E., H. W. Soto, L. Vargas, and M. Pérez-Enciso, 2015a The chimerical genome of Isla del Coco feral pigs (Costa Rica), an isolated population since 1793 but with remarkable levels of diversity. Mol. Ecol. 24: 2364–2378.
Bianco, E., B. Nevado, S. E. Ramos-Onsins, and M. Pérez-Enciso, 2015b A deep catalog of autosomal single nucleotide variation in the pig. PLoS One 10: e0118867.
Browning, B. L., and S. R. Browning, 2013 Improving the accu-racy and efficiency of identity-by-descent detection in popula-tion data. Genetics 194: 459–471.
Caballero, A., A. Tenesa, and P. D. Keightley, 2015 The nature of genetic variation for complex traits revealed by GWAS and re-gional heritability mapping analyses. Genetics 201: 1601–1613. Calus, M. P. L., A. C. Bouwman, C. Schrooten, and R. F. Veerkamp, 2016 Efficient genomic prediction based on whole-genome se-quence data using split-and-merge Bayesian variable selection. Genet. Sel. Evol. 48: 49.
Cheng, H., D. J. Garrick, and R. L. Fernando, 2015 XSim: simu-lation of descendants from ancestors with sequence data. G3 5: 1415–1417.
Choi, J.-W., W.-H. Chung, K.-T. Lee, E.-S. Cho, S.-W. Lee et al., 2015 Whole-genome resequencing analyses offive pig breeds, including Korean wild and native, and three European origin breeds. DNA Res. 22: 259–267.
Daetwyler, H. D., R. Pong-Wong, B. Villanueva, and J. A. Woolliams, 2010 The impact of genetic architecture on genome-wide eval-uation methods. Genetics 185: 1021–1031.
Daetwyler, H. D., A. Capitan, H. Pausch, P. Stothard, R. van Binsbergen
et al., 2014 Whole-genome sequencing of 234 bulls facilitates mapping of monogenic and complex traits in cattle. Nat. Genet. 46: 858–865.
De los Campos, G., D. Gianola, G. J. M. Rosa, K. Weigel, and J. Crossa, 2010 Semi-parametric genomic-enabled prediction of genetic values using reproducing kernel Hilbert spaces methods. Genet. Res. 92: 295–308.
de los Campos, G., D. Sorensen, and D. Gianola, 2015 Genomic heritability: what is it? PLoS Genet. 11: e1005048
de Roos, A. P. W., B. J. Hayes, and M. E. Goddard, 2009 Reliability of genomic predictions across multiple populations. Genetics 183: 1545–1553.
Erbe, M., B. J. Hayes, L. K. Matukumalli, S. Goswami, P. J. Bowman
et al., 2012 Improving accuracy of genomic predictions within and between dairy cattle breeds with imputed high-density sin-gle nucleotide polymorphism panels. J. Dairy Sci. 95: 4114– 4129.
Eyre-Walker, A., and P. D. Keightley, 2007 The distribution of
fitness effects of new mutations. Nat. Rev. Genet. 8: 610–618.
García-Ruiz, A., J. B. Cole, P. M. VanRaden, G. R. Wiggans, F. J. Ruiz-Lópezet al., 2016 Changes in genetic selection differentials and generation intervals in US Holstein dairy cattle as a result of genomic selection. Proc. Natl. Acad. Sci. USA 113: 3995–4004. Gianola, D., 2013 Priors in whole-genome regression: the
Bayes-ian alphabet returns. Genetics 194: 573–596.
Goddard, M., 2009 Genomic selection: prediction of accuracy and maximisation of long term response. Genetica 136: 245–257. Grisart, B., W. Coppieters, F. Farnir, L. Karim, C. Ford et al.,
2002 Positional candidate cloning of a QTL in dairy cattle:
identi-fication of a missense mutation in the bovine DGAT1 gene with major effect on milk yield and composition. Genome Res. 12: 222–231. Groenen, M. A. M., A. L. Archibald, H. Uenishi, C. K. Tuggle, Y.
Takeuchiet al., 2012 Analyses of pig genomes provide insight into porcine demography and evolution. Nature 491: 393–398. Hayes, B., and M. E. Goddard, 2001 The distribution of the effects of genes affecting quantitative traits in livestock. Genet. Sel. Evol. 33: 209.
Hayes, B. J., P. J. Bowman, A. C. Chamberlain, K. Verbyla, and M.
E. Goddard, 2009 Accuracy of genomic breeding values in
multi-breed dairy cattle populations. Genet. Sel. Evol. 41: 51. Hayes, B., I. MacLeod, H. Daetwyler, P. Bowman, A. Chamberlain
et al., 2014 Genomic prediction from whole genome sequence in livestock: the 1000 bull genomes project. inProceedings of the 10th World Congress of Genetics Applied to Livestock Production. Hayes, B. J., H. D. Daetwyler, A. Chamberlain, I. M. Macleod, K. E. Kemper et al., 2016 Improving genomic prediction with se-quence data and biological information.5th International Con-ference on Quantitative Genetics, Madison, WI, p. 24.
Heidaritabar, M., M. P. L. Calus, H.-J. Megens, A. Vereijken, M. A. M. Groenen et al., 2016 Accuracy of genomic prediction using imputed whole-genome sequence data in white layers. J. Anim. Breed. Genet. 133: 167–179.
Hill, W. G., 2012 Quantitative genetics in the genomics era. Curr. Genomics 13: 196–206.
Hoffmann, T. J., and J. S. Witte, 2015 Strategies for imputing and analyzing rare variants in association studies. Trends Genet. 31: 556–563.
Ionita-Laza, I., S. Lee, V. Makarov, J. D. Buxbaum, and X. Lin, 2013 Sequence kernel association tests for the combined effect of rare and common variants. Am. J. Hum. Genet. 92: 841–853. Karoui, S., M. J. Carabaño, C. Díaz, and A. Legarra, 2012 Joint genomic evaluation of French dairy cattle breeds using multiple-trait models. Genet. Sel. Evol. 44: 39.
Kessner, D., and J. Novembre, 2013 forqs: forward-in-time simu-lation of recombination, quantitative traits and selection. Bio-informatics 30: 576–577.
Li, H., and R. Durbin, 2009 Fast and accurate short read alignment with Burrows-Wheeler transform. Bioinformatics 25: 1754–1760. Li, H., B. Handsaker, A. Wysoker, T. Fennell, J. Ruan et al.,
2009 The sequence alignment/map format and SAMtools.
Bi-oinformatics 25: 2078–2079.
MacLeod, I. M., B. J. Hayes, and M. E. Goddard, 2014 The effects of demography and long term selection on the accuracy of ge-nomic prediction with sequence data. Genetics 198: 1671–1684. MacLeod, I. M., P. J. Bowman, C. J. Vander Jagt, M. Haile-Mariam, K. E. Kemperet al., 2016 Exploiting biological priors and se-quence variants enhances QTL discovery and genomic predic-tion of complex traits. BMC Genomics 17: 144.
McKenna, A., M. Hanna, E. Banks, A. Sivachenko, K. Cibulskiset al.,
2010 The genome analysis toolkit: a MapReduce framework
for analyzing next-generation DNA sequencing data. Genome Res. 20: 1297–1303.
McLaren, W., B. Pritchard, D. Rios, Y. Chen, P. Flicek et al.,
2010 Deriving the consequences of genomic variants with
Mercier, R., C. Mézard, E. Jenczewski, N. Macaisne, and M. Grelon, 2015 The molecular biology of meiosis in plants. Annu. Rev. Plant Biol. 66: 297–327.
Messer, P. W., 2013 SLiM: simulating evolution with selection and linkage. Genetics 194: 1037–1039.
Meuwissen, T. H., and M. E. Goddard, 2010 Accurate prediction of genetic values for complex traits by whole genome resequenc-ing. Genetics 185: 623–631.
Meuwissen, T. H., B. J. Hayes, and M. E. Goddard, 2001 Prediction of total genetic value using genome-wide dense marker maps. Genetics 157: 1819–1829.
Misztal, I., 2016 Inexpensive computation of the inverse of the genomic relationship matrix in populations with small effective population size. Genetics 202: 401–409.
Molnár, J., T. Nagy, V. Stéger, G. Tóth, F. Marincs et al., 2014 Genome sequencing and analysis of Mangalica, a fatty local pig of Hungary. BMC Genomics 15: 761.
Morris, A. P., B. F. Voight, T. M. Teslovich, T. Ferreira, A. V. Segrè
et al., 2012 Large-scale association analysis provides insights into the genetic architecture and pathophysiology of type 2 di-abetes. Nat. Genet. 44: 981–990.
Moser, G., S. H. Lee, B. J. Hayes, M. E. Goddard, N. R. Wrayet al., 2015 Simultaneous discovery, estimation and prediction anal-ysis of complex traits using a Bayesian mixture model. PLoS Genet. 11: e1004969.
Ojeda, A., L. S. Huang, J. Ren, A. Angiolillo, I. C. Cho et al., 2008 Selection in the making: a worldwide survey of haplo-typic diversity around a causative mutation in Porcine IGF2. Genetics 178: 1639–1652.
Peng, B., M. Kimmel, and C. I. Amos, 2012 Forward-Time Popu-lation Genetics SimuPopu-lations: Methods,Implementation,and Appli-cations, John Wiley, New York.
Pérez, P., and G. de los Campos, 2014 Genome-wide regression & prediction with the BGLR statistical package. Genetics 198: 483–495. Pérez-Enciso, M., 2014 Genomic relationships computed from ei-ther next-generation sequence or array SNP data. J. Anim. Breed. Genet. 131: 85–96.
Pérez-Enciso, M., L. Varona, and M. F. Rothschild, 2000 Computation of identity by descent probabilities conditional on DNA markers via a Monte Carlo Markov Chain method. Genet. Sel. Evol. 32: 467–482.
Pérez-Enciso, M., J. C. Rincón, and A. Legarra, 2015 Sequence-vs.
chip-assisted genomic selection: accurate biological information is advised. Genet. Sel. Evol. 47: 1–14.
Pickrell, J., T. Berisa, L. Segurel, J. Y. Tung, and D. Hinds, 2016 Detection and interpretation of shared genetic influences on 40 human traits. Nat. Genet. 48: 709–717.
Purcell, S., B. Neale, K. Todd-brown, L. Thomas, M. A. R. Ferreira
et al., 2007 PLINK : a tool set for whole-genome association and population-based linkage analyses. Am. J. Hum. Genet. 81: 559–575.
Quinlan, A. R., 2014 BEDTools: the swiss-army tool for genome feature analysis. Curr. Protoc. Bioinformatics 47: 11.12.1– 11.12.34.
Rupp, R., P. Senin, J. Sarry, C. Allain, C. Tascaet al., 2015 A point mutation in suppressor of cytokine signalling 2 (Socs2) in-creases the susceptibility to inflammation of the mammary gland while associated with higher body weight and size and higher milk production in a sheep model. PLoS Genet. 11: e1005629.
Tortereau, F., B. Servin, L. Frantz, H.-J. Megens, D. Milan et al., 2012 A high density recombination map of the pig reveals a correlation between sex-specific recombination and GC content. BMC Genomics 13: 586.
van Binsbergen, R., M. P. L. Calus, M. C. A. M. Bink, F. A. van Eeuwijk, C. Schrootenet al., 2015 Genomic prediction using imputed whole-genome sequence data in Holstein Friesian cat-tle. Genet. Sel. Evol. 47: 71.
van den Berg, I., D. Boichard, B. Gulbrandtsen, M. S. Lund, D. Boichardet al., 2016 Using sequence variants in linkage dis-equilibrium with causative mutations to improve across breed prediction in dairy cattle: a simulation study. G3 6: 2553– 2561.
VanRaden, P. M., 2008 Efficient methods to compute genomic
predictions. J. Dairy Sci. 91: 4414–4423.
Visscher, P. M., M. A. Brown, M. I. McCarthy, and J. Yang, 2012 Five years of GWAS discovery. Am. J. Hum. Genet. 90: 7–24.
Yang, J., A. Bakshi, Z. Zhu, G. Hemani, A. E. Vinkhuyzen et al., 2015 Genetic variance estimation with imputed variantsfinds negligible missing heritability for human height and body mass index. Nat. Genet. 47: 1114–1120.
Zhong, S., J. C. M. Dekkers, R. L. Fernando, and J.-L. Jannink, 2009 Factors affecting accuracy from genomic selection in populations derived from multiple inbred lines: a Barley case study. Genetics 182: 355–364.