Research Report No. 2 August, 1962
Measured crop performance
SMALL GRAIN
1962
GUY L. JON ES, Professor
E.L.JONES, Agricultural Research Supervisor G. C. OLIVER, Agricultural Research Assistant
Department of Crop Science N. C. State College
TABLE OF CONTENTS
INTRODUCTION
EXPERIMENTAL PROCEDURE
Agencies Sponsoring Entries • Test Locations • • •
Cultural Practices • • • Seasonal Conditions • • RESULTS AND DISCUSSION •
Barley Tests. Oat Tests • • . Wheat Tests • TABLES AND FIGURES
Location of "tests Cultural practices.
Characteristic of varieties • Barley. performance in the Piedmont. Barley performance in the Coastal Plain Oat performance in the Piedmont
Oat performance in the Coastal Plain. Wheat performance in the Piedmont Wheat performance in the Coastal Plain.
Page
3 3 4 4
4
6
7
8
9
PERFORMANCE OF SMALL GRAIN VARIETIES IN .NORTH CAROLINA Guy L. Jones, E. L. Jones, G. C. Oliver
1/
INTRODUCTION
Performance tests of small grain varieties are important in that they provide information for growers and agricultural workers to use in
evaluating varieties for planting. Evaluation trials are located through-out the small grain producing area of the state and are conducted to determine the value and suitability of commercially available and prospec-tive varieties of wheat, oats and barley for planting in North Carolina.
Seasonal conditions differ from year to year; therefore, a variety which looks superior for one year may not be consistently good, hence, varieties should be evaluated on the basis of performance over several years.
Information on varietal performance is presented from six test locations in the state, three in the Piedmont area and three in the Coastal Plain area. In comparing the performance of varieties, data from the area which most nearly represents the growers' conditions should be used. All available data
~/
were used in determining the pathologic and agronomic characteristics of the varieties.EXPERIMENTAL PROCEDURE
Commercial varieties and experimental lines developed by public and private agencies are included in these tests. Any individual or firm
!/
Professor in Charge of Variety Testing, Agricultural ResearchSupervisor and Agricultural Research Assistant, Department of Crop Science, North Carolina State College, respectively.
Special acknowledgment is due Drs. T. T. Hebert and C. F. Murphy for assistance in describing the characteristic of varieties.
D. H. HILL
L~BRAR'(
may make application for having entries included by writing the Depart-ment of Crop Science, North Carolina State College." A fee is charged on an entry basis for all private entries. Personnel of the testing program may include entries about which further information is desired.
Agencies Sponsoring Entries Arkansas Agricultural Experimental Station Coker Pe4~greed Seed .~~~pany
Georgia Agricultural Experimental Station Indiana Agricultural Experimental Station North Carolina Agricultural Experiment Sta. South Carolina Agricultural Experiment Sta. T. W. Woods and Sons
Virginia Agricultural Experimental Station Test Locations
Fayetteville, Ark. Hartsville, S. C. Experiment, Ga. Lafayette, Ind. Raleigh, N. C. Clemson, S. C; Richmond, Va. Blacksburg, Va.
Seven locations were used in 1962 with four in the Piedmont and three in the Coastal Plain as shown in Figure 1. The Iredell County test was discarded due to freeze damage resulting in an extremely poor stand. All tests, except the test in Columbus County on the Border Belt Tobacco
II
Research Station, were located on private farms. - A randomized block design with four replications was used at each location.
11
Varieties were planted in three-row plots 16 feet long and the center row was harvested for yield.Cultural Practices
Cultural practices, such as seed bed preparation, date of planting, fertilization and topdressing were in accord with good farming practices and were uniform for all entries at a given location, Table 1. The plots
The cooperative spirit and civic-minded service rendered by the farmers who provided land and the necessary cultural practices for these trials and the cooperation of the county agents are gratefully acknowledged. ~I Statistical analysis were made in the statistical Laboratory under the
FIGURE 1
LOCATI,ON OF SMALL GRAI N PERFORMANCE TRIALS
1962
• Signifies Official Variety Test Locations
CO-OPERATORS PIEDMONT
Davidson County: J. H. Beck, Route 1, Lexington, N. C. County Agricultural Agent, C. E. Barnhardt.
Iredell County: Allan Morrow, Route 2, Cleveland, N. C. County Agricultural Agent, Wayne Franklin.
Cleveland County: Worth Spangle, Route 2, Lawndale, N. C. County Agricultural Agent, H. R. Clapp.
Union County: Brite Baucom, Monroe, N. C. County Agricultural Agent, Jim Marsh. COASTAL PLAIN
Columbus County: Whiteville Experiment Station, Whiteville, N. C. County Agricultural Agent, C. D. Raper.
Wayne County: Wilbert Hall, Route 2, Fremont, N. C. County Agricultural Agent, G. M. Goforth.
were hand-harvested, threshed, cleaned and weighed. Di-syston was applied on seed after planting and before covering to aid in control of yellow dwarf.
Seasonal Conditions
The variety test plantings were made under extremely dry conditions and seed germination was slow, taking up to three weeks. However, final stands were fair to good at all locations. The Piedmont tests were planted a little late due to the dry period. A dry spring and early summer throughout the area affected yields.
The Davidson County test was about three weeks coming up due to the extremely dry weather. There was about 10% freeze injury in early February; however, the plants made good growth resulting in moderate yields.
The Cleveland County test also required about three weeks to emerge due to dry weather. Extremely dry weather during the late spring and early summer caused a severe reduction in yields. The average yield of the Cleveland County test was 20 bushels per acre compared with 44 for the Union County test of wheat.
The Iredell County test was around three weeks coming up as a result of the dry weather. About 80% of the oats and 65% of the barley froze during early February and the wheat was severely injured due to the heaving of the soil. Late dry weather further cut the yields so this entire test was discarded.
The Union County test was normal in emerging and made normal growth. Yields were somewhat reduced due to the general dry season through the Piedmont.
7
The Wayne,and Nash County tests varied in coming up from October 27 to December 1 due to the dry period. Yield was affected as a result of the dry early summer on these tests.
The general seasonal conditions were not conducive to good yields; however, the tests in "general were representative of the respective areas of production.
RESULTS AND DISCUSSION
The data are presented in tabular form by crop and area showing the performances for 1962 and the previous two and three years. Since environment is very important in determining the genetic potential of a variety it is best to have several years data from which to draw conclusions. Comparisons should be made within a column in a table and not between columns. For example, if a variety appears in the two year average but not in the three year average, then it must be compared only within the two years and not with the data in the three year average, since it is possible that the third year could have been extremely good or poor and not comparable.
The yield data presented in this report have been analyzed statis-tically and the least significant difference (L.S.D.), in terms of bushels per acre, is given at the bottom of each 1962 yield column. Unless the yield difference between two varieties is greater than the L.S.D., the varieties should not be considered as having yielded differently from each other.
Barley Tests
no statistical differences either by individual locations or when combined over locations. Colonial 2, Wade and Davie had the highest three year average yields of the varieties tested. Wade and Rogers had the highest test weight (lbs/bu).
In the Coastal Plain area (Table 6) there were yield differences in 1962, with the varieties Colonial 2, Wade, Rogers and Ga-Jet averaging over 34 bushels per acre. Wade, Rogers and Hudson had test weights in excess of 44 pounds per bushel. When comparing the varieties over three years there was very little difference in yield except that James was lowest. Wade and Rogers had the highest test weights. There were location differences and a variety x location interaction. Varieties failed to respond the same, relative to each other, at the different locations. For example, Rogers, one of the lower yielders at Nash County was the highest yielder at Wayne County. James appeared to be not well adapted to the Coastal Plain area.
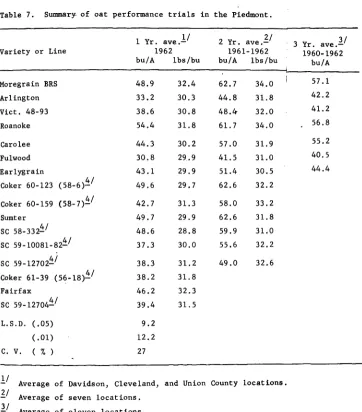
Oat Tests
A summary of the oat performance trials in the Piedmont is shown in Table 7. In 1962 Roanoke yielded 54.4 bushels per acre and Moregrain, Caro1ee, Ear1ygrain, Sumter and Fairfax yielded over 40 bushels per acre. However when compared over two years Moregrain, Roanoke and Carolee yielded the highest and were equal.
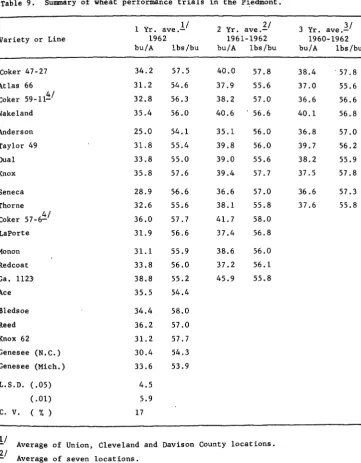
9 Wheat Tests
Data on the wheat tests in the Piedmont are presented in Table 9. Of the commercially available varieties all yielded in excess of 30 bushels per acre in 1962 except Anderson and Seneca. All had good test weights in 1962. When compared 9ver the three year period, (1960-1962) all the varie-ties tested yielded in the same general range and had comparable test weights.
Performance of wheat varieties in the Coastal Plain is shown in Table 10. In 1962 most of the commercially available varieties performed well and quite s~milarwith Anderson, LaPorte and Redcoat being on the
Table 1. Cultural practices for small grain tests 1962 ..!.1
Area and Fertilizer Topdress
'!:./
Date of Date ofcooperator lbs/A lbs/A planting harvesting
Piedmont Area
Davidson Co. 500 60 N
October 23 June 20
J. H. Britt 5-10-10
Iredell Co. 800 60 N October 23
June 19
Allan Morrow 5-10-10
Cleveland Co. 800 45 N
October 24 June 19 Worth Spangle 5-10-10
Union Co. 600 30 N
October 20 June 20
Brite Baucom 10-10-10
Coastal Plain Area
Border Belt Res. Sta. 350
60 N October 25 Jilne 11 Wallace Dickens 5-10-10
Wayne Co. 400, 0-14-14
30 N October 26 June 18 Wilbert Hall 400, 2-12-12
Nash Co. 600 60 N
October 27 June 18
w.
M. Winstead 5-10-10Di-syston was applied to the seed after planting and prior to covering to
aid in control of yellow dwarf.
Table 2.
Loose
Mildew Rust Scald Lodging Winter Amount
smut Test
Variety resist- resist- resist- resist- resist- hardiness Maturity of Weight
ance ance ance ance straw lb/bu.
ance
Colonial 2 Poor Poor Poor Poor Fair Fair Med. Light Med.
Davie Poor Fair Excellent Fair Fair Fair Early Light Med.
Wade Poor Fair Excellent Fair Good Fair Early Light High
Early Marconee Po~r Fair Poor Poor Fair Fair Early Light Med.
Ga-Jet Good Fair Fair Fair Poor Fair Very
early Light Med.
James Poor Good Good ---- Good Good Early Light Med.
Rogers Poor Excellent Fair Fair Good Good Late Light High
Hudson Poor Good Poor Excellent Good Good Late Light High
Table 3. Characteristics of oat varieties.*
Rust Smut Blight Mosaic
Winter Lodging Amount Test
.-Variety resist- res ist- resist- resist- Maturity resist- of weight
.-hardiness
ance ance ance ance ance straw lb/bu.
Arlington Fair Good Poor Good Med. late Good Fair Heavy Med.
Victorgrain 48-93 Fair Good Poor Fair Med. Fair Good Med. Med.
Fulwood Fair Good Poor Fair Med. early .G~~~_ _ J Good Light Med.
Forkedeer Poor Poor Good Fair Late . Bxce l.lent Fair Med. Med.
Suregrain Good Excellent Good Poor Early Poor Good Light High
Moregrain Good Good Good Fair Early Fair Good Light High
Carolee Fair Good Good Fair Med. Good r-\ Good Light Med.
Roanoke Fair Poor Good Fair Med. late Good Fair Heavy Med.
Earlygrain Poor Good Good Fair Early Fair Good Light Med.
Sumter Fair
----
Good Good Med. early Good Good Light Med.Fairfax Fair _ Pco r Good Fair Med. -late Good Fa~r He,ayy Med.
Leaf
Mildew Mosaic Lodging Height Test
rust
resist- resist- Maturity Winter resist- of Weight
resist- Hardiness
ance ance ance straw lb/bu.
ance
Atlas 66 Fair Fair Poor Medium Fair Good Med. Low
Coker 47-27 Fair Poor Poor Medium Fair Good Tall High
Anderson Fair Fair Fair Medium Good Good Tall Med.
Thorne Poor Poor Good Late Excellent Fair Tall Med.
Seneca Poor Poor Good Late Excellent Fair Tall Med.
Knox Good Fair Good Early Good Good Short High
Taylor 49 Fair Poor Good Medium Good Fair Med. Med.
Wakeland Fair Good Poor Early Fair Good Short High
A~~ ~90g Fair Good Medium. Excellent Excellent Med. Low
LaPorte Fair Excellent Good Medium Excellent ---- Med. Med. t-'
Monon Excellent Poor Good Early Excellent Good Short Med. N
Redcoat Excellent Excellent Good M~dium Excellent Excellent Med. t1~d..
Ga. 1123 Good Fair Good Medium Fair Excellent Med. Med.
Bledsoe Fair Fair Good Medium Excellent Good Tall High
Reed Excellent Poor Good Medium Excellent Good Med. High
Dual Excellent Poor Good Medium Good Good Med. Med.
Knox 62 Good Fair Good Early Good Good Short High
Genesee Poor Poor Good Medium Good Fair Med. Low
13
Table 5. Summary of barley performance trials in the Piedmont.
Variety or Line
II
1 yr. ave.-1962
bu/A 1bs/bu
2/
2 yr. ave.-1961-1962
bu/A 1bs/bu
31 3 yr. ave.
-1960-1962
bu/A 1bs/bu Davie
Coloni Wade
Calhoun x Bolivia
95~1
35.9 37.2 36.6 37.3 37.4 42.4 38.8 39.6 42.0 39.5 48.1 39.6 49.5 43.4 48.4 41.4 47.0 40.6 53.5 40.2 47.5 44.3 51.4 42.4 James
.
41
Taylor 502-425~ Rogers Early Marconee 34.8 40.2 37.9 42.6 39.3 36.2 44.5 38.6 43.7 50.6 50.7 42.5 41.6 39.6 45.4 39.9 42.6 49.8 42.2 41.2 40.6 45.2 39.0 40.1 36.8 41.2 44.5 36.8 41.8 36.7 33.2 39.9 36.9 Ga-Jet41
Davie x Hudson SC59-101~Davie x (Y 868-Y 506)
41
SC 581097-Y71 x Y
635-217~1
39.6Davie x (Y 868 - Y 506) 3982 !!!31. 2
Hudson 38.8
L.S.D. (.05) ( .01)
C. V. (%)
N.S. N.S.
28
1/
Average of Union, Cleveland and Davidson County locations.21 .
- Average of seven locat~ons.
Table 6. Summary of barley pe r fo rmance trials in the Coastal Plain.
3 Yr. ave
.1.1
1960-1962 bu/A 1bs/bu Variety or LineDavie Colonial 2 Wade
Calhoun x Bolivia
954~/
James4/
Taylor's 502-425~ Rogers Early Marconee Ga-Jet jDavie x Hudson SC
59-l0l~
Davie x (Y 868-Y 506) 4/SC 58·1097 -Y 71 x -Y
635-2173~
Davie x (Y 868-Y 506)
3982~/
HudsonL.S.D. (.05) ( .01)
C. V. (%)
!/
Average of Wayne, Nash and~/
Average of six locations.1/
Average of nine locations.4/ E . 1 1·
- xper1menta 1nes.
1 Yr. ave.
1
.!
2 Yr. ave.!:./1962 1961-1962
bu/A lbs/bu bu/A lbs/bu
28.7 38.7 43.8 39.6
34.9 38.8 49.4 39.0
34.6 44.4 49.2 43.4
33.8 40.5 44.8 40.9
18.8 39.8 33.2 40.6
31.2 39.1 47.5 40.3
37.8 45.8 46.6 43.9
26.9 40.6 38.6 40.4
34.6 36.8 42.7 37.3
33.9 43.8 27.4 36.3 34.2 39.1 29.9 41.5 28.4 45.8 6.3 8.4 25
Columbus county locations.
Experimental lines.
Average of seven locations. Average of eleven locations.
15
Table 7. Summary.·0f oa t performance trials in the Piedmont.
1 Yr. ave.!/ 2 Yr. ave.'l:.l 3 Yr. ave.'l/
Variety or Line 1962 1961-1962 1960-1962
bu/A 1bs/bu bu/A 1bs/bu bu/A
Moregrain BRS 48.9 32.4 62.7 34.0 57.1
Arlington 33.2 30.3 44.8 31.8 42.2
Viet. 48-93 38.6 30.8 48.4- 32.0 41.2
Roanoke 54.4 31.8 61.7 34.0 56.8
Caro1ee 44.3 30.2 57.0 31.9 55.2
Fulwood 30.8 29.. 9 41.5 31.0 40.5
Ear1ygrain 43.1 29.9 51.4 30.5 44.4
Coker 60-123 (58-6)!t/ 49.6 29.7 62.6 32.2 Coker 60-159 (58-7)!t/ 42.7 31.3 58.0 33.2
Sumter 49.7 29.9 62.6 31.8
SC
58-332~/
48.6 28.8 59.9 31.0SC 59-10081-82!t/ 37.3 30.0 55.6 32.2
SC 59-12702!t/ 38.3 31.2 49.0 32.6
Coker 61-39
(5~-18)~/
38.2 31.8Fairfax 46.2 32.3
SC 59-12704!t/ 39.4 31.5
L.S.D. (.05) 9.2
(.01) 12.2
C. V. ( % ) 27
!/
Average of Davidson, Cleveland, and Union County locations.l/
1/
Experimental lines. Average of six locations. Average of nine locations.
Table 8. Summary of oat performance trials in the Coastal Plain.
1 Yr. ave.
1
.!
2 Yr. ave.'!:..1 3 Yr. ave.'llVariety or Line 1962 1961-1962 1960-1962
bu/A 1bs/bu bu/A 1bs/bu hulA
Moregrain BRS 54.8 36.0 69.5 30.5 67.6
Arlington 44.7 33.3 52.2 32.1 57.4
Vict. 48-93 43.2 33.5 51.1 32.1 52.1
Roanoke 61.8 34.0 70.0 33.8 68.4
Caro1ee 69.4 33.5 75.8 32.9 76.8
Fulwood 25.4 31.6 42.8 31.8 50.4
Ear1ygrain 50.1 32.0 59.2 31.4 64.3
Suregrain 60.9 35.2 75.6 38.7 74.0
Coker
60-123(58-6)~1
62.4 33.9 73.6 34.2Sumter 80.6 33.4 88.4 33.8
Coker 60-159
(58-7)~1
58.6 36.5 Coker61-39(56-18)~1
60.0 35.5Fairfax 65.6 33.8
SC
58-332~:I
67.3 33.2se
S9-10081-82~1
52.4 34.1·SC
S9-12702~1
52.4 32.1SC
S9-12704~.I
43.0 33.9L.S.D. (.05) 12.6
(.01) 16.7
C. V. ( % ) 28
11
Average of Nash, Wayne and Columbus County locations.1:.1
Experimental lines.
Average of seven locations.
~verage of eleven locations.
17
Table 9. Summary of wheat performance trials in the Piedmont.
1 Yr. ave.
1
.!
2 Yr. ave.'!:./ 3 Yr. ave.'l/Variety or Line 1962 1961-1962 1960-1962
bu/A 1bs/bu bu/A 1bs/bu bu/A lbs/bu
Coker 47-27 34.2 57.5 40.0 57.8 38.4 . 57.8
Atlas 66 31.2 54.6 37.9 55.6 37.0 55.6
4/
32.8 56.3 38.2 57.0 36.6 56.6
Coker
59-11-Wakeland 35.4 56.0 40.6 . 56.6 40.1 56.8
Anderson 25.0 54.1 35.1 56.0 36.8 57.0
Taylor 49 31.8 55.4 39.8 56.0 39.7 56.2
Dual 33.8 55.0 39.0 55.6 38.2 55.9
Knox 35.8 57.6 39.4 57.7 37.5 57.8
Seneca 28.9 56.6 36.6 57.0 36.6 57.3
Thorne 32.6 55.6 38.1 55.8 37.6 55.8
4/
36.0 57.7 41.7 58.0
Coker
57-6-LaPorte 31.9 56.6 37.4 56.8
Monon 31.1 55.9 38.6 56.0
Redcoat 33.8 56.0 37.2 56.1
Ga. 1123\ 38.8 55.2 45.9 55.8
Ace 35.5 54.4
Bledsoe 34.4 58.0
Reed 36.2 57.0
Knox 62 31.2 57.7
Genesee (N.C.) 30.4 54.3
Genesee (Mich. ) 33.6 53.9
L.S.D. (.05) 4.5
(.01) 5.9
C. V. ( % ) 17
!/
Average of Union, Cleveland and Davison County locations. ~/1/
Table 10. Summary of wheat performance trials in the Coastal Plain.
Variety or Line
1 Yr. ave.
l /
1962 bu/A 1bs/bu2 Yr. ave.'!:./ 1961-1962 bu/A 1bs/bu
3 Yr. ave.'ll
.1960~1962 butA Ibs /bu Coker 47-27 Atlas 66 Coker
59-11~/
Wakeland Anderson Taylor 49 Coker57-r/!-'
LaPorte Monon Redcoat Ga. 1123 Ace Bledsoe L.S.D. (.05) (.01)C. V. (%)
37.6 37.5 36.8 38.8 34.8 40.9 40.8 35.0 35.6 27.5 42.3 41.6 38.4 6.7 8.9 22 57.4 55.2 57.3 56.8 56.1 55.0 57.0 56.3 56.6 54 .. 5 56.7 54.5 56.9 35.5 36.5 35.1 37.0 35.0 34.4 41.8 35.2 30.6 32.9 39.4 56.8 55.4 57.4 57.2 54.9 54.4 56.4 55.4 56.0 54.6 56.4 37.8 37.4 38.0 38.8 34.5 34.0 57.9
56.6
,
58.2 58.2 56'.5 55.7!/
Average of Wayne, Nash and Columbus County locations. '!:./
Average of six locations.