Article
Evaluation of the Effects of Biodiesel on Emission
and Performance by Comparing the Results of the
NEDC and WLTC
Tolgahan Kaya 1,*, Osman Akın Kutlar 1 and Ozgur Oguz Taskiran 2
1 Istanbul Technical University, Faculty of Mechanical Engineering, İstanbul 34467, Turkey; [email protected] [email protected]
2 Design Project Office, Turkish Navy, İstanbul 34944, Turkey; [email protected] * Correspondence: [email protected]; Tel.: +90-262-677-2774
Abstract: In this paper, the effects of biodiesel on performance and emission of the current and new-coming regulation cycles, namely the New European Driving Cycle (NEDC) and the Worldwide Harmonized Light Vehicles Test Cycle (WLTC), were investigated by conducting tests on a passenger car, Euro-5 Ford Fiesta, equipped with a 1.5-liter diesel engine. In a two-axle chassis dynamometer test bed, NEDC and WLTC were performed with pure diesel and biodiesel-to-diesel blend (30% biodiesel, 70% diesel in volume). A substantial reduction in CO, HC, and PN emissions was observed for both the NEDC and WLTC when biodiesel was used. Besides, it was found that the WLTC has higher load and velocity profile compared to the NEDC. Moreover, lower CO, HC, and PN emissions were observed with B30 fuel under WLTC compared to the NEDC. Nevertheless, slightly higher CO2 and substantially higher NOx emissions were observed for the WLTC compared to the NEDC.
Keywords: NEDC; WLTC; Biodiesel; Exhaust emissions
1. Introduction
Alternative fuels are convenient substitutes to conventional fuels in the automotive industry which reduces emission based air pollution and dependency on use of conventional fuels. Owing to the stringent emission regulations introduced by the European Union (EU), the use of biodiesels, an alternative fuel, has become quite popular over the last decade [1,2]. Similarly, the directive of 2009/28/EC further encouraged the use of biodiesels by allowing the addition of alternative fuels to conventional diesels up to 10% in volume. Biodiesels have considerable benefits compared to their conventional counterparts as they are renewable energy sources, biodegradable, and non-toxic [3]. Moreover, their higher cetane number results in a reduction in the ignition delay duration (IDD) compared to conventional diesels [4]. In addition, facts of the higher O2 in their chemical chain and the absence of both aromatics and sulfur in the chemical composition reduce the particle emission and lead to a more complete combustion and a cleaner burn [5]. Despite the mentioned benefits of biodiesels, they have higher viscosity (than conventional diesels), which causes less atomization and lower energy content because of high oxygen by weight [6].
Due to the benefits of biodiesels, they have been extensively studied to assess their improvements on compression ignition engines and significant results regarding their effect on emission and performance were obtained [7]. Earlier studies [8,9] revealed that addition of biodiesel to diesel leads to an increase in the brake specific fuel consumption and a decrease in the thermal efficiency of the combustion due to their lower gross calorific value (GCV) than diesels (i.e., biodiesels reduce the engine power and increase the fuel consumption). On the one hand, it has been shown that biodiesels have higher oxygen content and less aromatic compounds compared to diesels, which reduces Hydrocarbon (HC), Carbon monoxide (CO), and Particulate mass (PM) emissions [10,11].
Furthermore, it has been presented that Nitrogen Oxides (NOx) and Carbon Dioxide (CO2) emissions of compression ignition engines increase due to the higher oxygen content of biodiesels [4,12].
A wide range and large number of experiments were conducted in the literature [1,6,13,14], using various biodiesel-to-diesel blend ratios in accordance with the transient regulation test cycle mandated by the EU, namely, the New European Driving Cycle (NEDC), in order to investigate the effects of biodiesels on the exhaust emissions of passenger cars. Lopes et al. [15] and L. Serrano et al. [6] concluded that blend ratio does not directly affect the emissions and the fuel consumption. Moreover, according to investigations made by O. Armas et al. [14], the comparison of emissions using biodiesel and diesel gave different result under the first and second phases of NEDC which are defined as Elementary Urban Driving Cycle (UDC) and Extra Urban Driving Cycle (EUDC), respectively. NOx emission of biodiesel added blends is lower in the UDC compared to diesels. In contrast, NOx emission of biodiesel added blends is higher in the EUDC compared to diesels. Similarly, the fuel consumption increase of biodiesel added blends in the UDC is less than the increase in the EUDC. O. Armas et al. state that the lower load conditions of the EUDC than the UDC cause the different emission attitudes [14].
Although the NEDC has been used for twenty years for the Type Approval (TA) procedure, the United Nations Economic Commission for Europe (UNECE) started the development of a new TA procedure in 2009, namely Worldwide Harmonized Light Vehicles Test Procedure (WLTP), to have a more realistic driving cycle [16]. Phase-1 version of the WLTP with the name of Global Technical Regulation was released in 2015 [17]. Although researchers have investigated exhaust emission and fuel consumption difference of the NEDC and the Worldwide Harmonized Light Vehicles Test Cycle (WLTC) [18,19], very limited experimental data exists in the literature on the effects of biodiesel over the WLTC.
In this study, a two-phase experimental analyses were carried out to investigate the effects of biodiesel produced from canola oil (BD-CO) on emission and performance of diesel engines. A vast majority of studies in the literature investigated the effects of biodiesels on the performance and emission, adopting transient regulation cycles. The emission and performance differences of biodiesel usage under the NEDC and WLTC have not been investigated yet. Thus, in this study, biodiesel-blended fuel is tested under both the NEDC and WLTC. In the first part, a EURO-5 complied diesel passenger vehicle was tested under the NEDC and in the second part the WLTC experiments were performed to investigate the effects of biodiesel on the emission and performance of the vehicle.
2. Materials and Methods
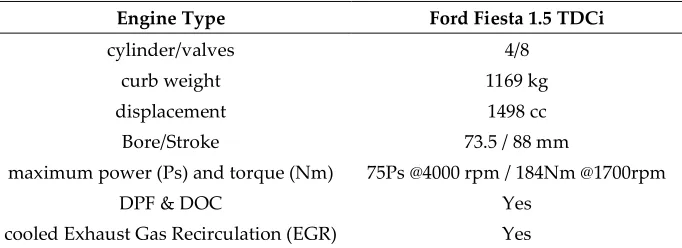
2.1. Test Vehicle
Table 1. Technical specification of the test vehicle
Engine Type Ford Fiesta 1.5 TDCi
cylinder/valves 4/8
curb weight 1169 kg
displacement 1498 cc
Bore/Stroke 73.5 / 88 mm
maximum power (Ps) and torque (Nm) 75Ps @4000 rpm / 184Nm @1700rpm
DPF & DOC Yes
cooled Exhaust Gas Recirculation (EGR) Yes
2.2. Test Fuel
Turkish Government permits the use of diesels and biodiesels complying with EN590 and EN14214 standards, respectively. Diesel fuel that was necessary for experiments was bought from one of the gas stations of Shell Oil Company, whereas pure biodiesel, which was produced from canola oil, was supplied from DB Tarımsal Energy Company in Izmir. One blend of diesel and biodiesel with thirty percent volumetric proportion of biodiesel and seventy percent volumetric proportion of diesel were prepared. Prepared biodiesel diesel blend named as B30, whereas B00 were used for pure diesel in this study. The physical properties of the pure diesel and biodiesel-diesel blend were analyzed at the fuel analyses laboratory of TUBITAK Marmara Research Center (MRC) Energy Institute. The analysis results of pure biodiesel were acquired from the DB Tarimsal Energy Company. The physical properties of all test fuel are provided in Table 2. Although the biodiesel has similarproperties with the diesel, Table 2 summarizes the differences. The density, viscosity, and flash point temperature of pure biodiesel (B100) are higher than pure diesel (B00); on the other hand, the lubricity and GCV of B00 are higher than B100.
Impact of biodiesel on emission and performance increase when higher amount of biodiesel is blended to diesel. Nevertheless the effects of biodiesel blend is not proportional to blend ratio [20,21]. Moreover, higher blends of biodiesel to diesel more than 30% may exceed the legal limit of EN590 and are not common [22], therefore B30 was selected for experiments to compare the differences of WLTC and NEDC.
Table 2. Physico-chemical properties of test fuels
Property unit EN590 Limit B00 B30 B100
Density (15 °C) kg/m3 820-845 831.8 844.4 883.7 Viscosity (40 °C) mm2/s 2.00-4.50 2.88 3.21 4.32 Gross Calorific Value (GCV) cal/g - 11074 10613 9537 Fatty Acid Methyl Ester % (v/v) <7 <0.05 30.15 NA
Carbon Content % (m/m) 0.30 <0.1 <0.1 NA
Sulphur mg/kg <10 7.2 5.8 1.54
Flash Point oC >55 58.5 66.5 184
Cetane Number - >51 55.0 55.1 51.2
Lubricity μm <460 406 187 -
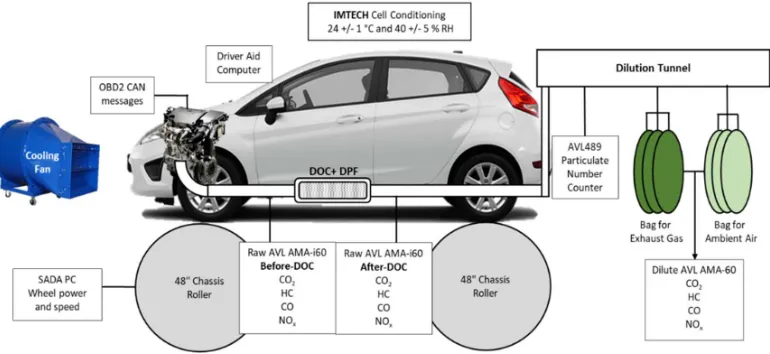
2.3. Experimental Setup
chassis dynamometer has dilution tunnel, constant volume sampler, AVL AMA-i60 dilute and raw exhaust gas analyzers, AVL particulate number counter device, IMTECH test cell temperature and humidity controller, SADA wheel power and speed measurement computer, and driver aid computer. A schematic of the chassis dynamometer with measurement devices can be seen in Figure 1.
Figure 1. Chassis dynamometer and emission measurement configuration
Driver aid computer is necessary for driver to follow up the transient cycle. It shows current and target vehicle velocity in time scale. Power, force and velocity of the vehicle were measured via chassis dynamometer computer. In addition, coast down parameters, which were selected from “simulated inertia and dyno loading requirements” table in UNECE R83, were also applied from chassis dynamometer computer. Temperature and humidity of the chassis dynamometer were controlled with Imtech climatic system. All tests were performed at 24 +/- 1 °C and 40 +/- 5 percent Relative Humidity. As well as dilute emission measurement of the NEDC according to UNECE R101 regulation, to be able to realize emission behavior during the NEDC, raw emissions of CO, HC, NOx, and CO2 before and after DOC were measured by AVL AMA-i60 raw gas analyzers.
AVL diesel particulate number measurement device was used to record Particulate Number (PN) emission over the NEDC and WLTC as PN emission limit has been applied after September 2014 with Euro-5b emission regulation.
In addition to emission data, On Board Diagnostics (OBD) port of the vehicle was used to acquire available engine sensor data. OBD data was used to evaluate vehicle condition during experiments. Original Equipment Manufacturers (OEM) release CAN messages with same ID via OBD port to meet European OBD requirements for 2000 and later model year vehicles. Data of the engine sensors that were acquired from OBD port are as follows; Acceleration Pedal Position (APP), engine speed, manifold air pressure, air flow sucked by engine, Exhaust Gas Recirculation (EGR) valve position, exhaust gas temperature before and after diesel particulate filter, battery voltage, injection fuel pressure, total fuel injected to cylinder and engine coolant temperature.
2.4 Test Procedure
The NEDC and WLTC testing were conducted with diesel and biodiesel-diesel blend to investigate emissions of each cycles, to explore the biodiesel impact to new coming TA procedure and to compare biodiesel effects on each cycles.
on the chassis dynamometer without cranking the engine as described in UNECE R83. All NEDC experiments were conducted with the same driver and under the same conditions to minimize the external effects on results. Three cold NEDC tests were performed first with B00 and then B30.
After completing the NEDC tests, WLTC tests were performed with B00 and B30 in order to examine the effects of biodiesel on regulated emission of new TA procedure. Similar to the NEDC procedure, first B00 and then B30 were added to the drained fuel tank. Three cold WLTC experiments were also done for each fuel after 8 hours of soaking.
2.5 Calculation Method
Evaluating the acquired experimental data is very critical to have proper comparison of different cases. Results of the NEDC experiments were automatically calculated via AVL IGEM software according to R83 regulation from dilute emission measurement results. In addition to dilute emission measurement, IGEM software was used to calculate results from raw emission data to evaluate the accuracy of dilute emission measurement.
The WLTC experiment’s emission data were evaluated by Equation 1 to calculate mass emissions according to R49; where u is different constant for each exhaust gas that calculated from molecular mass, c is the instantaneous concentration of the component in the exhaust gas (ppm), q is the instantaneous exhaust mass flow (kg/s), f is the data sampling rate (Hz) and n is the number of measurements. Additionally, statistical analysis of the results of the NEDC and WLTC were performed by using both bag and raw emission measurements.
𝑚 = 𝑢 × 𝑐 ,
İ
× 𝑞 , ×1
𝑓
(1)
3. Discussion
The conditions of both test vehicle and laboratory have impacts on the results. Brace et al. and Loiselle-Lapointe et al. studied the effect of testing factors and found out that the battery state of charge, engine oil level, pedal busyness, speed error, road fan speed, vehicle alignment, tire type, tire pressure, and simulated vehicle mass have significant impacts on the results [23,24]. As the same test vehicle was used for all experiments, tire type and vehicle mass were same for all cases. Influence of engine oil level, tire pressure, and battery state of charge on results were eliminated by controlling and recording values before each experiment by the test operator. Vehicle alignment, speed error and road fan speed were controlled with chassis dynamometer control system’s sensors. In order to minimize the effect of pedal busyness same driver performed all experiments.
In addition to these parameters, engine sensors were monitored via OBD during each experiment to be sure that to have the same condition. The engine speed, APP, battery voltage and engine coolant temperature of the vehicle were monitored and controlled during the experiments to minimize the effects of these parameters on emissions. Although there are minor differences, experienced driver could drive the cycles without any violation as desired in TA procedure.
Results of the NEDC and WLTC experiments with B00 and B30 were grouped to be able to compare the effects of biodiesel on CO2, NOx, HC, CO and PN over both cycle. Moreover, a brief comparison of load distribution of the NEDC and WLTC were performed.
3.1 Comparison of load profile and cycle dynamism of the WLTC and the NEDC
Figure 2. Velocity and distance of the NEDC and WLTC
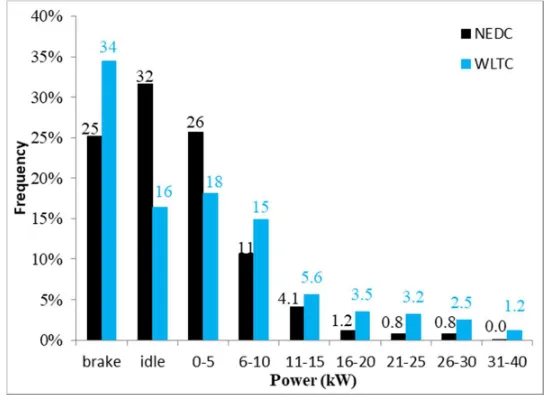
In order to understand the power distribution of the NEDC and WLTC, gathered wheel load data is grouped as shown in Figure 3. Brake label is used for deceleration operation and total braking time is divided to the total cycle time to show frequency of braking duration in the overall cycle. The remaining zero (idle) and positive wheel power operation points are also grouped as braking operation and also shown in Figure 2. Frequency of idling and power between 0 and 5 kW operation under the NEDC are 32% and 26%, which is more than half of the cycle, whereas under the WLTC are 16% and 18% respectively, which enables the WLTC to have a better distribution of the load over the cycle.
Figure 3. Power frequency and distribution of the NEDC and WLTC
In order to understand comparative effects of the biodiesel derived from canola oil on emission and performance of the WLTC and the NEDC, results of each cycle are compared for power and emission point of view.
0 200 400 600 800 1000 1200 1400 1600 1800
Time [sec]
V
el
oc
ity
[k
m
/h
]
0 20 40 60 80 100 120 140
D
is
ta
nc
e
[k
m
]
0 6 12 18 24
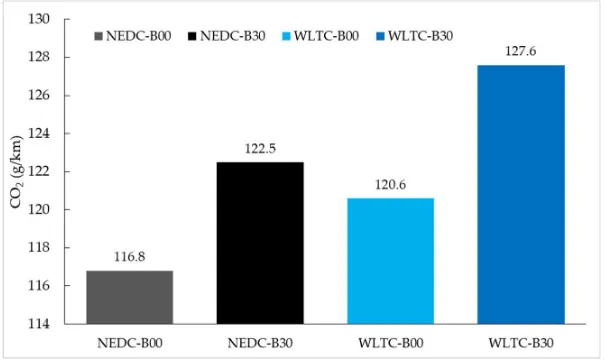
3.2 CO2 Emission and Fuel Consumption
Considerable research has been conducted regarding biodiesel’s impact on CO2 emission due to its favorable influence on the environment. However, CO2 emission is affected from combustion efficiency related engine parameters as well as biodiesel [7]. A wide range of experimental results exist in the literature show that addition of biodiesel to diesel both increase and decrease the CO2 emission [7,9,10]. According to some researchers it is proposed that increase of the CO2 is related to 11% oxygen content of biodiesel in the molecular formula [7,25] and more complete combustion [9]. Whereas many other researchers claim that the lower carbon to hydrogen ratio of biodiesel causes less CO2 emission than pure diesel [10].
Biodiesel added fuel emits more CO2 emission than diesel fuel both under the NEDC and the WTLC as shown in Figure 4. Since identical engine parameters were used during biodiesel and diesel tests, it is found that combustion of biodiesel yielded more efficient results than diesel around higher load conditions within the cycles’ speed range.
Results of the experiments showed that biodiesel added blends have higher fuel consumption than pure diesel under the NEDC and WLTC due to biodiesel’s lower GCV than pure diesel. Besides having lower GCV, due to combined effect of AFR, combustion temperature, injected fuel pressure, start of injection (SOI), piston bowl geometry, and biodiesel blend ratio on combustion, CO2 emission varies according to both load and engine conditions. However, even though there is an increase at measured CO2 at exhaust gas with biodiesel usage, it should cause less environmental concern as the study at Argonne National Laboratory on B100 reveals that life-cycle greenhouse gas emission of biodiesel is %74 lower than pure diesel [26].
Aside from the wheel power, engine load data according to engine speed under the WLTC and NEDC, plotted with full load power of the engine with FL label to analyze the engine load profile as shown Figure 5. Engine operates under higher speed and power conditions in the WLTC compared to the NEDC, which is consistent with the velocity profile of each cycle. Moreover, higher CO2 emission in g/km released over the WLTC (120.6 and 127.6) than the NEDC (116.8 and 122.5) with B00 and B30 respectively. Therefore, the WLTC is determined to operate under higher load and cause higher CO2 emission compared to the NEDC.
Figure 5. Power distribution of the NEDC, WLTC and FL according to engine speed
3.3 Comparison of CO, HC, and NOx emissions
Although effects of biodiesel on the exhaust emissions of the NEDC and WLTC differ due to different velocity and load profile, the use of alternative fuel is encouraged regardless of the TA procedure as use of alternative fuel reduces the greenhouse gas emissions.
In this section, CO, HC, and NOx emissions of the WLTC and the NEDC are compared for B00 and B30 in order to understand emission sensitivity of each cycle.
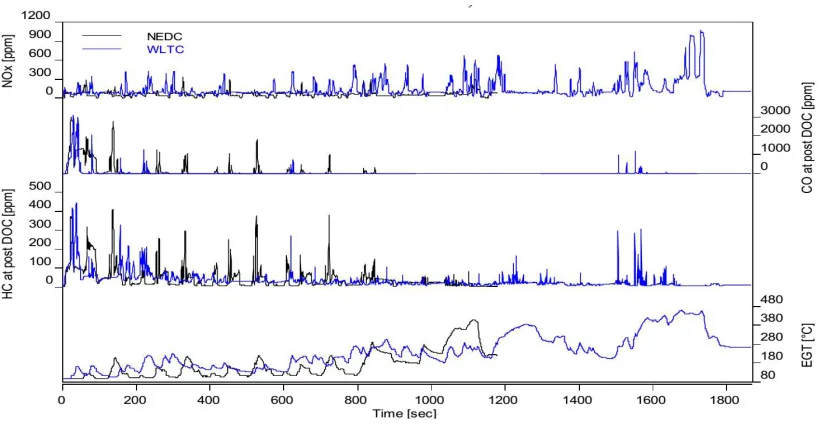
CO and HC conversion efficiency of the DOC is directly related to exhaust temperature due to working principle of the DOC. HC and CO in the exhaust can be converted to H2O and CO2 when the temperature at the entrance of the DOC reaches 200°C, which is the so-called light off temperature. Owing to higher velocity profile at the beginning of the WLTC compared to the NEDC, exhaust temperature escalation initiated earlier in the WLTC. Moreover, due to the relatively shorter idle duration in the WLTC (compared to the NEDC), resulted in better CO and HC emission conversion over the DOC as shown in Figure 6.
Figure 6. Comparison of NOx, CO, and HC emissions at post DOC and Exhaust Gas Temperature
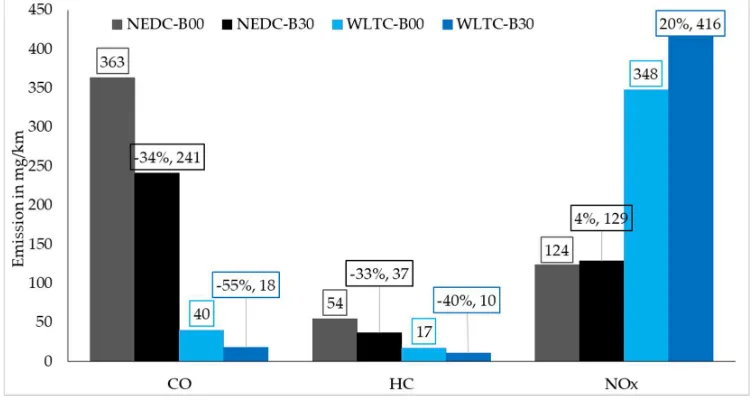
whereas the reduction becomes 55% and 40% under the WLTC respectively as can be seen in Figure 7. Therefore, it can be concluded that vehicles can satisfy the CO and HC regulation limit easier under the WLTC compared to the NEDC and WLTC is more sensitive to biodiesel than the NEDC.
In contrary to CO and HC emissions, both NOx emission and rise in NOx emission due to biodiesel addition are higher over the WLTC than the NEDC as can be seen in Figure 6.
Due to more transient and higher velocity operation profile under the WLTC, NOx emission is higher during the WLTC. Especially in the last 200 seconds of the WLTC, where vehicle speed exceeds 130km/h, the NOx emission reaches 900 ppm, while maximum NOx emission during the NEDC is approximately 300 ppm as shown in Figure 6.
In summary, experiments show that lower CO and HC emissions can be achieved under the WLTC compared to the NEDC while there is clear NOx emission increase. This result is consistent with the Bielaczyc et al.’s experiments that compare emission of six different vehicles with pure diesel under the NEDC, WLTC, and FTP-75 [27]. In addition, variation of CO, HC, and NOx emissions from B00 to B30 is higher in percentage under the WLTC than the NEDC, which may be attributed to higher in-cylinder temperature during the WLTC due to its higher engine speed and load of profile compared to the NEDC.
Figure 7. CO, HC, and NOx emissions of the NEDC and WLTC with B00 and B30
3.4 Comparison of Particulate Number Emission
In addition to gaseous exhaust emissions (CO, HC, and NOx), EU regulation have been restricting the particulate mass (PM) and the particulate number (PN) emissions due to their harmful effects on human health. Main source of the soot emission is the carbon atoms in the diesel fuel. Soot formation begins once the fuel has hydrogen to carbon ratio around 2 and contains 12 to 22 carbon atoms [28]. However, regardless of the carbon atom content, lower aromatics and higher oxygen content of biodiesel prevents the creation of particles and enhance the oxidation of particulate matter [7,11].
Although EU limits both PM and PN emissions, Chuepeng et al. showed the existence of a correlation between the two emissions [29]. As PN and PM emissions have similar trend, only emitted PN emission under the NEDC and WLTC were compared.
B00, PN emission under the WLTC was reduced below to the PN emission under the NEDC with B30, which indicate that the WLTC is more sensitive than the NEDC to biodiesel use for also PN emission. Higher load profile (i.e. in-cylinder temperature) of the WLTC compared to the NEDC may be the reason of the larger PN decrease of the WLTC as Leung et al. was also found that biodiesel causes larger decreases in soot emission under higher load conditions of their single-cylinder engine [30].
Figure 8. PN emission of the NEDC and WLTC with B00 and B30
4. Conclusions & Recommandations
In this study, a Euro-5 capable passenger car with a 1.5 liter diesel engine was instrumented to be tested under the NEDC and WLTC. The main goal of this study was to understand the effects of biodiesel use on the current and new-coming EU regulation cycles, to compare both cycles biodiesel sensitivity, and to investigate the suitability of biodiesel use to have lower exhaust emissions and fuel consumption by evaluating the effects of biodiesel on the performance and combustion.
Based on the conducted experiments and associated analyses and evaluations, the following conclusions are drawn;
Environmental condition and vehicle parameters were kept the same during all experiments, therefore the differences found in exhaust emissions, performance and combustion parameters are determined to be mainly due to biodiesel blend ratio.
In order to keep the power levels identical, such as in the NEDC and WLTC, higher consumption of biodiesel is found to be necessary compared to diesel, as biodiesel has lower GCV than diesel.
NOx emission increased with biodiesel use due to higher oxygen content and shorter IDD of biodiesel compared to diesel. Besides, biodiesel caused more NOx emission under high load and more transient operation conditions compared to low load and steady state operation conditions.
CO, HC, and PN emissions can be drastically reduced by 30% blend use of biodiesel. Mainly higher oxygen content of the biodiesel (compared to diesel) allows to achieve more complete combustion.
Exhaust emissions of the WLTC is more sensitive to biodiesel blended fuels than the NEDC. The use of biodiesel caused a higher increase in NOx and CO2 emissions whereas a higher decrease in CO, HC, and PN emissions under the WLTC (compared to the NEDC) respectively due to higher velocity profile and exhaust temperature of the WLTC.
The aforementioned improvements at CO, HC and PN may allow the OEMs to reduce the size of DOC and DPF in the exhaust. Moreover, OEM may request to use biodiesel blended diesel under certification tests.
In further studies, additional improvements in NOx may also be observed by conducting experiments with a vehicle complying EURO-6 emissions.
Acknowledgments: The authors wish to thank the DB Tarımsal Energy to supply pure biodiesel and its laboratory analyses. The authors also would like to acknowledge the TÜBİTAK Marmara Research Center (MRC) Internal Combustion Engine Technology team for their support during the whole experimental activities. Conflicts of Interest: The authors declare no conflict of interest.
References
1. Lim, C.; Lee, J.; Hong, J.; Song, C.; Han, J.; Cha, J. Evaluation of regulated and unregulated emissions from a diesel powered vehicle fueled with diesel / biodiesel blends in Korea. Energy 2014, 77, 533–541, doi:10.1016/j.energy.2014.09.040.
2. Ganjehkaviri, A.; Mohd Jaafar, M. N.; Hosseini, S. E.; Musthafa, A. B. Performance evaluation of palm oil-based biodiesel combustion in an oil burner. Energies 2016, 9, 1–10, doi:10.3390/en9020097.
3. Ashraful, A. M.; Masjuki, H. H.; Kalam, M. A.; Rizwanul Fattah, I. M.; Imtenan, S.; Shahir, S. A.; Mobarak, H. M. Production and comparison of fuel properties, engine performance, and emission characteristics of biodiesel from various non-edible vegetable oils: A review. Energy Convers. Manag. 2014, 80, 202–228, doi:10.1016/j.enconman.2014.01.037.
4. Gokalp, B.; Buyukkaya, E.; Soyhan, H. S. Performance and emissions of a diesel tractor engine fueled with marine diesel and soybean methyl ester. Biomass and Bioenergy 2011, 35, 3575–3583, doi:10.1016/j.biombioe.2011.05.015.
5. Bermúdez, V.; Lujan, J. M.; Ruiz, S.; Campos, D.; Linares, W. G. New European Driving Cycle assessment by means of particle size distributions in a light-duty diesel engine fuelled with different fuel formulations. Fuel 2015, 140, 649–659, doi:10.1016/j.fuel.2014.10.016.
6. Serrano, L.; Lopes, M.; Pires, N.; Ribeiro, I.; Cascão, P.; Tarelho, L.; Monteiro, A.; Nielsen, O.; da Silva, M. G.; Borrego, C. Evaluation on effects of using low biodiesel blends in a EURO 5 passenger vehicle equipped with a common-rail diesel engine. Appl. Energy 2015, 146, 230–238, doi:10.1016/j.apenergy.2015.01.063.
7. Aldhaidhawi, M.; Chiriac, R.; Badescu, V. Ignition delay, combustion and emission characteristics of Diesel engine fueled with rapeseed biodiesel - A literature review. Renew. Sustain. Energy Rev. 2017, 178– 186.
8. Datta, A.; Mandal, B. K. Engine performance, combustion and emission characteristics of a compression ignition engine operating on different biodiesel-alcohol blends. Energy 2017, 125, 470–483, doi:10.1016/j.energy.2017.02.110.
9. Wan Ghazali, W. N. M.; Mamat, R.; Masjuki, H. H.; Najafi, G. Effects of biodiesel from different feedstocks on engine performance and emissions: A review. Renew. Sustain. Energy Rev. 2015, 51, 585– 602, doi:10.1016/j.rser.2015.06.031.
10. Xue, J.; Grift, T. E.; Hansen, A. C. Effect of biodiesel on engine performances and emissions. Renew. Sustain. Energy Rev. 2011, 15, 1098–1116, doi:10.1016/j.rser.2010.11.016.
11. Wei, L.; Cheung, C. S.; Ning, Z. Influence of waste cooking oil biodiesel on combustion, unregulated gaseous emissions and particulate emissions of a direct-injection diesel engine. Energy 2017, 127, 175– 185, doi:10.1016/j.energy.2017.03.117.
12. Özener, O.; Yüksek, L.; Ergenç, A. T.; Özkan, M. Effects of soybean biodiesel on a DI diesel engine performance, emission and combustion characteristics. Fuel 2014, 115, 875–883, doi:10.1016/j.fuel.2012.10.081.
characterization from EURO 5 diesel/biodiesel passenger car operating under the new European driving cycle. Atmos. Environ. 2013, 84, 339–348, doi:10.1016/j.atmosenv.2013.11.071.
14. Armas, O.; García-contreras, R.; Ramos, Á. Impact of alternative fuels on performance and pollutant emissions of a light duty engine tested under the new European driving cycle. Appl. Energy 2013, 107, 183–190, doi:10.1016/j.apenergy.2013.01.064.
15. Lopes, M.; Serrano, L.; Ribeiro, I.; Cascão, P.; Pires, N.; Rafael, S.; Tarelho, L.; Borrego, C. Emissions characterization from EURO 5 diesel / biodiesel passenger car operating under the new European driving cycle. Atmos. Environ. 2014, 84, 339–348, doi:10.1016/j.atmosenv.2013.11.071.
16. Mock, A. P.; Kühlwein, J.; Tietge, U.; Franco, V.; Bandivadekar, A.; German, J. The WLTP : How a new test procedure for cars will affect fuel consumption values in the EU. In The International Council of Clean Transportation; 2014.
17. Pavlovic, J.; Marotta, A.; Ciuffo, B. CO2 emissions and energy demands of vehicles tested under the NEDC and the new WLTP type approval test procedures. Appl. Energy 2016, 177, 661–670, doi:10.1016/j.apenergy.2016.05.110.
18. Bielaczyc, P.; Szczotka, A.; Woodburn, J. Investigations into Exhaust Particulate Emissions from Multiple Vehicle Types Running on Two Chassis Dynamometer Driving Cycles. 2017, doi:10.4271/2017-01-1007.Copyright.
19. Cubito, C.; Millo, F.; Boccardo, G.; Di Pierro, G.; Ciuffo, B.; Fontaras, G.; Serra, S.; Otura Garcia, M.; Trentadue, G. Impact of Different Driving Cycles and Operating Conditions on CO2 Emissions and Energy Management Strategies of a Euro-6 Hybrid Electric Vehicle. Energies 2017, 10, 1590, doi:10.3390/en10101590.
20. States, U. Analysis of Biodiesel Impacts on Exhaust Emissions Draft Technical Report. United States Environ. Prot. Agency 2002, 118, doi:EPA420-P-02-001.
21. How, H. G.; Masjuki, H. H.; Kalam, M. A.; Teoh, Y. H. An investigation of the engine performance, emissions and combustion characteristics of coconut biodiesel in a high-pressure common-rail diesel engine. Energy 2014, 69, 749–759, doi:10.1016/j.energy.2014.03.070.
22. Man, X. J.; Cheung, C. S.; Ning, Z.; Wei, L.; Huang, Z. H. Influence of engine load and speed on regulated and unregulated emissions of a diesel engine fueled with diesel fuel blended with waste cooking oil biodiesel. Fuel 2016, 180, 41–49, doi:10.1016/j.fuel.2016.04.007.
23. Brace, C. J.; Burke, R.; Moffa, J. Increasing accuracy and repeatability of fuel consumption measurement in chassis dynamometer testing. Proc. Inst. Mech. Eng. Part D J. Automob. Eng. 2009, 223, 1163–1177, doi:10.1243/09544070JAUTO1084.
24. Loiselle-Lapointe, A.; Conde, A. J.; Ribberink, H. Chevrolet Volt On-Road Test Programs In Canada Part 1: Effects Of Drive Cycle, Ambient Temperature And Accessory Usage On Energy Consumption And All-Electric Range. Int. J. … 2015, 18, 103–115, doi:10.1007/s12239−017−0011−y.
25. Özçelik, A. E.; Aydoğan, H.; Acaroğlu, M. Determining the performance, emission and combustion properties of camelina biodiesel blends. Energy Convers. Manag. 2015, 96, 47–57, doi:10.1016/j.enconman.2015.02.024.
26. Alleman, T. L.; McCormick, R. L. Biodiesel Handling and Use Guide; 2010; ISBN 9781608761388.
27. Bielaczyc, P.; Woodburn, J.; Szczotka, A. Exhaust Emissions of Gaseous and Solid Pollutants Measured over the NEDC , FTP-75 and WLTC Chassis Dynamometer Driving Cycles. SAE Int. 2016, doi:10.4271/2016-01-1008.Copyright.
28. Heywood, J. B. Internal Combustion Engine Fundementals; 1988; Vol. 21; ISBN 007028637X.
exhaust gas of a modern diesel Engine fuelled with a biodiesel blend. Biomass and Bioenergy 2011, 35, 4280–4289, doi:10.1016/j.biombioe.2011.07.017.