Article
Human Activity Recognition Based on Quantization
on Feature’s Classification Capability
Cheng Xu 1,2, Xiaotong Zhang 1,2 and Jie He 1,2,*
1 School of Computer and Communication Engineering, University of Science and Technology Beijing,
Beijing 100083, China; [email protected] (C.X.); [email protected] (X.Z.)
2 Beijing Key Laboratory of Knowledge Engineering for Materials Science, Beijing 100083, China
* Correspondence: [email protected]; Tel.: +86-13810512567
Abstract: Motion related human activity recognition using wearable sensors can potentially enable various useful daily applications. So far, most studies view it as a stand-alone mathematical classification problem without considering the physical nature of human motions. Consequently, they suffer from data dependencies and encounter the dimension disaster problem and the over-fitting issue, and their models are never human-readable. In this study, we start from a deep analysis on natural physical properties of human motions, and then propose a useful feature selection method to quantify each feature's classification contribution capability. On one hand, the "dimension disaster" problem can be avoid to some extent, due to the affined dimension of key features; On the other hand, over-fitting issue can be depressed since the knowledge implied in human motions are nearly invariant, which compensates the possible data inadequacy. The experiment results indicate that the proposed method performs superior to those adopted in related works, such as decision tree, k-NN, SVM, neural networks.
Keywords: activity recognition, physical attributes, classification capability
1. Introduction
Human motion related activity recognition (HAR) is one of the most promising research topics for a variety of areas and has been drawing more and more researchers' attention. Due to the advantages of no need to deploy in advance, smaller data volume, lower cost and power consumption, sensors-based HAR stands out among various technologies[1-3] and has been drawing tremendous attention and applied into a variety application areas, such as medical care[1], emergency rescue[2], and smart home surveillance[3].
Most related works use data-driven methods which tend to take the advantage of multiple sensors[2,4] as well as improved feature extraction and classification algorithms[3-10] to extend the HAR classification model's generalization performance. However, this may lead to two drawbacks. Data-driven methods hardly look into the nature of motions and cannot extract the most important features. As a result, the introduction of complex features and algorithms may not only lead to extra burden on computational capability, but also causes dimension disaster problem[4] which on the contrary degrade the classifier's performance.
etc., are adopted to pursue a better generalization performance on human motion recognition problem.
In this paper, we present a conceptual model of human motions with which a new approach is put forward to recognize human motion related activities. By deeply mining commonly understanding of motions, a conceptual motion model is proposed. It improves the performance of traditional method and makes up for the inadequacy of data itself. In this way, key features are extracted and the classification result shows that our proposed DFSA method works better than traditional methods such as C4.5, SVM, BP and has achieved a general true classification rate of 96.4%±0.025.2. Materials and Methods
2. Feature’s Classification Capability
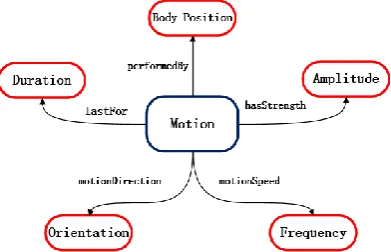
Classification capability refers to the performance of one feature to separate an activities from the others. It's commonly believed that a human motion can be described from several attributes, such as intensity, orientation, velocity, and so on. These attributes, in some aspects, embody characteristics of motions and can be related with a series of key features that most eminently reflect the physical difference between activities. These key features may be used to group different kinds of activities into several subclasses as they have various distribution overlap on the same attribute. We thus make the most of the common sense knowledge exploring the physical attributes of daily human motions to construct a conceptual motion model, as shown in Fig. 1. We model a human motion with attributes of intensity, orientation, velocity, body position and duration. Each attribute represents human motions in a side view from a particular angle. Detailed explanation and analysis are described as follows:
Figure 1. The conceptual motion model. Each motion can be viewed as a combination of five attributes: Intensity, Orientation, Velocity, Body-Position and Duration.
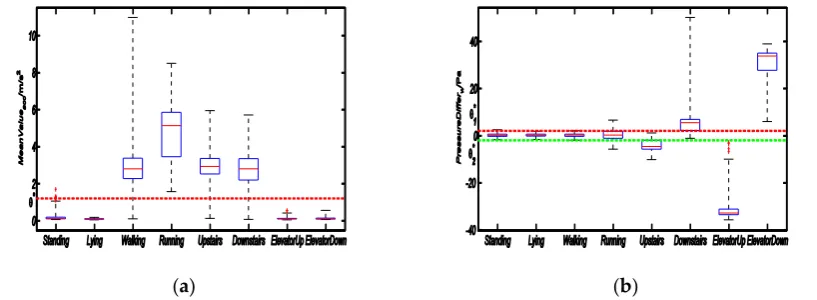
Intensity Attribute: Different motions behave differently in the performance of exercise intensity. In everyday life, activities, such as walking, running, walking upstairs, and walking downstairs, consist of a series of periodic mechanical actions, while activities, such as standing, lying, elevatorup, and elevatordown, are almost relatively static to surrounding environment. Therefore, taking the difference of intensity attribute between different activities, we can divide the activity case set into two subclasses, the former Active Activity and the latter Rest Activity. Features, like mean value of acceleration (MeanValueacc shown in Fig. 2-(a) ) are to some extent related with activities' intensity attribute. Distinction between active and rest activities can be easily made with the use of intensity related features.
Velocity Attribute: Velocity can clearly and effectively describe how fast human repeat the motion. Considering the obvious differences among activities with different motion velocity, we can group activities into Relatively High Velocity Motion and Relatively Low Velocity Motion, taking Running and Walking for an example. And it also works on WalkingUpstairs (or WalkingDownstairs) versus ElevatorUp (or ElevatorDown). Features like variance of the acceleration ( ) reflect sensor data's vibration with the going of activity.
Body-Position Attribute: Human activities can be seen as a combination of a series of body-part movements instead of performed by one single body-part, which means distinction may arise from body-position where sensors are mounted. In other words, for certain activities, it may have similar distribution of sensor data from one body-part, while clearly difference will be seen when several body-parts' data distribution are viewed together, which can be made use of to do the distinction. For example, Standing and Lying are two static activities while sensors on single body-part are almost invariable. It's very difficult to separate them from each other with data from only one body-part. However, if data from sensor mounted to Ankle and Shoulder are combined, the pressure difference between these two position (PressureDifferAS) will contribute greatly to the distinction of the two activities.
Duration Attribute: Every Activity lasts for a certain time, and it's easy to be understood that the longer the time window is, the easier to distinguish different activities. If we certainly know how long a particular activity lasts for, we could obtain more useful information with the help of analyzing the whole activity process. In this study, we take an empirical window length of 2 seconds, in order to avoid the complexity as well as improve the classifier's generalization performance.
The above attributes constitute various activities. Purpose of the study in this paper is to quantify features’ classification capability and make the most of the differences among activities' attributes in order to tell them apart. Therefore we propose a DFSA algorithm with the analyzing of attributes' distribution in methods detailed in next section.
(a) (b)
Figure 2. Boxplot of four features corresponded respectively to the attributes demonstrated in motion model.
3. Feature Quantification and Selection based on Classification Contribution Capability
In order to have more flexibility and have a better description on the classification ability of different features, we bring in a quantification mechanism, with which the best combination of features needed by the classifier are extracted. Detailed algorithm will be demonstrated as follows.
3.1. Feature Quantification
As analyzed above, a key feature should have a less distribution overlap so we bring in the
conception of Divergence[11] to quantize class separability. While the ratio
( | , )
( | , )
t i t
j P x A P x A
can reflect the
distinguishing capability of feature vector
x
t on activityA
i andA
j , divergence[11] can be
ij ij ji
( | , )
( ( | , ) ( | , )) ( )
( | , ) d = D +D
t
t t i t
i j t
j
P A
P A P A ln d
P A
x
x x x
x
and one feature's Average Divergence is denoted as
1 & 1 1( ) (
)
N j Nd i j ij
i i j
P A P A d
where P A( i) and P A( j) stands for the probability of activity
A
i andA
j.The bigger one feature’s Average Divergence is, the greater contribution to the separability of activities the feature has made. As Average Divergence directly reflects one feature’s distinguishing capability and has a linear relationship with classification accuracy, in this study, we take it as a standard for filtering features.
3.2 Feature Selection
Throughout this whole study, 50 commonly features used in related articles [3-10]are extracted for candidate selection, such as mean, variance, interquartile range, signal magnitude area (SMA), etc. However, as stated previously in this paper, the number of features applied in one classifier is not the more the better. Key features should be picked out from the overall feature candidates to model classifier. It can be realized from two aspects: 1) remove the useless features and 2) remove the related components. In order to better explain this problem, we take the the classification of activities listed in Activity set for example. The extract feature combinations are not given for simplification.
Activity = Standing,Lying,Walking,Running,
Upstairs,Downstairs,ElevatorUp,Elevator
{
Down}
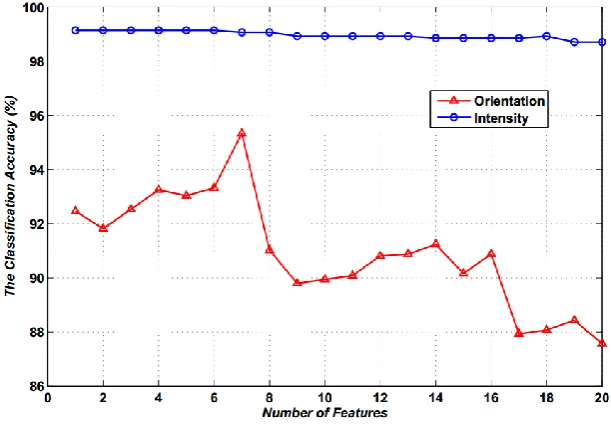
In the quantification method presented in Section 3.1, all 50 features are sequenced in descending order and are added into the classifier one by one to get classification accuracy as output. For simplicity, only the top 20 features with the largest classification accuracy are picked out and displayed in Fig. 3. It shows the classification results as the number of features used in SVM classifier ranges from 1 to 20.
Figure 3. The classification accuracy varies with the number of features used ranging from 1 to 20.
same time, under the same number of features, intensity-related classifier clearly has higher classification accuracy than orientation-related classifier, and in addition, intensity-related classifier shows a better consistency performance than orientation-related classifier which shows little degradation in classification performance with the increasement of feature number.
From Fig. 3 we can draw the conclusion that certain combination of features are needed for each classifier to obtain the best classification performance. To achieve maximum accuracy, we propose a Divergence-based Feature Selection Algorithm (DFSA) on the basis of floating search method[12], which provides a method to reconsider the features rejected before in the feature selection process and meanwhile features selected beforehand can also be deleted. DFSA is detailed as follows.
Given a feature set consists of N features, and N equals to 50 in this paper, we aim to find a feature subset with the best k (k=1,2, ... , l, l≤N) features resulting the largest average divergence
namely the best classification performance. Denote Xk {x x1, 2, ,xk} as the combination of the
best k features and the rest of N k features is denoted as YN k . We reserve all best subsets of
important functions D(*) are defined as follows to present a feature's importance. For features in Xk
, D(*) is denoted as
1( ) ( ) ( ),
k t k k t t k
D x d X d X x if x X
For features are not in Xk, D(*) is denoted as
1( ) ( ) ( ),
k t k t k t k
D x d X x d X if x X
In selected features set Xk, the most importance feature
x
t is defined as the feature with thelargest divergence contribution, subjecting to
1
(
)
t k 1(
)
k t X k t
D
x
max
xD
x
the least importance feature xt is defined as the feature with the smallest divergence contribution,
subjecting to
1
(
)
t k 1(
)
k t X k t
D
x
min
xD
x
Similarily, in candidate features set Y Xk, the most importance feature xt is defined as the
feature with the largest divergence contribution, subjecting to
1
(
)
t k 1(
)
k t Y X k t
D
x
max
xD
x
and the least importance feature xt is defined as the feature with the smallest divergence
contribution, subjecting to
1
( )
t k 1( )
k t Y X k t
D
x
min
xD
x
The core of this algorithm is: in the next step, by borrowing a feature from Ym-k construct the (k+1)th key feature subset Xk+1; then turn back to lower dimensional subsets to verify whether average divergence has been improved while new feature is added, and if so, replace previously selected features with new one. To obtain the best feature subset to maximize the classification performance of each classifier, DFSA is described as shown in Algorithm 1.
With the implementation of DFSA, Key Feature Subset is extracted as output for chosen classifiers. The results are shown in set Key Features, which also indicate the features should be adopted in the following classification process. Some features needed by each classifier are the same so that they only need to be calculated once. The computational effort is reduced to a great extent compared with general methods. Classification results and performance comparisons will be detailed in the following section.
4. Experiments and Results Analysis
4.1 Experiment setup
Figure 4. Experimental Platform Settings. Each sensor unit is mounted onto body locations tagged by red circles. MCU and storage unit is located in place marked with blue box.
,
,
,
,
Location
Ankle Knee Waist Shoulder Wrist
Experiments are conducted over the data set sampled by the above platform at 10 Hz. More than 30000 samples of each activity listed in Activity set are taken and a 10-fold cross validation is applied to ensure that the sample set is large enough to guarantee the classification accuracy and generalization performance. We use the presented platform for data collection and perform all processing work offline in Matlab with PC (Intel Core i5-3210M CPU, 8G RAM). Our dataset is open sourced at https://github.com/Ethan--Xu/PKDT-dataset.
4.2 Results Analysis
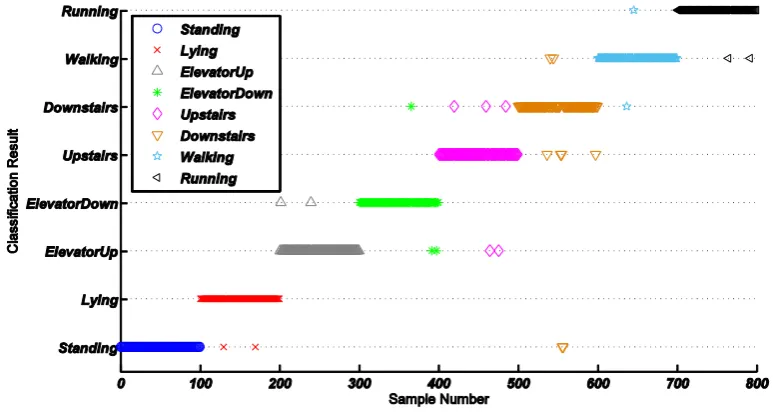
The effectiveness of our DFSA method are shown in Fig.5. As shown in Fig. 5, proposed DFSA shows as well a better consistency on all 8 activities' classification accuracy and at the same time we can see it has a generally higher precision when comes to each independent activity. It presents differnet classification performance on each activity as the different combination of features lead to diverse classification capability on HAR.
From the above figure we can conclude that DFSA shows a better classification performance which show a higher classification accuracy and better consistency. With the results of 10-folder cross validation, it works better in the classification of all 8 activities listed in Activity set reaching a final mean accuracy of 96.4% and low standard deviation of 0.025.
Apart from the observations mentioned above, mis-classifications are counted to 22 of the totally 800 samples which means the classification accuracy can be as high as 97.25%. And the cross validation result of DFSA shown in Fig. 5 comes out to be at a mean accuracy of 96.4% and the standard deviation is as low as 0.025 which shows DFSA method can has a high precision as well as high consistency.
4.3 Comparison with Existing Approaches
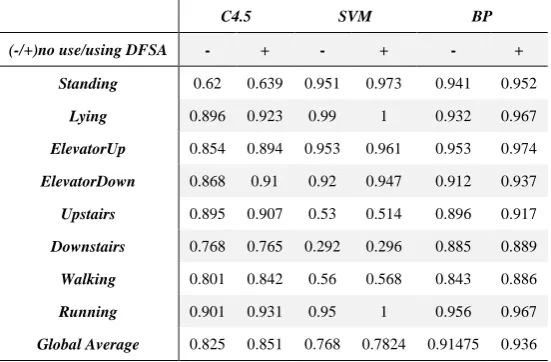
Our proposed DFSA method takes advantage of Divergence to quantify feature’s classification capability, optimize the feature selection process and improve the classifier’s performance. To verify the validity of DFSA on HAR problem, we take decision trees (C4.5), support vector machine and BP neural work algorithms which are the most widely used four algorithms in the study of HAR to make a brute-force comparison. To compare the classifiers and to identify a principal classifier, we used the experimenter environment in the WEKA toolkit[13], and with or without DFSA in the feature selection process.
Table 1. Comparison of classification accuracy with or without using the proposed DFSA method.
C4.5 SVM BP (-/+)no use/using DFSA - + - + - +
Standing 0.62 0.639 0.951 0.973 0.941 0.952
Lying 0.896 0.923 0.99 1 0.932 0.967
ElevatorUp 0.854 0.894 0.953 0.961 0.953 0.974
ElevatorDown 0.868 0.91 0.92 0.947 0.912 0.937
Upstairs 0.895 0.907 0.53 0.514 0.896 0.917
Downstairs 0.768 0.765 0.292 0.296 0.885 0.889
Walking 0.801 0.842 0.56 0.568 0.843 0.886
Running 0.901 0.931 0.95 1 0.956 0.967
Global Average 0.825 0.851 0.768 0.7824 0.91475 0.936
The major contribution of this work is the proposal of a quantified method to evaluate and select features for motion related human activities. In this study, we construct a conceptual model of motion related activities with exploring common domain knowledge with which DFSA feature selection method is constructed. DFSA shows a better recognition accuracy (96.4\% on average) and lower time consumption (0.02s on average) compared with most widely used methods such as decision tree, SVM and neural networks
5. Conclusion
The major contribution of this work is the proposal of a quantified method to evaluate and select features for motion related human activities. In this study, we construct a conceptual model of motion related activities with exploring common domain knowledge with which DFSA feature selection method is constructed. DFSA shows a better recognition accuracy (96.4\% on average) and lower time consumption (0.02s on average) compared with most widely used methods such as decision tree, SVM and neural networks
Acknowledgments: This work is supported by National Natural Science Foundation of China (NSFC) project No. 61302065, No. 61304257, No. 61671056, Natural Science Foundation of Beijing Municipality No.4152036 and the Fundamental Research Funds for the Central Universities No. FRF-TP-15-026A2. It’s also supported by Cooperation Study Foundation between University of Science and Technology Beijing and National Taipei University of Technology.
1. Weng S, Xiang L, Tang W, et al. A low power and high accuracy MEMS sensor based activity recognition algorithm[C]// 2014 IEEE International Conference on Bioinformatics and Biomedicine (BIBM). IEEE Computer Society, 2014:33-38.
2. Kau L, Chen C. A smart phone-based pocket fall accident detection, positioning and rescue system[J]. 2014. 3. Minor B, Doppa J R, Cook D J. Data-Driven Activity Prediction: Algorithms, Evaluation Methodology, and Applications[C]//Proceedings of the 21th ACM SIGKDD International Conference on Knowledge Discovery and Data Mining. ACM, 2015: 805-814.
4. Trunk G V. A problem of dimensionality: A simple example[J]. Pattern Analysis and Machine Intelligence, IEEE Transactions on, 1979 (3): 306-307.
5. Plötz T, Hammerla N Y, Olivier P. Feature Learning for Activity Recognition in Ubiquitous Computing.[C]// IJCAI 2011, Proceedings of the, International Joint Conference on Artificial Intelligence, Barcelona, Catalonia, Spain, July. 2011:1729-1734.
6. Iosifidis A, Tefas A, Pitas I. Activity-Based Person Identification Using Fuzzy Representation and Discriminant Learning[J]. Information Forensics & Security IEEE Transactions on, 2012, 7(99):1-1.
7. Atallah L, Lo B, King R, et al. Sensor positioning for activity recognition using wearable accelerometers[J]. Biomedical Circuits and Systems, IEEE Transactions on, 2011, 5(4): 320-329.
8. Ghasemzadeh, Hassan, and Roozbeh Jafari. "Physical movement monitoring using body sensor networks: A phonological approach to construct spatial decision trees." Industrial Informatics, IEEE Transactions on 7.1 (2011): 66-77.
9. Liu, Shaopeng, et al. "Multisensor data fusion for physical activity assessment." Biomedical Engineering, IEEE Transactions on 59.3 (2012): 687-696.
10. Wang, Zhelong, et al. "An incremental learning method based on probabilistic neural networks and adjustable fuzzy clustering for human activity recognition by using wearable sensors." Information Technology in Biomedicine, IEEE Transactions on 16.4 (2012): 691-699.
11. Swain P H, King R C. Two effective feature selection criteria for multispectral remote sensing[J]. 1973. 12. Pudil P, Novovičová J, Kittler J. Floating search methods in feature selection[J]. Pattern Recognition Letters,
1994, 15(11):1119-1125.
13. I. H. Witten and E. Frank, Data Mining: Practical Machine Learning Tools and Techniques With Java Implementations. Burlington, MA: Morgan Kaufmann, 2002.