EXPLAINING GLOBAL PATTERNS OF POPULATION AGING IN 2012 BY THE DEMOGRAPHIC TRANSITION MODEL
Ramani Ponnapalli
Department of Population Studies, Annamalai University, Annamalainagar-608 002 Tamil Nadu, INDIA
Krishna Murthy Ponnapalli
Department of Fertility Studies, International Institute for Population Sciences, Mumbai, INDIA
A. Subbiah
Department of Population Studies, Annamalai University, Annamalainagar-608 002 Tamil Nadu, INDIA
ABSTRACT
The objective of the present paper is twofold: (1) to make an attempt to review in general the inter-linkages between the demographic transition model and the ageing process, (2) to show how one can make use of the recent criterion suggested by McCracken and Phillips in understanding the ageing process presently taking place in different countries of the world.
The study comes to the important conclusion that out of 210 countries in the world, in 91 countries the aging process is in full progress. In 63 countries it is going to be a problem in the near future. However, for 56 countries it is not at all a problem and majority of these countries are observed in the African region, if one follows the criterion suggested by McCracken and Phillips. [130 words]
Keywords: Demographic Transition, Ageing of the population, Fertility, Mortality. JEL classification numbers: Not known
INTRODUCTION
Population Aging
'Population aging is fast becoming a global phenomenon'. At the outset it is recognized that "individual aging" differs from "population aging". In the literature several terms are in use to
describe 'someone becomes old' or 'individual aging'. For instance, (Kinsella and Phillips, 2005)
refer to people of age 65 or older as "older population" or "older people", and those people age 80 or older as "oldest old", for convenience. They further clarify that "Population aging" is "usually
defined as the percentage of a given population age 65 or older (and sometimes the percentage ages 60 and older)."
International Journal of Asian Social Science
The commonly asked question is How Populations Age? It may be well explained by means of
looking at the inter-linkages between the two components of the Health transition namely the demographic transition and the epidemiological transition given in Figure 1.1below which is due to Mosley and Chen.
As rightly stated by Kinsella and Phillips (2005) and has been noted in the Figure 1.1, "Population
aging may be seen as a human success story-the triumph of public health, medical advancements, and economic development over the diseases and injuries that had limited human life expectancy for millennia." Kinsella and Phillips (2005) further states “the most prominent historical factor in
population aging has been declining fertility” Thus said, population aging may be seen fast becoming a global phenomenon as a result of two important factors namely: an increase in life
expectancy and a decline in fertility of the global populations. Figure 1.1 further explains that population aging is an ultimate consequence of completion of the phenomenon called the "demographic transition".
Figure-1.1. Mosley and Chen's explanation of the Health Transition
(Source: Extracted from Mosley and Chen's lecture notes Module 7a on : Mortality and morbidity trends and
differentials of Johns Hopkins University)
The Demographic Transition
Kinsella and Phillips (2005) states that “the term "demographic transition" is used to describe a gradual process of change from high rates of fertility and mortality to low rates of fertility and
'modernization process' on mortality at first followed by its impact on fertility later on. Some
researchers prefer to describe the 'demographic transition further as: 'a theory', 'a historic model', and as 'a predictive model'.
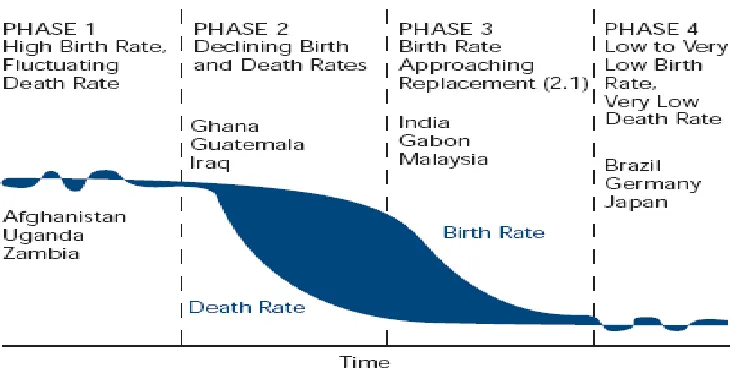
As stated by Notestein (1945), and also as shown in Figure 1.2 below, which is due to (Haub and Gribble, 2011), one may further show the phenomenon of demographic transition in four phases
that describes the past and future of the population growth of several countries in terms of the systematic phase wise changes in mortality followed by changes in fertility due to the impact of modernization and also due to governmental efforts in the recent past especially of the developing
countries such as China and India, for instance. Haub and Gribble (2011) illustrated each phase of the transition by means of giving an example of three countries for each of the phase. As per the
diagram, India is at present seen to be in the third phase of the demographic transition. As shown in Figure 1.1, and further said, population aging may be seen as a mere resultant of the completion of the demographic transition.
Figure-1.2. The Classic Phases of Demographic Transition due to Haub and Gribble (2011).
Explaining Global Patterns of Population Aging by the Demographic Transition Model
In the very recent past some attempts have been made by few researchers (see (Rowland, 2009; Davies and James, 2011) to explain the global patterns of population aging by means of the
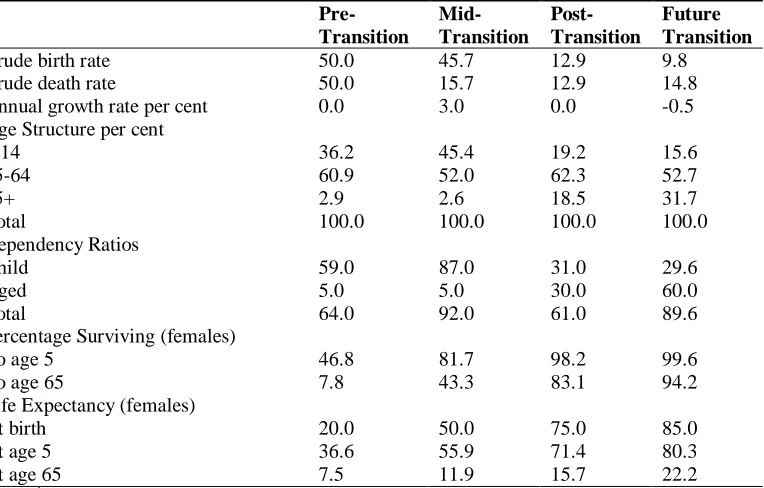
According to Rowland (2009) as shown in Table 1.1 below, which is due to Rowland, "as a starting point, the course of population aging through time will be discussed with reference to the "classical" pattern of demographic transition, the historical average trend in vital rates in Western
Europe since eighteenth century." Table 1.1 clearly explains that population aging 'began relatively late in the demographic transition. Rowland (2009) states Population aging in Europe began "only
in the last quarter of the nineteenth century as fertility decline became prominent."A detailed description of the contents of Table 1.1 was well made by Rowland in his study. Rowland (2009) highlights the point that "the timing of the start of population aging itself has varied between
countries in Europe and elsewhere, depending when sustained fertility decline began."
Table-1.1. Characteristics of populations during and after the demographic transition Pre-Transition Mid-Transition Post-Transition Future Transition Crude birth rate
Crude death rate
Annual growth rate per cent Age Structure per cent 0-14 15-64 65+ Total Dependency Ratios Child Aged Total
Percentage Surviving (females) To age 5
To age 65
Life Expectancy (females) At birth
At age 5 At age 65
50.0 50.0 0.0 36.2 60.9 2.9 100.0 59.0 5.0 64.0 46.8 7.8 20.0 36.6 7.5 45.7 15.7 3.0 45.4 52.0 2.6 100.0 87.0 5.0 92.0 81.7 43.3 50.0 55.9 11.9 12.9 12.9 0.0 19.2 62.3 18.5 100.0 31.0 30.0 61.0 98.2 83.1 75.0 71.4 15.7 9.8 14.8 -0.5 15.6 52.7 31.7 100.0 29.6 60.0 89.6 99.6 94.2 85.0 80.3 22.2
Notes: 1 Whereas the figures in the other columns derive from demographic models, those in the last
column are based on data for Italy, for which the rates refer to 2025-2050, other data to 2050; 2 Crude
birth rate: births/population X 1000; 3Crude death rate: deaths/population X 1000; 4 Child dependency
ratio: 0-14/15-64 X 1000; 5 Aged dependency ratio: 65+/15-64 X 1000'
Source: Hauser(1976:66), World Bank (1994:281), Coale and Demeny (1983) and Coale and Guo(1990:33)
NOTE: This table has been extracted from Rowland, Donald T. (2009:40)
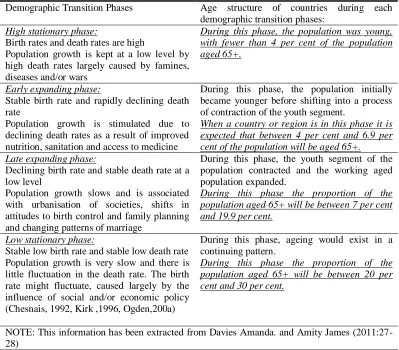
Table 1.2 below is an attempt to show by means of a table by the present researcher the
inter-linkage between the demographic transition and the age-structure of the population as reported in Davies and James (2011) of the McCracken and Phillips (2005) explanation for using the
Table-1.2. McCracken and Phillips (2005) description for the age structure of countries during each demographic transition phases
Demographic Transition Phases Age structure of countries during each demographic transition phases:
High stationary phase:
Birth rates and death rates are high
Population growth is kept at a low level by high death rates largely caused by famines, diseases and/or wars
During this phase, the population was young, with fewer than 4 per cent of the population aged 65+.
Early expanding phase:
Stable birth rate and rapidly declining death rate
Population growth is stimulated due to declining death rates as a result of improved nutrition, sanitation and access to medicine
During this phase, the population initially became younger before shifting into a process of contraction of the youth segment.
When a country or region is in this phase it is expected that between 4 per cent and 6.9 per cent of the population will be aged 65+. Late expanding phase:
Declining birth rate and stable death rate at a low level
Population growth slows and is associated with urbanisation of societies, shifts in attitudes to birth control and family planning and changing patterns of marriage
During this phase, the youth segment of the population contracted and the working aged population expanded.
During this phase the proportion of the population aged 65+ will be between 7 per cent and 19.9 per cent.
Low stationary phase:
Stable low birth rate and stable low death rate Population growth is very slow and there is little fluctuation in the death rate. The birth rate might fluctuate, caused largely by the influence of social and/or economic policy (Chesnais, 1992, Kirk ,1996, Ogden,200a)
During this phase, ageing would exist in a continuing pattern.
During this phase the proportion of the population aged 65+ will be between 20 per cent and 30 per cent.
NOTE: This information has been extracted from Davies Amanda. and Amity James (2011:27-28)
Explaining Patterns of Population Aging by the Demographic Transition Model: 210 Countries in the World in the Year 2012
In the present section using the criterion suggested by McCracken and Phillips (2005:43-45) further
given in the section above, and the per cent of the population 65+ given in the Population
Reference Bureau. (2012) World Population Data Sheet, we tried to explain how the 210 countries
of the world which are in different phases of the demographic transition can be regrouped into countries in different phases of their demographic transition based on the aging indicator 'per cent population 65+'
Table 1.3 and Figure 1.3 given below shows the world's 210 countries as countries in different
Table-1.3. Classification of world 210 countries by region into different Phases of the Demographic Transition using the per cent population 65+ given in PRB 2012 World Data Sheet
Region/Phase Phase1 P65+: (<4%)
Phase 2 P65+: (4% -6.9%)
Phase 3 P65+: (7% - 19.9%)
Phase 4 P65+: (20% - 30%)
Total Number of Countries
Africa 37 (65 %) 18 (32 %) 2 (4 %) 0 (0 %) 57 (100%) Asia 13 (25 %) 21 (41 %) 16 (31 %) 1 (2 %) 51 (100%)
Europe 0 (0 %) 0 (0 %) 42 (93 %) 3 (7 %) 45 (100%)
Latin America and Caribbean
1 (3 %) 16 (42 %) 21 (55 %) 0 (0 %) 38 (100%)
Northern America 0 (0%) 0 (0%) 2 (100%) 0 (0 %) 2 (100%)
Oceania 5 (29 %) 8 (47 %) 4 (24 %) 0 (0%) 17 (100%)
Total Number of Countries
56 (27 %) 63 (30 %) 87 (41 %) 4 (2 %) 210 (100%)
Source: PRB 2012 World Data Sheet; Figures in brackets refer to per cent in total of the region
Results of the analysis given in Table 1.3 and Figure 1.3 may be summarized as follows:
1) Overall the criterion suggested by McCracken and Phillips (2005) seems to succeed in classifying the countries in the world into different phases of the demographic transition model
merely by using the simple indicator of population ageing, that is, the per cent population aged 65+.
2) It is seen that almost all countries (42 out of 45 countries) of the European region are observed to be in the Phase 3 of the demographic transition by the year 2012 and are said to be very old by age structure.
3) In rank order the countries of America (Latin America and Caribbean and also of Northern America) followed by Asia are seen to fall in the Phase 3 according to the aging process in
comparison to other countries in the world.
4) Not surprisingly, all the countries of Africa which are in the early stages of the demographic transition with very low per cent of population 65+ are observed to be falling in the Phase 1 and
Phase 2 of the demographic transition.
AFRICA ASIA EUROPE LATIN
AMERICA AND CARIBBEAN
NORTHERN AMERICA
OCEANIA 37
13
0 1 0 5
18 21
0
16
0 8
2 16
42
21
2 4
0 1 3 0 0 0
Fig.1.3: Explaining global patterns of population ageing by the demographic transition model, year 2012
(In terms of number of countries by per cent of the population aged 65+)
(Source: PRB 2012 World Population Dat Sheet)
5) About 13 countries in Asia followed by 5 in Oceania are also seen to be having low per cent
P65+ and thus belong to the Phase 1 of the demographic transition.
It can be concluded from the above analysis that about half of the countries (91 out of 210) of
different regions in the world are observed to have presently facing the severe aging process by having "per cent of population 65+" as 7 per cent and above by the year 2012. About 63 out of 210
are also seen to have per cent of population 65+ as 4 per cent and above by the year 2012. Thus said the aging process is seen in full swing in the world countries by the year 2012 and reconfirming the statement 'Population aging is fast becoming a global phenomenon' by all
means.
The Role of Fertility, Mortality and Migration in Population Ageing
Fertility and mortality are said to be the main drivers of the population aging. It is believed by most that population ageing is mostly occurring due to an increase in the life expectancy at birth.
However, it is realized that contrary to the above belief population ageing is mainly occurring in many of the countries due to a sustained decline in fertility that leads to relatively fewer children in
the age group 0-14 and a rise in the population of the older age groups (Gavrilov and Heuveline, 2003).
An increase in life expectancy may be looked into two components one that acts against population ageing and the other that acts in favourof population ageing. Mortality declines in infants, children
and people younger than the mean age of the population are observed to act against population ageing as according to Preston et al. (2001) its effect is similar to the effect of increased fertility.
On the other hand, mortality declines that occur among the older age groups, especially of women are observed to act in favour of population ageing. Kinsella and Phillips (2005), however, interestingly, states that "as a nation's infant, childhood, and maternal mortality reach low levels,
longevity gains at older ages become more prominent contributors to increased life expectancy". Population ageing may also be affected sometimes by the migration factor. While immigration of
younger population to an area tends to slow down the population ageing, emigration of the working-age adults is seen to accelerate population ageing.
A Brief Summary of a Critical Review of the Articles on Ageing Process
An exhaustive review of the literature on ageing process is carried out by the present researcher. A
brief overview is presented here as part of the study here, however, without going in detail and without giving the references made due to the limitations of the objectives of the study.
From the above section, without telling further it is realized that there is a great need for the researchers to examine the role of each of the above components namely fertility, mortality and
various factors affecting them of the developing countries" indicates that (1) unfortunately most of the studies concentrates in explaining the aging process at the country level due to lack of sufficient and reliable information on indicators of fertility and mortality at the below national level. (2) However, studies made using micro-level data seem to be very useful in understanding the ageing
process, the limitations of the study in generalizing the findings may be well understood.
SUMMARY AND CONCLUSIONS
An attempt has been made in the present paper at first to present the theory behind the ageing
process in general. Secondly it is attempted to show that the criterion suggested by McCracken and Phillips (2005) is very useful in understanding the ageing process presently taking place in different
populations of the world and its sub-regions and sub-populations. The study comes to the important conclusion that in about 91 countries in the world (out of 210 for which data on P65+ is available for the year 2012 from the PRB World Data Sheet) the aging process is in full swing and about 63
countries are about to face the aging process in the coming future. It may not be a problem of the near future for 56 countries in the world which are in their first phase of the demographic
transition, if one follows the criterion suggested by McCracken and Phillips.
REFERENCES
Davies, A. and A. James, 2011. Geographies of ageing: Social processes and the spatial unevenness of population ageing. England. Ashgate Publishing Limited.
Gavrilov, L. and P. Heuveline, 2003. Aging of population theencyclopedia of population. New York Macmillan Reference.
Haub, C. and J. Gribble, 2011. The world at 7 billion. Population Bulletin, 66(2).
Kinsella, K. and D. Phillips, R. , 2005. Global aging: The challenge of success. Washington DC: Population Reference Bureau.
McCracken, K. and D.R. Phillips, 2005. International demographic transitions. London: Routledge Taylor and Francis Group.
Notestein, F.W., 1945. Population: The long view. Chicago: Chicago University Press. Population Reference Bureau., 2012. 2012 world population data sheet. New York:
Washington DC.
Preston, S., P. Heuveline and M. Guillot, 2001. Demography: Measuring and modeling population processes. Oxford UK: Blackwell Publishers.