The influence of traffic light labels and Choices
logos on healthy food choice
: an eye-
tracking study
iii
T
he influence of traffic light labels
and
Choices
logo
s
on
healthy food choice
: an eye
-
tracking study
A field experiment using mobile eye-tracking
Iris Nicolaas November 2017
University of Twente
Faculty of Behavioural, Management and Social sciences Master Communication Studies
iv
University of Twente
Behavioural Sciences Drienerlolaan 5 7522 NB Enschede
Examination committee
First supervisor: Dr. A. Fenko University of Twente
Second supervisor: Dr. M. Galetzka University of Twente
Graduate
Iris Nicolaas
University of Twente S1235478
viii
Index
Preface v
Abstract vi
1. Introduction 1
1.1 Current research 2
1.2 Prospect 3
2. Theoretical framework 4
2.1 Bottom-up factors 4
2.2 Top-down factors 5
2.3 Visual attention 7
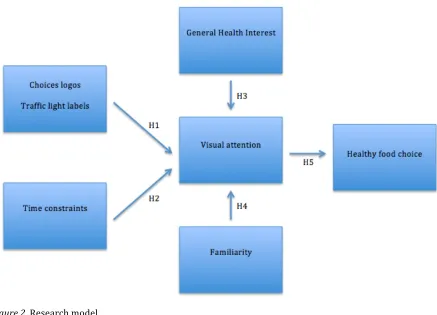
2.4 Research model 8
3. Methods 10
3.1 Research design 10
3.2 Pilot study 10
3.3 Stimuli development 12
3.4 Stimulus material 12
3.5 The fieldwork setting 13
3.6 Participants 13
3.7 Procedure 13
3.8 Measures 14
4. Results 18
4.1 Bottom-up factors 19
4.2 Top-down factors 20
4.3 Visual attention 29
ix
5. Conclusions and discussion 37
5.1 The hypotheses 37
5.2 Discussion 38
5.3 Limitations 40
5.4 Further research 41
5.5 Conclusion 43
6. Recommendations 44
Literature list 46
Appendices I
1. Scheme of the randomization of the stimulus material I 2. Sequences of the stimulus material (from 1 to 12) II
3. Demographics of the participants V
4. Instruction form VI
5. Informed Consent form VII
6. Questionnaire VIII
7. Participant scheme XIII
8. Total fixation duration and fixation count for label/logo
type, brand name and amount of fat XV
2
also barely miss these logos when they are not present on a product (Van Herpen, Hieke & Van Trijp, 2014). Therefore, the Dutch Consumers Association (De Consumentenbond) started a research in 2016. This research demonstrated that the Dutch Choices logos are confusing and misleading, after which Minister Schipper (Public Health) decided to abandon the logospermanently in 2017. As replacement, Minister Schipper wants to develop a mobile application that takes into account the personal needs and constraints of consumers. However, according to De Consumentenbond, such an application is still too difficult to understand and use, thereby advocating for the use of traffic light labels as replacement (De Jong, 2016).
1.1 Current research
Earlier research focused mainly on consumers’ understanding of traffic light labels and Choices logos, consumers’ familiarity with these labels and logos and the influence of visual salience of nutrition labels on visual attention. However, current research is the first research examining the influence of traffic light labels and Choices logos on healthy food choice. Therefore, the following research question will be examined: how do traffic light labels and Choices logos influence healthy food choice in the Netherlands?
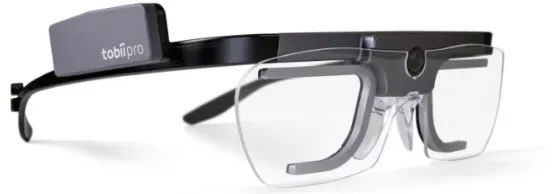
In order to examine this research question, a field experiment using mobile eye-tracking will be conducted. Mobile eye-trackers are able to measure eye movements of participants, causing researchers to know where participants are looking at and how their eyes are moving from one location to the next (Orquin & Loose, 2013). In current research, participants have to choose one pack of yoghurt out of 12 packages. Four of these packages will have a traffic light label, four will have a Choices logo and four will not have a label or logo. By letting participants wear Tobii Pro Glasses 2 (Figure 1) while choosing a pack of yoghurt, current research makes it possible to examine participants’ total fixation duration and fixation count towards traffic light labels and Choices logos. Therefore, current research is a real choice experiment in which real packages of yoghurt will be used.
3
1.2 Prospect
9
11
of the low-fat yoghurt packages. Furthermore, they found the stickers of the Choices logos too big and they proposed to use only the circle of the Choices logo itself as a sticker. Thisimmediately would fix the problem of the contrast between the colour of the stickers and the colour of the packages. They also agreed that the ‘weidemelk’ logo, that was still present on the semi-fat yoghurt packages, should be removed. Two of the three participants agreed that the packages of yoghurt stood too far apart. They proposed to position the packages closer to each other, just like packages of yoghurt in a real supermarket refrigerator. This idea provoked one participant to suggest to use one of the canteens at the university instead of an office room.
The results of this pilot study have lead to a couple of modifications to the stimulus material and fieldwork setting. First, 12 new packages of yoghurt were bought, to apply the proposed changes to the stickers. Second, the circles of the Choices logos were cut out and were used as new stickers. Third, the ‘weidemelk’ logos were covered with stickers having the same colour as the packages so it would not stand out. Fourth, the experimenter contacted the banqueting assistant of the University of Twente to ask whether it was possible to use the refrigerator of one of the canteens at the university as a fieldwork setting. This was possible and resulted in a new fieldwork setting: the refrigerator at the food area of De Waaier. Here, also the packages of yoghurt were positioned closer to each other.
12
3.3 Stimuli development
For this research, the product category of yoghurt was used to measure the influence of traffic light labels and Choices logos on visual attention and subsequently healthy food choice. The product category of yoghurt was chosen because by using yoghurt, many nutritive variations are possible, especially concerning fats, saturated fats and sugar (Grunert, Wills & Fernández-Celemín, 2010). Twelve packages of yoghurt were developed, distinguishing between low-fat (healthy option), semi-fat (less healthy option) and full-fat yoghurt (least healthy option). Each of these three categories contained four of the same packages. However, in the low-fat yoghurt category, two packages got a Choices logo, one got a traffic light label and the other one got no logo. The same applied to the semi-fat yoghurt category. In the full-fat yoghurt category, two packages got a traffic light label and the other two got no logo. This has been deliberately chosen, because Choices logos cannot be attached to packages of full-fat yoghurt since this type of yoghurt does not meet the requirements to receive a Choices logo.
3.4 Stimulus material
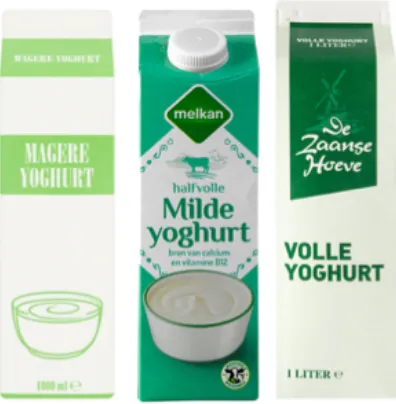
As described above, 12 packages of yoghurt were developed. The three categories and the corresponding packages are shown in Figure 4. According to randomization of the stimulus material (Appendix 1 and Appendix 2), 12 different sequences of the packages were possible. Therefore, every sequence was showed to four participants.
Figure 4. Stimulus material. From left to right: low-fat, semi-fat and full-fat yoghurt.
14
was done, the participants were ready for the eye-tracking experiment and were sent into the food area of De Waaier to choose a pack of yoghurt. After fulfilling this task, they returned to the table where the experimenter waited for them. There, they had to fill in a questionnaire at a laptop (for which Qualtrics was used) about their demographics (gender, age and education), General Health Interest and familiarity with the logos and labels they were presented to while choosing the pack of yoghurt (Appendix 6). This whole procedure took approximately five minutes per participant.Figure 5. One of the participants wearing Tobii Pro Glasses 2 in front of the refrigerator.
3.8 Measures
This section will explain how General Health Interest, familiarity, visual attention and healthy food choice were measured.
3.8.1 General Health Interest
17
3.8.4 Healthy food choiceAfter each eye-tracking session, the experimenter wrote down which pack of yoghurt the participant chose (Appendix 7). By using Tobii Pro Lab, it could be seen whether participants looked at Choices logos and/or traffic light labels, and whether participants had a preference for choosing either a pack of yoghurt with a traffic light label, a Choices logo or no logo on it.
18
4.
Results
The research question in this research is: how do traffic light labels and Choices logos influence healthy food choice in the Netherlands? Paragraph 4.1 will discuss the influence of bottom-up factors (traffic light labels and Choices logos) on visual attention. Then, paragraph 4.2 will provide the results of the influence of top-down factors on visual attention. This paragraph will go deeper into the influence of time constraints (§ 4.2.1), General Health Interest (§ 4.2.2) and familiarity (§ 4.2.3). Then, paragraph 4.3 will discuss visual attention, wherafter paragraph 4.4 follows with the mediation analyses. Here, the mediation analysis for the effect of time
constraints (§ 4.4.1), General Health Interest (§ 4.4.2) and familiarity (§ 4.4.3) will be discussed.
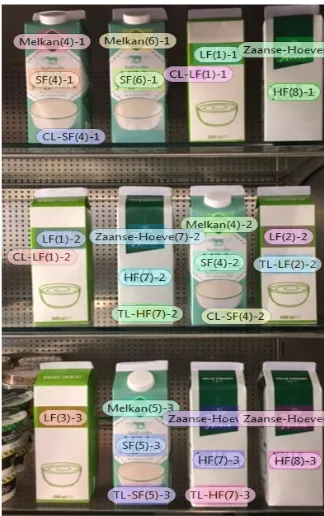
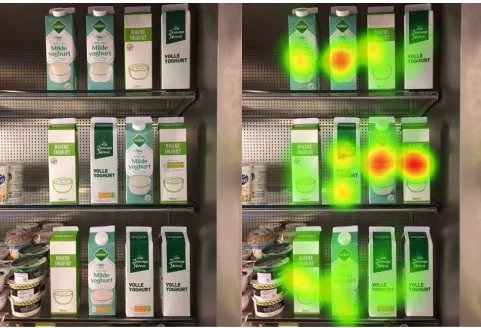
To examine the research question, data gathered from the eye-tracking experiments of 48 participants were analysed. In order to do this, both Tobii Pro Lab and SPSS were used. Tobii Pro Lab analysed the data from the mobile eye-tracker; from the moment participants started to walk to the refrigerator, until the moment they picked up the pack of yoghurt of their choice. By using Areas of Interest (Figure 6 and 7), Tobii Pro Lab was able to determine both total fixation duration and fixation count. Every single pack of yoghurt had one to three AOI’s: one for the traffic light label or Choices logo, one for the amount of fat and one for the brand.
Figure 6. AOI’s per package for one of the 12 Figure 7. LF = low-fat, SF = semi-fat, HF = high-
randomization sequences. fat, CL= Choices logo and TL = traffic light
20
Figure 8. The left side demonstrates the randomization sequence showed to the four participants. The right side demonstrates their (by Tobii Pro Lab created) heat map.
4.2 Top-down factors
4.2.1 The influence of time constraints on visual attention
21
Table 5 Descriptive statistics for total fixation duration in seconds of Choices logos and traffic light labels
Time constraints
Choices logos Traffic light labels Mean SD Mean SD
Yes 0.38 0.43 0.64 0.48
No 0.63 0.51 0.82 0.69
Total 0.50 0.48 0.73 0.60
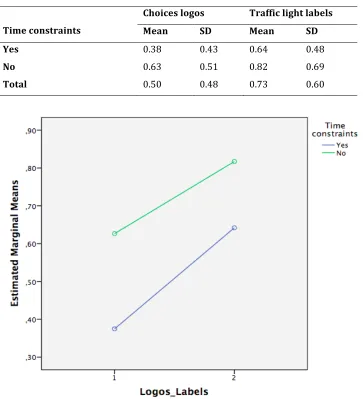
Figure 9. Profile plot of total fixation duration in seconds of Choices logos and traffic light labels against time constraints. Note. Logos_Labels 1 = Choices logos and Logos_Labels 2 = traffic light labels.
There was a significant main effect of logos/labels, F(1, 46) = 5.93, p < 0.05, indicating a significant difference between Choices logos (M = 0.50, SD = 0.48) and traffic light labels (M = 0.73, SD = 0.60). The marginally significant main effect of time constraints yielded an
F-ratio of F(1, 46) = 3.01, p < 0.1, indicating a marginally significant difference between high time constraints (M = 0.51) and low time constraints (M = 0.72). However, no significant interaction effects between logos/labels and time constraints were found, indicating that the effect of logos/labels on visual attention was not different for low and high time constraints and that the effect of time constraints on visual attention was not different for Choices logos and traffic light labels.
22
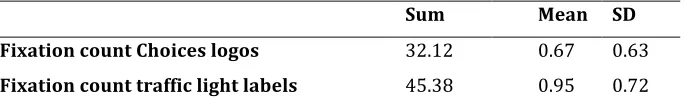
A repeated measures ANOVA (with time constraints as a between-subjects factor and fixation count of traffic light labels and Choices logos as within-subject variables) was conducted to compare the effect of time constraints on visual attention (fixation count) to traffic light labels and Choices logos. As can be seen in Table 6 and Figure 10, participants who were choosing a pack of yoghurt while they were in a hurry, fixated 0.50 times on Choices logos, whileparticipants in the same condition fixated 0.86 times on traffic light labels. However, when participants were not in a hurry, they fixated 0.84 times on Choices logos and 1.03 times on traffic light labels.
Table 6 Descriptive statistics for fixation count of Choices logos and traffic light labels
Time constraints
Choices logos Traffic light labels Mean SD Mean SD
Yes 0.50 0.56 0.86 0.60
No 0.84 0.65 1.03 0.83
Total 0.67 0.63 0.95 0.72
Figure 10. Profile plot of fixation count of Choices logos and traffic light labels against time constraints. Note. Logos_Labels 1 = Choices logos and Logos_Labels 2 = traffic light labels.
24
General Health Interest (Figure 11). The Pairwise Comparisons for the main effect of General Health Interest do not reflect a significant difference (p > 0.1) between low General Health Interest and high General Health Interest. The Pairwise Comparisons for the main effect of time constraints reflect a marginally significant difference (p < 0.1) between low time constraints and high time constraints.Figure 11. Profile plot of the interaction effect between General Health Interest and time constraints (in terms of total fixation duration of Choices logos).
There was no significant main effect of General Health Interest on visual attention (total fixation duration of traffic light labels), F(1, 44) = 0.35, p > 0.1, indicating no significant difference
between low General Health Interest (M = 0.68, SD = 0.51) and high General Health Interest (M = 0.78, SD = 0.68). There was also no significant main effect of time constraints, F(1, 44) = 1.14, p > 0.1, indicating no significant difference between high time constraints (M = 0.64, SD = 0.48) and low time constraints (M = 0.82, SD = 0.69). However, the interaction effect was significant, F(1, 44) = 6.25, p < 0.05. For participants with high General Health Interest, low time constraints led to higher visual attention than high time constraints, F(1, 44) = 6.37, p < 0.05. For participants with low General Health Interest, time constraints had no effect, F(1, 44) = 1.02,
25
Interest and high General Health Interest. The Pairwise Comparisons for the main effect of time constraints also reflect no significant difference (p > 0.1) between low time constraints and high time constraints.Figure 12. Profile plot of the interaction effect between General Health Interest and time constraints (in terms of total fixation duration of traffic light labels).
27
Figure 13. Profile plot of the interaction effect between General Health Interest and time constraints (in terms of fixation count of Choices logos).
There was no significant main effect of General Health Interest on visual attention (fixation count of traffic light labels), F(1, 44) = 0.45, p > 0.1, indicating no significant difference between low General Health Interest (M = 0.88, SD = 0.63) and high General Health Interest (M = 1.01, SD = 0.80). There was also no significant main effect of time constraints, F(1, 44) = 0.73,
p > 0.1, indicating no significant difference between high time constraints (M = 0.86, SD = 0.60) and low time constraints (M = 1.03, SD = 0.83). However, the interaction effect was significant,
F(1, 44) = 4.49, p < 0.05. For participants with high General Health Interest, low time constraints led to higher visual attention than high time constraints, F(1, 44) = 4.41, p < 0.05. For
participants with low General Health Interest, time constraints had no effect, F(1, 44) = 0.80,
28
Figure 14. Profile plot of the interaction effect between General Health Interest and time constraints (in terms of fixation count of traffic light labels).
4.2.3 The influence of familiarity on visual attention
A one-way ANCOVA was conducted to examine the effect of time constraints on visual attention (total fixation duration of Choices logos), controlling for the effect of familiarity with Choices logos. Time constraints did show a marginally significant difference in terms of visual attention
F(1, 45) = 3.53, p < 0.1, after eliminating the effect of familiarity. Familiarity was not a significant covariate F(1, 45) =2.08, p > 0.1.
A one-way ANCOVA was conducted to examine the effect of time constraints on visual attention (total fixation duration of traffic light labels), controlling for the effect of familiarity with traffic light labels. Time constraints did not show significant difference in terms of visual attention
F(1, 45) = 0.94, p > 0.1, after eliminating the effect of familiarity. Familiarity was not a significant covariate F(1, 45) = 0.54, p > 0.1.
32
significant predictor of healthy food choice, b = 0.19, t(45) = 0.85, p > 0.1. A Sobel test wasconducted and found no mediation (z = -0.48, p > 0.1). It was found that visual attention, in terms of fixation count of the traffic light labels, did not mediate the relationship between time constraints and healthy food choice.
Figure 15. Mediation analyses for the effect of time constraints. CL = Choices logos. TLL = traffic light labels.
* = p < 0.1.
4.4.2 Mediation analysis for the effect of General Health Interest
34
Figure 16. Mediation analyses for the effect of General Health Interest. CL = Choices logos. TLL = traffic light labels.
** = p < 0.05.
4.4.3 Mediation analysis for the effect of familiarity
This mediation analysis (Figure 17) has been carried out to examine the mediation of visual attention (total fixation duration of the Choices logos). The regression of familiarity with Choices logos on healthy food choice, ignoring the mediator (visual attention in terms of total fixation duration of the Choices logos), was significant, b = -0.38, t(46) = -2.67, p < 0.05. The regression of familiarity with Choices logos on the mediator, was not significant, b = 0.13, t(46) = 1.40, p > 0.1. The mediator, controlling for familiarity with Choices logos, was not significant, b = -0.06, t(45) = -0.27, p > 0.1. Controlling for the mediator, familiarity with Choices logos was a significant predictor of healthy food choice, b = -0.37, t(45) = -2.53, p < 0.05. A Sobel test was conducted and found no mediation (z = -0.22, p > 0.1). It was found that visual attention, in terms of total fixation duration of the Choices logos, did not mediate the relationship between familiarity with Choices logos and healthy food choice.
This mediation analysis (Figure 17) has been carried out to examine the mediation of visual attention (total fixation duration of the traffic light labels). The regression of familiarity with traffic light labels on healthy food choice, ignoring the mediator (visual attention in terms of total fixation duration of the traffic light labels), was not significant, b = -0.05, t(46) = -0.51,
36
42
packages of yoghurt with all the same opening could be created. As already mentioned inparagraph 5.4, the packages of yoghurt in this experiment have been deliberately chosen. However, it is possible that the different images demonstrated on the packages, have influenced the participants in a certain way. Third, further research could include more participants.
As already mentioned in paragraph 5.4, eye-tracking experiments declare what participants are looking at, but not why they are looking at something. Hereby, the cognitive processes taking place are not clear. Therefore, future research can include additional methods like for example: videos of facial expressions, measures of pupil dilation and verbal protocols.
Current research has strived to contribute to research into traffic light labels and Choices logos, and their influence on visual attention and healthy food choice subsequently. Hereby, the influences of time constraints, General Health Interest and familiarity have been taken into account. Maybe it is interesting for further research to examine for example also the influence of the degree of hunger on visual attention and healthy food choice.
45
mobile eye-tracker is easy to use and this probably also makes them feel confident using the mobile eye-tracker.• The researcher gave further information about the working and functions of the mobile eye-tracker while installing it at the participants’ heads. Maybe further eye-tracking research should not do this, because a lot of participants in this eye-tracking experiment found that they needed to learn a lot of things before they could get going with the mobile eye-tracker.
• Some participants experienced inconsistency in the mobile eye-tracker. This is probably
49
Vyth, E. L., Steenhuis, I. H., Vlot, J. A., Wulp, A., Hogenes, M. G., Looije, D. H., Brug, J., & Seidell, J. C. (2010). Actual use of a front-of-pack nutrition logo in the supermarket: consumers’ motives in food choice. Public health nutrition, 13(11), 1882.I
Appendices
II
V
Appendix 3: Demographics of the participants
Table 11 Demographics of the participants
Participants Gender
Male 22
Female 26
Age
18 – 27 28
28 – 37 8
38 – 47 5
48 – 57 4
58 – 67 3
Education
HAVO (senior general secondary education) 1
VWO (pre-university education) 13
MBO (secondary vocational education) 5
HBO (higher professional education) 16
VI
Appendix 4: Instruction form
Dear participant,
First of all, thank you for participating in this experiment, which is carried out in the context of completing my Master Communication Studies at the University of Twente.
This experiment is an eye-tracking experiment, which makes use of a mobile eye-tracker, and probably you have never worn this before. An eye-tracker is an instrument, recording eye fixations and saccades, whereby the actual viewing behaviour of a participant can be translated into a schematic representation.
After you finished reading this instruction form, and you agreed to participate, you can sign the Informed Consent Form. When this is done, the mobile eye-tracker will be installed at your head and will be calibrated, after which you can go to the food area of ‘De Waaier’ to choose a pack of
yoghurt of your choice.
After you picked one, you can return to the experimenter with the pack of yoghurt you chose. There the mobile eye-tracker will be removed from your head, and you need to fill in a short multiple-choice questionnaire.
The research data will be handled in a confidential manner and the data will be stored and processed anonymously. However, it is possible to withdraw from the research without explanation or justification at any given time.
When you have any remaining questions they can be asked to the experimenter right now. After that, the mobile eye-tracker will be installed at your head, and you can go to the food area of ‘De Waaier’ to choose a pack of yoghurt of your choice.
VII
Appendix 5: Informed Consent Form
Informed Consent for standard research
‘I hereby declare that I have been informed in a manner which is clear to me about the nature and method of the research as described in the aforementioned information brochure ‘XXXX’. My questions have been answered to my satisfaction. I agree of my own free will to participate in this research. I reserve the right to withdraw this consent without the need to give any reason and I am aware that I may withdraw from the experiment at any time. If my research results are to be used in scientific publications or made public in any other manner, then they will be made completely anonymous. My personal data will not be disclosed to third parties without my express permission. If I request further information about the research, now or in the future, I may contact …
If you have any complaints about this research, please direct them to the secretary of the Ethics Committee of the Faculty of Behavioural Sciences at the University of Twente, Drs. L. Kamphuis-Blikman P.O. Box 217, 7500 AE Enschede (NL), telephone: +31 (0)53 489 3399; email:
Signed in duplicate:
. . . . . . Name subject Signature
I have provided explanatory notes about the research. I declare myself willing to answer to the best of my ability any questions which may still arise about the research.’
. . . . . .
VIII
Appendix 6: Questionnaire
Dear participant,
To conclude this experiment, we would like you to fill in a couple of questions. Your responses are completely anonymous.
What is your gender?
O Male O Female
What is your age? Please fill in the numbers.
... Year
What is the highest level of education you have completed?
O VMBO (pre-vocational secondary education) O HAVO (senior general secondary education) O VWO (pre-university education)
O MBO (secondary vocational education) O HBO (higher professional education) O WO (university education)
X
Are you familiar with this type of logo shown on the right? Very unfamiliar Unfamiliar Neutral Familiar Very familiar
O O O O O
Are you familiar with this type of label shown on the right? Very unfamiliar Unfamiliar Neutral Familiar Very familiar
O O O O O
Are you familiar with the pack of yoghurt shown on the right? Very unfamiliar Unfamiliar Neutral Familiar Very familiar
O O O O O
Are you familiar with the pack of yoghurt shown on the right? Very unfamiliar Unfamiliar Neutral Familiar Very familiar
O O O O O
Are you familiar with the pack of yoghurt shown on the right? Very unfamiliar Unfamiliar Neutral Familiar Very familiar
XII
These were all the questions. Thank you very much for your participation.
Are you curious for the results? Then please write down your e-mail address below:
XIV
Participant Date Time Time Constraints Yoghurt package Sequence
33 26 April 16:30 Yes 1 9
34 26 April 16:40 No 8 9
35 26 April 16:45 Yes 4 9
36 1 May 16:15 No 2 9
37 1 May 16:20 Yes 2 10
38 1 May 16:30 Yes 4 10
39 1 May 16:35 No 4 10
40 1 May 16:40 No 2 10
41 1 May 16:45 Yes 8 11
42 2 May 15:00 No 7 11
43 2 May 15:05 Yes 8 11
44 2 May 15:10 No 8 11
45 2 May 15:15 No 5 12
46 2 May 15:20 Yes 5 12
47 2 May 15:45 No 8 12
XV
Appendix 8: Total fixation duration and fixation count for label/logo type, brand
name and amount of fat
Table 13 Total fixation duration and fixation count for traffic light labels, Choices logos, Melkan, Zaanse Hoeve, low-fat, semi-fat and high-fat yoghurt
XVII
Note. After reversing item 2, 4, 6, 8, and 10 a Reliability Analysis has been conducted, which provided a Chronbach’s Alpha of 0.67. However, after deleting item 1, the Chronbach’s Alpha was 0.72. Therefore, item 1 is not included in these results.
Strongly disagree
Disagree Slightly disagree
Neutral Slightly agree
Agree Strongly agree
Mean
I found the eye-tracker very cumbersome (complicated) to use.
1 1 1 7 10 19 9 5.44
I felt very confident using the eye-tracker.
1 1 2 12 14 17 1 4.92
I needed to learn a lot of things before I could get going with this eye-tracker