Introducing a web application for labeling, visualizing speech and correcting
derived speech signals
Raphael Winkelmann, Georg Raess
Institute of Phonetics and Speech ProcessingSchellingstraße 3, 80799 M¨unchen
[email protected], [email protected]
Abstract
The advent of HTML5 has sparked a great increase in interest in the web as a development platform for a variety of different research applications. Due to its ability to easily deploy software to remote clients and the recent development of standardized browser APIs, we argue that the browser has become a good platform to develop a speech labeling tool for. This paper introduces a preliminary version of an open-source client-side web application for labeling speech data, visualizing speech and segmentation information and manually correcting derived speech signals such as formant trajectories. The user interface has been designed to be as user-friendly as possible in order to make the sometimes tedious task of transcribing as easy and efficient as possible. The future integration into the next iteration of the EMU speech database management system and its general architecture will also be outlined, as the work presented here is only one of several components contributing to the future system.
Keywords:EMU, web application, labeling
1.
Introduction
In recent years, user-friendly systems for automatically generating aligned phonetic transcriptions given a speech signal and an orthographic transcription have emerged (Re-ichel, 2012; Kisler et al., 2012; Schiel, 1999). A further well established method in the research community is the usage of detection algorithms for derived speech signals, such as formant trajectories, to make manual formant trac-ing or other forms of manual feature extraction redundant. Although these procedures can achieve very usable results, they still struggle to match the precision of a manual tran-scription or a manually corrected derived signal (Schiel et al., 2011). However, certain phonetic research requires this manual precision. Although preexisting tools such as Praat (Boersma and Weenink, 2013) and ELAN (Wittenburg et al., 2006) have the ability to achieve these tasks for most labeling needs, they lack the ability to easily integrate the output of external algorithms and other data, such as artic-ulator movement contours produced by electromagnetic ar-ticulography (EMA) recordings, into their interfaces. How-ever, such integration of external algorithms and other sup-plementary data is often necessary to provide a visual aid or for correction purposes.
The current EMU speech database management system (Cassidy and Harrington, 1996; Cassidy and Harrington, 2001) achieves this by being able to read, display and manipulate any time-discrete signal contours that can be converted into the simple signal file format (SSFF) (Cas-sidy, 2013). Unfortunately due to several maintainability and other issues of the current EMU DB system, we have made the decision to reimplement the system almost from scratch. In doing so we are trying to keep most of the con-cepts of the current system in place while improving on things like usability, maintainability, scalability, stability, speed and more.
The tool presented here is one of several components com-prising the next iteration of EMU (see Section 5. for an
overview of all the components). Here we introduce the EMU-webApp, which is a browser-based labeling and cor-rection tool that offers simple mechanisms for integrating externally produced transcripts and derived signal files such as formant trajectories much like the current EMU DB sys-tem.
2.
The browser as the graphical user
interface
Two of the initial key requirements for writing a graphi-cal user interface (GUI) for the next iteration of the EMU speech database management system were to write an in-terface that is cross-platform and as easy as possible for the user to install. Due to dependency issues, installation is unfortunately an issue in the current EMU DB system. The classical approach to building cross-platform GUIs is either using a cross-platform widget toolkit or implementing mul-tiple versions of the same GUI to accommodate the differ-ent platforms. The browser offers a unified solution to this problem that fits the write-once-run-everywhere paradigm better than most alternatives. Today most machines, in-cluding mobile devices such as smart-phones and tablets, already have the appropriate runtime for a web application installed. If such a browser is available to the user, the in-stallation process is as simple as pointing the browser to a specific URL.
Not long ago, browsers did not have the features needed for the implementation of our tool natively available. Only recently have modern browsers gained the ability to imple-ment a full client-side impleimple-mentation of a speech labeling tool. This is due to the development and standardization of several new browser APIs as part of the HTML5 specifica-tion.
2.1.
Connection
A large benefit gained by choosing the browser as the user interface is the ability to easily interact with a backend server or other servers using standard web protocols, such as http/https or websockets. Using these standard proto-cols data can easily be shared between the backend and the client. As simple static web servers can easily be imple-mented in a multitude of programming languages, hosting a private version of the client is fairly simple. If the user does not wish to host her/his own version of the interface, a live public version of the interface is available on the world wide web1.
For the communication with a backend server we have developed a simple communication protocol (see Section 4.2.) that can easily be implemented in various server-side programming languages. Once a connection is established the backend provides the interface with data that adheres to the data interfaces provided by our tool (see Section 4.1.). However, the web application can also be used in stand-alone mode, without the need for a backend (see section 3.3.)
We are currently working on a client-side websocket server implementation that will run within the R Project for Statis-tical Computing (R Development Core Team, 2011). This will allow the user to serve local data to the web application by running a local server that implements the communica-tion protocol (see Seccommunica-tion 5.).
3.
The interface
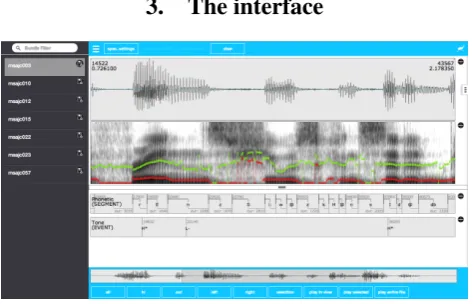
Figure 1: EMU-webApp displaying a bundle from theae corpus
The general layout of the interface (see Figure 1) consists of two menu bars (top and bottom) containing buttons for frequent commands, such as opening and saving files, necting to a backend server and the audio and zoom con-trols. However, users are advised to familiarize themselves with the keyboard shortcuts to control and navigate the in-terface, as there are certain features that can only be ac-cessed using these. A list of the key commands can be found in theAboutdialog. This dialog can be accessed by clicking on the application icon, which is located on the right hand side of the top menu bar.
The signal tracks are displayed beneath the top menu bar. Although the order of the tracks can be altered by changing
1http://ips-lmu.github.io/EMU-webApp/
the order in a configuration file, the default is to visualize the oscillogram and spectrogram one on top of the other. Due to a flexible configuration approach it is also possi-ble to display further tracks such as fundamental frequency contours either as overlays on the spectrogram/oscillogram or on separate canvases. All of the tracks can be resized as a propotion of window space using the split screen slider. The time-aligned levels of the currently loaded annotation file(s) are displayed below the split screen slider.
To the left of the interface is a hideable side menu to display the current bundles offered by the backend and to the right a further menu to switch between different pre-configurable views of the data.
3.1.
Labeling work-flow
To ease labeling as much as possible, a lot of attention has been given to implementing features often requested by ex-perienced labelers. One much requested feature is the in-tegration of an overview of the entire signal to improve the navigation within a signal. This feature is integrated into the bottom menu bar in the form of a scrollable mini-map of the oscillogram (see Figure 1). Others features (most available via keyboard shortcuts) include:
• snap selected boundary to nearest bottom boundary
• snap selected boundary to nearest top boundary
• select/move multiple segments
• add/delete time to start/end of (multiple) segments
• unlimited undos/redos of edits
• zooming while holding a boundary in specific position
• multiple views of the data (via the configuration of perspectives)
To further aid the user the interface allows her/him to fully pre-configure the keyboard shortcuts. Most of the default keyboard shortcuts are centered around theW-A-S-Dkeys which represent the navigation shortcuts.
To select a certain boundary the user hovers the mouse cur-sor over a level. By doing so the curcur-sor position is automat-ically tracked and the nearest boundary in the current level is calculated and automatically preselected and marked. If the user wishes to move the boundary, she/he holds down the shift key on the keyboard to select and move the bound-ary to the desired position without the need for left-clicking the mouse. The same is possible for segments, although these are explicitly selected by clicking on the according segment and moved by holding down the alt key. To change the label of any given segment or event boundary, the user simply double clicks the desired item. Generating new seg-ment boundaries can be achieved using the Return key. A comprehensive list of all the features can be found in the
Aboutdialog.
3.2.
Visualizing and correcting data
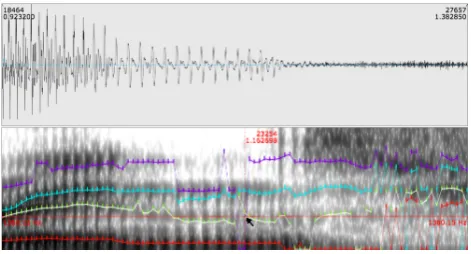
also to correct pre-calculated formant tracks. After load-ing the files that are to be corrected, these can be displayed as a frequency-aligned overlay over the spectrogram, an overlay over the oscillogram or in a separate signal canvas. The frequency-aligned spectrogram overlay is the obvious choice for correcting formant contours (see Figure 2).
Figure 2: second formant being corrected using the formant correction tool
Before beginning the formant correction process, the cor-responding correction tool is chosen by pressing the1key to alter the first formant, the2key to alter the second and so on. Once the desired tool has been chosen, the contours can be manually redrawn by grabbing the relevant samples using the shift key and moving the mouse to the desired position.
This feature is almost completely analog to correction pos-sibilities in the current EMU speech database management system. However, the correction work-flow is improved by providing the user with unlimited undo/redo functionality. This enables the labeler to toggle between all the various changes made to the formant contours.
3.3.
Modes of usage
The EMU-webApp can be used in two different modes de-pending on the intended scenario. The first is the stand-alone mode, the other the client mode (in a client-server environment).
The stand-alone mode is meant as an ad-hoc solution when small changes to a corpus/file collection have to be made. Used in this way, the application can be used in a fairly similar fashion to the labeler offered by Praat (Boersma and Weenink, 2013). However, it has the ability to dis-play externally-computed derived signals (e.g. by the libassplibrary (Scheffers and Bombien, 2012)) as well as other time parallel contours that where acquired during the recording (e.g. EMA tongue contours). In this mode, the labeler uses the aforementioned file API to handle the file loading. Unfortunately, there is no browser API for writing data back to the user’s hard drive. For security rea-sons, browsers do not allow web applications to touch the hard drive outside of a so-called sandbox. This means that altered files are offered as a download to the user if she/he wants to save the changes to disc. In future version we plan for this to be done by dragging and dropping the respective file to the place the user wishes to save the file.
The more flexible of the two modes is the client mode. By being integrated into a client-server environment the
inter-face can delegate several tasks to the server. The server can then take care of such things as file/database handling, sig-nal processing and user management on datasets, to name a few. This means that the labeler can be integrated into many different setups and adapted to the requirements of the given scenario.
4.
Implementation
As per the definition of a web application, the interface is written entirely in HTML, Javascript and CSS2. This en-ables the complete labeling functionality to be accessed on-line as well as offon-line in a browser. The offon-line functionality of the EMU-webApp is achieved by using the HTML5 ap-plication cache browser API (W3C, 2013b). To ease testing and to enable easy integration and extendability we chose to use the AngularJS Javascript framework (Google, 2014).
4.1.
Files and data model
Although subject to change, a short overview of the data model and the file reading capabilities are presented here. The internal label data model is represented as a simple Javascript object whose corresponding Javascript object no-tation (JSON) can be seen in Listing 1. We chose to use samples to represent our label boundary times, which is also reflected by the interface design, to avoid confusion caused by fractional digit precision and to have definite sample-segment affiliations.
In future releases, thelinksarray in the JSON representa-tion in Listing 1 will be used to represent hierarchical anno-tation structures known from the current EMU DB system (see Section 5.).
Listing 1: label representation
{
"name": "msajc003",
"annotates": "path/to/msajc003.wav", "sampleRate": 20000,
"levels": [{
"name": "Phonetic", "type": "SEGMENT", "items": [{
"id": 1, "label": "V",
"sampleStart": 3750, "sampleDur": 1390 }, ...
]}, ...], "links" : [{
"fromID" : 1, "toID" : 102 },
...]
}
For the web application to be able to convert existing label files to the format depicted in its stand-alone mode, sev-eral transcription file parsers are available. This includes
a parser for the labeling format used by the EMU DB sys-tem (ESPS/waves+ label format) and a Praat TextGrid file parser. The above JSON representation can of course also be parsed directly.
The same holds true for the signal format. A Javascript parser is available to convert the simple signal file format, used by the current EMU and thelibassplibrary, to the internal Javascript object (see Listing 2 for its JSON repre-sentation). The SSFF file format, upon which our internal representation is based, has proven itself to be a very flexi-ble file format: flexiflexi-ble enough to represent anything from formant values (fm) and their bandwidths (bm), as in List-ing 2, to EMA contours and entire spectrograms.
Listing 2: signal format representation
{
"ssffTrackName": "FORMANTS", "sampleRate" = 200,
"origFreq" = 20000, "startTime" = 0.0025, "columns" = [
{"name": "fm", "length": 4,
"ssffDataType": "SHORT"
"values" : [[0, 1042, 2072, 3170],
[0, 1260, 2122, 3118],
[0, 1339, 2293, 3258], ...]},
{"name": "bw", "length": 4,
"ssffDataType": "SHORT"
"values" : [[0, 886, 371, 890],
[0, 724, 567, 826],
[0, 410, 664, 740], ...]}
]
}
The EMU-webApp can also convert the above-mentioned label file format to either the Praat TextGrid or the ESP-S/waves+ label format and offer them to the user as down-loadable files. For the user this means she/he can use the labeler in stand-alone mode to do ad-hoc labeling of Praat TextGrid files, the ESPS/waves+ label format and the new JSON label format shown in Listing 1.
Due to restrictions concerning the decoding flexibility of the popular web audio API (W3C, 2013c), which always decodes files to the system’s default sample rate, we have made the decision to implement our own.wavfile decoder. This means that the EMU-webApp can currently only read uncompressed mono.wav files. Further decoders might be added in future releases.
4.2.
Communication protocol
To standardize the communication between the client and server we have developed a simple request-response com-munication protocol. This protocol defines a set of JSON objects for both the requests and responses. The defined request-response actions, most of them triggered by the client after connection, are:
• GETPROTOCOL: Check if the server speaks the same protocol
• GETDOUSERMANAGEMENT: See if the server handles user management (if yes→this prompts a login dialog →LOGONUSER)
• GETGLOBALDBCONFIG: Request the configuration file for the current connection
• GETBUNDLELIST: Request the list of available bun-dles for current connection
• GETBUNDLE: Request data belonging to a specific bundle name
• SAVEBUNDLE: Save data belonging to a specific bun-dle name
Due to the inability to perform cross-domain request, via regular http/https, the web application currently uses the websocket protocol to allow the EMU-webApp to connect to any websocket servers that implement the above pro-tocol. In future versions we also hope to include cross-origin resource sharing (CORS) (W3C, 2014) support into the client. This will enable regular http/https servers that implement the protocol and have CORS enabled to com-municate with the EMU-webApp.
5.
Future work
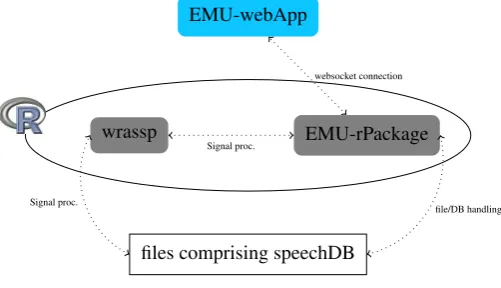
As mentioned, this interface will be part of a larger software suite aiming to be the next iteration of the EMU speech database management system. This new software suite will enable the user to have a self-contained system on her/his machine without having to rely on network connectivity. A simplified overview of the future system architecture can be seen in Figure 3.
EMU-webApp
wrassp EMU-rPackage
files comprising speechDB
Signal proc.
file/DB handling websocket connection
Signal proc.
Figure 3: future system architecture
serve as a local websocket server to communicate with the interface presented in this paper. This infrastructure will provide researchers with a self-contained system to query databases, perform signal processing and statistical evalua-tions all within the same environment. Being autonomous, however,wrasspand the web application will also be able to be used separately if desired.
The tool presented here is still in the early stages of devel-opment. One of the key and most powerful features of the current EMU DB system is the ability to annotate and query hierarchical annotation structures. Although our annotation format (see section 4.1.) allows items to be linked, the in-terface is not yet able to display and edit these hierarchical structures. In future releases we hope to accomplish this task.
Further future efforts will include improving the stability, extending the parsing/file-handling capabilities, optimizing the EMU-webApp for mobile devices and more.
6.
Acknowledgements
Research supported by the European Research Council Grant (295573) to Jonathan Harrington and the CLARIN-D project (BMBF-FKZ: 01UG1120A).
7.
References
Paul Boersma and David Weenink. 2013. Praat: do-ing phonetics by computer (Version 5.3.56)[Computer program]. Retrieved October 9, 2013. http://www. fon.hum.uva.nl/praat/.
Steve Cassidy and Jonathan Harrington. 1996. Emu: An enhanced hierarchical speech data management system.
In Proceedings of the Sixth Australian International
Conference on Speech Science and Technology, pages
361–366.
Steve Cassidy and Jonathan Harrington. 2001. Multi-level annotation in the emu speech database management
sys-tem. Speech Communication, 33(1):61–77.
Steve Cassidy. 2013. The Emu Speech Database Sys-tem Manual: Chapter 9. Simple Signal File For-mat. http://emu.sourceforge.net/manual/ chap.ssff.html.
Google. 2014. AngularJS. http://angularjs. org/.
Thomas Kisler, Florian Schiel, and Han Sloetjes. 2012. Signal processing via web services: the use case Web-MAUS. InProceedings Digital Humanities 2012,
Ham-burg, Germany, pages 30–34, Hamburg.
R Development Core Team, 2011.R: A Language and
En-vironment for Statistical Computing. R Foundation for
Statistical Computing, Vienna, Austria. ISBN 3-900051-07-0.
Uwe D. Reichel. 2012. PermA and Balloon: Tools for string alignment and text processing. In Proc.
Inter-speech, page paper no. 346, Portland, Oregon.
Michel Scheffers and Lasse Bombien. 2012. libassp ad-vanced speech signal processor, 03.
Florian Schiel, Christoph Draxler, and Jonathan Harring-ton. 2011. Phonemic Segmentation and Labelling using the MAUS Technique. InProceedings of the Workshop
’New Tools and Methods for Very-Large-Scale Phonetics
Research’, University of Pennsylvania, USA.
Florian Schiel. 1999. Automatic Phonetic Transcription of Non-Prompted Speech. InProc. of the ICPhS, pages 607–610, San Francisco, August.
W3C. 2013a. File API. http://www.w3.org/TR/ FileAPI/.
W3C. 2013b. Offline apps. http://www.w3.org/ TR/2011/WD-html5-20110525/offline. html.
W3C. 2013c. Web Audio API. https://dvcs.w3. org/hg/audio/raw-file/tip/webaudio/ specification.html.
W3C. 2013d. Workers. http://www.w3.org/TR/ workers/.
W3C. 2014. Cross-Origin Resource Sharing. http:// www.w3.org/TR/cors/.
Peter Wittenburg, Hennie Brugman, Albert Russel, Alex Klassmann, and Han Sloetjes. 2006. Elan: a profes-sional framework for multimodality research. In