Texture Classification based on Edge Descriptor texton
Co-occurrence Matrix
Rasigiri Venkata Lakshmi*1, Dr. Patnala S. R. Chandra Murty2, Dr. U. Ravi Babu3
*1 Research Scholar, Department of CSE, ANU, Guntur, Andhra Pradesh, India
2
Ass.Professor, Department of CSE, ANU, Guntur, Andhra Pradesh, India
3
Research Supervisor, Department of CSE, ANU, Guntur, Andhra Pradesh, India
ABSTRACT
Texture classification is of great importance for image processing and pattern recognition. It has acknowledged a significant amount of attention over the last few decades as it creates the basis of most pattern recognition methods. The object of texture categorization is to match a query image with a allusion image or cluster such that the query has the same illustration texture as the allusion. In this manuscript, we proposed a new descriptor called EDTU for stone texture classification. The image edge information was extracts from texture images using ED. Independent charge of the skylight size, ED is a tiny 8-bit binary number, so it is suitable for real-time applications. Further, the combination of texton unit and ED called EDTU is proposed. In the present study considered seven statistical features based on EDTU matrix. The efficiency of the projected method is tested on two different texture datasets thereby significantly improving the performance in terms of stone texture classification.
Keywords: Edge Descriptors, Texture Analysis, Feature Fusion, Texture Matrix.
I.
INTRODUCTIONTexture is a significant spatial characteristic, useful for classifying objects. Statistical procedures have broadly studied in the texture classification and analysis. The most popular structural methods are Texture edges (TE) and texton theory approach. The present chapter combined the features of Edge Descriptor (ED) and Texton Unit (TU) and derived a novel matrix called EDTU, it is for texture classification. In the proposed method, seven features are extracted from EDTU. This approach is processing extremely simple. We have conducted two experiments on five challenging texture databases (Brodatz, Vistex, CUReT, Mayang, and Paulbourke. The investigational outcome indicates the derived method classification performance is better than the other methods.
The rest of the paper is prepared as follows. In section 2, proposed methodology is described and results of standard classification and derived user defined algorithm are explained in section 3. In section 4 conclusions are given.
II.
EDGE DESCRIPTOR TEXTON UNITdiscriminate between dissimilar stone textures. ED aims to be additional robust and speed for texture analysis, furthermore, our approach is to select texton unit, they are primary rotation-invariant features of local image texture and their features is verified to be a very powerful texture features. The cost of the derived method is established on five stone texture databases in two datasets. The derived method is proved to be an outstanding rotation invariant stone texture classification. This paper presents a new descriptor, Edge Descriptor (ED), for texture analysis. ED proposes texture and edge data in order to provide. ED is a local descriptor because it is clear over a applications like fabric identification, stone texture classification. In this approach, texture characteristic assigned to a pixel, is narrow characteristic which prefer its nearby pixels. The general version of LBP is as follows. nearby pixel as revealed in Figure 1 [12].
Figure 1. (a) A 3×3 nearby pixel of gc b) intensity cost
(c) binary number assigned to Pc; start from top left
pixel anti-clockwise. 2.2 Edge description
The neighborhood of Pc for processing TED is well
thought-out in such a way that it includes not only texture data but also vertical edge data. The idea proposed in [24], mull over a single-dimensional local binary model in the x-direction LBPxi , as shown in Fig. 2.
Figure 2. 1-D local binary pattern in the x-direction, LBPxi , for dissimilar nearby pixel size 3, 5 and 7
It can be provide that Pc is an best vertical edge,
LBPxi(Pc) for i = 3, 5, 7 forever returns 2-bit binary
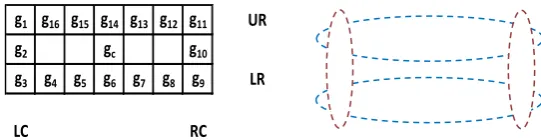
numbers 10 or 01. But outcome of LBPxi (Pc) on the vertical edges of stone textures that can be add to in the nearby pixel in x-direction, outcome in additional weight on the significant strength variations and low sensitivity to the different tiny-scale. As an outcome, extra pixels within E are measured as vertical edge. we use a horizontal rectangular neighborhood as exposed in Figure 3. Where gc is the pixel value and gn,
n = 1, 2m . . ., 16. The nearby pixels separated into four regions. They are Upper Row (UR), Lower Row (LR), Right Column (RC), and Left Column, (LC). The information provided in following diagram.
Figure 3. UR, LR, RC and LC regions in a 3×7 rectangular neighborhood.
2.3 ED Code Generations
The major drawback of LBP on rectangular nearby pixel is complexity that adds exponentially with the extra bits, P. A rectangular nearby pixel of size w×l, the total number of nearby pixels is P = 2(w+l) - 4. For
these developments in a 3×7 nearby pixel, LBP returns a 16-bit binary number as display in Figure 4. In this paper an eminent descriptor called ED presented in Figure 5. ED is an 8-bit binary code clear on binary depiction of LBP.
Figure 4. (a) Intensity cost of a sample 3×7 nearby pixels (b) The binary number assigned to Pc; starting from top left pixel anticlockwise.
Figure 5. 8-bit Edge Binary Code (ED code)
The rectangular nearby pixel where ED is processed UR1s and URT. The last bits of ED to describing texture of Pc.
Where RCT and LCT transformations between 0 and 1 in the right column, RC, and left column, LC. The major benefit of ED is always eight bits self-governing of the ED. These bits contain implicitly texture and edge data. We reveal the efficiency of ED for stone texture analysis in a texton unit method in the next section.
2.4 Texton unit approach
The ED code method is applied to the input image with size 256×256, resultant 85×36 ED matrix is generated, this matrix contains the edge information but it is not enough for precise stone texture classification. To achieve precise stone texture classification, texton theory [25] is applied to the ED matrix.
The idea of texton was derived in [25] 20 years ago, and it is an awfully tool in texture analysis. The textons are clarified as a set of blobs or developing patterns distribution is a general property all over the image. A tiny element length, such as 2×2 block is used as textons for generating the texton unit matrix as present
in Fig. 6 Denote every value in 2×2 block as V1, V2, V3
Figure 7: 2×2 texton unit matrix
The following procedure is applied for generating texton unit matrix
For each 2×2 block do the following procedure
Step 1: Calculate the average of V1, V2, V3 and V4 of 2×2
block of ED matrix
Step 2: if average greater than or equal to Vi for i=1, 2,
3, and 4, value is 1 otherwise values zero and is generated 2×2 temp matrix
Step 3: Multiply every element with matrix shown in Fig. 6.7, and 2×2 matrix is stored in TEDTU
III.
RESULTS AND DISCUSSIONSIn this research work, two dissimilar datasets of size 256×256 used for investigation. Dataset-1 consist of 80 stone surface images earned from VisTex, Brodatz textures, Mayang and every surface image is partition into sixteen 64×64, and four 128×128 non-extending image zones. Due to this, a total of 1600 (i.e., 80×20) image regions will be placed in the prescribed database. 240 stone contains texture images obtained from CUReT database (Dataset-2), Paulbourke and also from natural assets from digital camera; all texture image is fragmented into sixteen 64×64 and four 128×128 non-overlapping image regions.
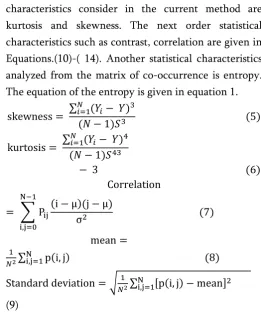
The characteristic vector of first and second order arithmetical features are analysed from the EDTU. Feature vector F1 include the first order statistical
characteristics consider in the current method are kurtosis and skewness. The next order statistical characteristics such as contrast, correlation are given in Equations.(10)-( 14). Another statistical characteristics analyzed from the matrix of co-occurrence is entropy. The equation of the entropy is given in equation 1.
∑ ( )
where Pij is the texton unit value in position (i,j) of the
texton unit image, N is the number of texton unit values in the texton unit, µ is ∑ mean of
the texton unit and ∑ ( ) variance of
the texton unit.
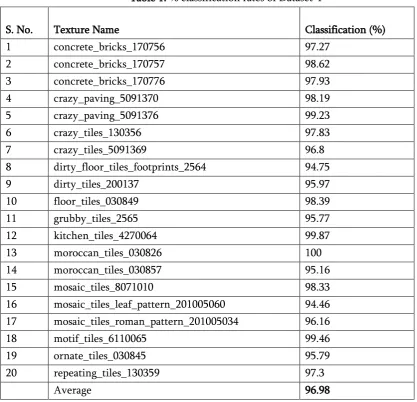
Table 1. % classification rates of Dataset-1
S. No. Texture Name Classification (%) 1 concrete_bricks_170756 97.27
2 concrete_bricks_170757 98.62 3 concrete_bricks_170776 97.93 4 crazy_paving_5091370 98.19 5 crazy_paving_5091376 99.23 6 crazy_tiles_130356 97.83 7 crazy_tiles_5091369 96.8 8 dirty_floor_tiles_footprints_2564 94.75 9 dirty_tiles_200137 95.97 10 floor_tiles_030849 98.39 11 grubby_tiles_2565 95.77 12 kitchen_tiles_4270064 99.87 13 moroccan_tiles_030826 100 14 moroccan_tiles_030857 95.16 15 mosaic_tiles_8071010 98.33 16 mosaic_tiles_leaf_pattern_201005060 94.46 17 mosaic_tiles_roman_pattern_201005034 96.16 18 motif_tiles_6110065 99.46 19 ornate_tiles_030845 95.79 20 repeating_tiles_130359 97.3
Average 96.98
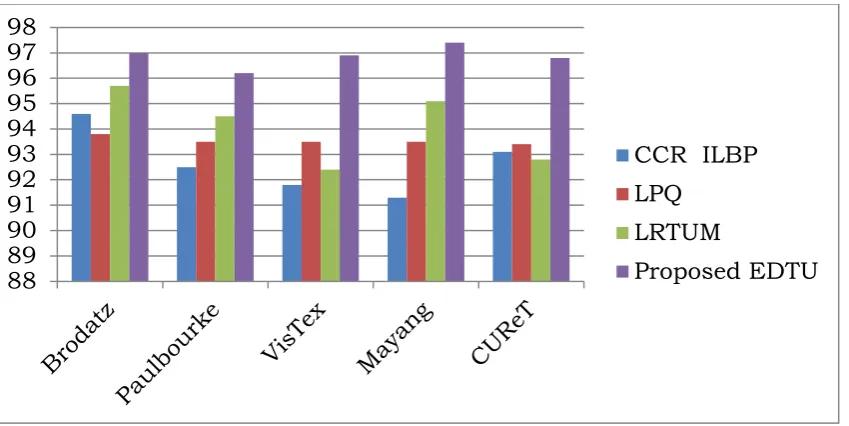
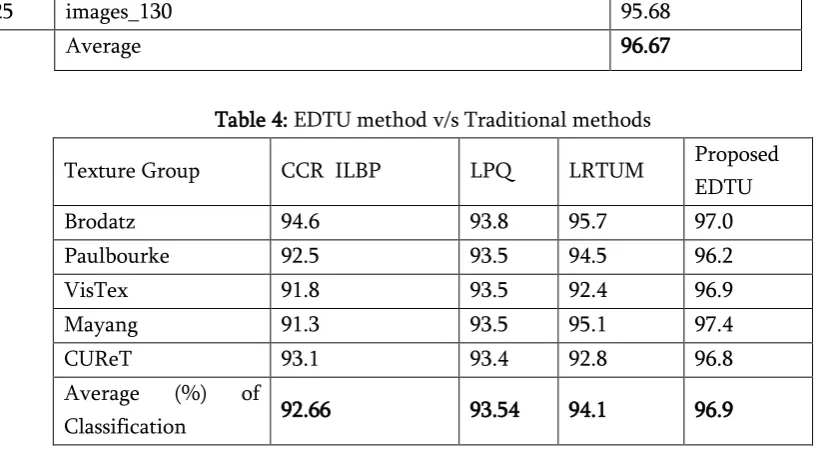
Comparison with Proposed EDTU Method with Existing Methods
The proposed EDTU Method is compared with the recent classification methods CCR and ILBP [26], LQP [27] and LRTUM [28]. Table 3 shows the mean
Figure 9. Comparative analysis of proposed TEDTU method with existing methods Table 2. % classification rates of Dataset-2
S. No Texture Name % Classification
1 brick_tiles_1262639 95.64 2 ceramic_tiles_5091358 97.15 3 circular_tiles_6280660 94.72 4 clean_tiles_231067 98.17 5 concrete_250902 98.03 6 concrete_paving_170805 96.83 7 concrete_tiles_7040216 95.5 8 concrete_tiles_7040218 96.98 9 cracked_tiles_9280147 96.16 10 crack ed_tiles_9280148 93.96 11 crazy_paving_4142298 94.42 12 crazy_paving_5091370 93.55 13 dirty_floor_tiles_footprints_2564 96.34 14 dirty_tiles_200137 94.84 15 fine_square_tiles_4142311 97.12 16 floor_tiles_030849 96.62 17 flower_tiles_7040220 95.9 18 grubby_tiles_2565 99.44
19 images_015 97.41
20 images_031 97.11
21 images_052 95.88
22 , images_059 94.46
23 images_062 94.54
88
89
90
91
92
93
94
95
96
97
98
CCR ILBP
LPQ
LRTUM
25 images_130 95.68
Average 96.67
Table 4: EDTU method v/s Traditional methods
Texture Group CCR ILBP LPQ LRTUM Proposed edge information was extracts from texture images using ED. ED was evaluated over a rectangular casement. Independent of the skylight size, ED is a small 8-bit binary number, so it is suitable for real-time applications. Further, the combination of texton unit and ED called EDTU is proposed. The present chapter considered seven statistical features based on EDTU matrix.. The efficiency of the projected method is proved on two different texture datasets thereby considerably improving the performance in terms of stone texture classification
V.
REFERENCES1. Schwartz, W. and Pedrini, H., "Textured Image Segmentation Based on Spatial Dependence Using a Markov Random Field Model", IEEE International Conference on Image Processing, 2449-2452, 2006.
2. Haralick, R. M., "Statistical and Structural Approaches to Texture," Proceedings of the IEEE
3. Reed, T. and Dubuf, J. M. H., "A Review of Recent Texture Segmentation and Feature Extraction Techniques," CVGIP: Image Understanding 57, 359-372, and 1993.
4. Xu, Y., Huang, S. B., and Ji, H., "Integrating Local Feature and Global Statistics for Texture Analysis", 16th IEEE International Conference on Image Processing, 1377 -1380 2009.
5. Tamura, H., S, M., and Yamawaki, Y., "Textural Features Corresponding to Visual Precepetion", IEEE Transactions on Systems, Man, and Cybernetics 8, 237-247, 1978.
6. Lasmar, N.-E., Stitou, Y., and Berthoumieu, Y., "Multiscale Skewed Heavy Tailed Model for Texture Analysis", 16th IEEE International Conference on Image Processing, 2281 -2284, 2009.
7. Tao, Z., Wenxue, H., and Jinjia, W., "A Novel Texture Analysis Method Based on Graph Spectral Theory", Fifth International Conference on Intelligent Information Hiding and Multimedia Signal Processing, 467 -470, 2009. 8. Tuceryan, M. and Jain, A. K., "Texture Analysis,
9. Haralick, R. M., Shanmugam, K., and Dinstein, I., "Textural Features for Image Classification", IEEE Transactions on Systems, Man and Cybernetics 3, 610-621, 1973.
10. Galloway, M. M., "Texture Analysis Using Gray Level Run Lengths," Computer Graphics and Image Processing 4, 172-179, 1975.
11. Daubechies, I., CBMS-NSF Regional Conference Series in Applied Mathematics, Society for Industrial and Applied Mathematics, Philadelphia, PA, USA, 1992.
12. Mallat, S. G., "A Theory for Multiresolution Signal Decomposition: The Wavelet Representation", IEEE Transactions on Pattern Analysis and Machine Intelligence 11, 674-693, 1989.
13. Unser, M., "Texture Classification and Segmentation using Wavelet Frames", IEEE Transactions on Image Processing 4, 1549 - 1560, 1995.
14. Daugman, J. G., "Uncertainty Relation for Resolution in Space, Spatial Frequency, and Orientation Optimized by Two-Dimensional Visual Cortical Filters", Journal of the Optical Society of America A 2, 1160-1169, 1985.
15. He, D. C. and Wang, L., "Texture Unit, Texture Spectrum, and Texture Analysis," IEEE Transactions on Geoscience and Remote Sensing", pp: 509-512, 1990.