DOI: 10.1534/genetics.105.046672
Multilocus Sequence Typing Reveals Three Genetic Subpopulations of
Cryptococcus neoformans
var.
grubii
(Serotype A), Including a Unique
Population in Botswana
Anastasia P. Litvintseva,*
,1Rameshwari Thakur,
†Rytas Vilgalys
‡and Thomas G. Mitchell*
*Department of Molecular Genetics and Microbiology, Duke University Medical Center, Durham, North Carolina 27710, ‡Department of Biology, Duke University, Durham, North Carolina 27710 and†National Health Laboratory,
Ministry of Health, Gaborone, Botswana Manuscript received June 8, 2005 Accepted for publication November 2, 2005
ABSTRACT
We applied multilocus sequence typing (MLST) to investigate the population structure and mode of re-production of Cryptococcus neoformans var. grubii (serotype A). This MLST system utilizes 12 unlinked polymorphic loci, which are dispersed on nine different chromosomes, and allows the unambiguous iden-tification of closely related strains of serotype A. We compared MLST analyses with the conventional genotyping method of detecting amplified fragment length polymorphisms (AFLPs), and there was ex-cellent correlation between the MLST and AFLP results. However, MLST differentiated a larger number of strains. We analyzed a global collection of isolates of serotype A using both methods, and the results iden-tified at least three genetically distinct subpopulations, designated groups VNI, VNII, and VNB. Groups VNI and VNII are widespread, dominated by isolates with theMATamating type, and predominantly clonal. Conversely, isolates of group VNB are unique to Botswana, include a significant proportion of fertile strains with theMATamating type, and manifest compelling evidence of recombination. We have AFLP genotyped
.1000 strains of serotype A from different parts of the world, including isolates from several African countries, and, to date, haploid serotype A isolates of group VNB have been found only in Botswana.
C
RYPTOCOCCUS neoformans is a pathogenic yeastthat causes debilitating disease of the central ner-vous system and other organs in humans. Cryptococ-cosis is especially prevalent in persons with impaired cell-mediated immunity, such as patients with AIDS, transplants, or hematologic malignancies (Casadevall and Perfect 1998). C. neoformans normally resides in the environment, where it is most commonly associated with avian guano and vegetative debris. Infection is acquired by inhalation; however, neither the natural reservoir nor the nature of the infectious particles has been resolved (Casadevall and Perfect 1998). On the basis of differences in capsular epitopes and clinical manifestations, two varieties and three serotypes of
C. neoformanshave been recognized (Kwon-Chunget al. 2002). The most common variety, C. neoformans var.
grubii, includes isolates of serotype A, which are wide-spread and responsible for .80% of cryptococcal in-fections and for.99% of the infections in patients with AIDS. The other variety, C. neoformans var.neoformans, includes strains of serotype D, which also infects im-munocompromised individuals; however, the preva-lence of this variety is lower, and it is considered less pathogenic (Casadevall and Perfect 1998). Strains
of serotype AD are hybrids between strains of serotypes A and D and least common, but they have been isolated from the environment and patients (Lengeler et al. 2001; Xuet al.2002).
Although C. neoformans var. grubii has been studied extensively, its population structure is unresolved. In particular, the mode of reproduction and the extent of clonality among natural isolates have not been de-termined.C. neoformansis a haploid basidiomycete with a bipolar mating system and two alternative mating-type alleles, MATaand MATa. Although the genome of C. neoformansvar.grubiicontains the machinery for sexual reproduction and recombination, and strains are capa-ble of undergoing both processes in the laboratory, the overwhelming majority of natural isolates possess only one mating-type allele, MATa, and exhibit significant evidence of clonality. Several genotyping techniques have been used to analyze different populations of
C. neoformans, and the collective results indicate wide-spread clonality in the population (Currieet al.1994; Brandtet al.1996; Boekhoutet al.2001; Meyeret al. 2003; Litvintseva et al. 2005). Nevertheless, some studies also found evidence of recombination in natural populations of C. neoformans. For example, Xu et al. (2000) demonstrated significant incongruence among the genealogies of four unrelated genes. Burt et al. (2000) analyzed multilocus genotypes of 222 serotype A isolates from the United States and detected no
1Corresponding author:Department of Molecular Genetics and
Microbi-ology, Duke University Medical Center, Box 3020, Durham, NC 27710. E-mail: [email protected]
significant linkage disequilibrium among the loci, which may indicate evidence of recombination in the popula-tion. Litvintseva et al. (2005) analyzed multilocus amplified fragment length polymorphism (AFLP) ge-notypes of .700 environmental and clinical isolates ofC. neoformansserotype A from the United States and detected linkage equilibrium among the loci in the individual subgroups, which could be attributed to recombination in these subgroups. In 2003, we found circumstantial evidence of recombination in a clinical population ofC. neoformans var. grubii from Botswana (Litvintsevaet al.2003). Fourteen isolates, composing 10% of this population, contained the rare MATa mating-type allele, possessed eight different AFLP genotypes, and were capable of mating and recombina-tion in the laboratory. Moreover, analysis of all 139 isolates from this sample revealed the presence of two partially genetically isolated subgroups, which exhibited evidence of both clonal expansion and recombination. After decades of research and mystery, here was a pop-ulation ofC. neoformansvar.grubii(i.e., serotype A) with the capability for sexual reproduction.
The discovery of these unusual clinical isolates in Botswana stimulated the present investigation to de-termine the global prevalence or rarity of strains with the potential for sexual reproduction and recombina-tion. We analyzed 102 isolates of serotype A from dif-ferent parts of the world, including 34 previously described Botswanan strains with unique AFLP geno-types. To assess the genetic relationships among these isolates, we used two independent genotyping methods: AFLP and multilocus sequence typing (MLST), for which we developed 12 unlinked MLST loci. Both AFLP and MLST genotypes were used to analyze the popula-tion structure of this global sample. There was good agreement between the data and results obtained by the AFLP and MLST methods. Both techniques demon-strated that the population in Botswana is unique and consists of isolates that were not found in any other part of the world. MLST analyses confirmed the previous evidence of subgroups among the Botswanan isolates and provided strong evidence for genetic recombina-tion in the popularecombina-tion as the genealogies of several genes revealed significant incongruence. Conversely, the remaining global strains of serotype A were over-whelmingly clonal. Identical strains were isolated from distant parts of the world, and the gene genealogies of all 12 analyzed genes were generally congruent. How-ever, the global population was separated into two genetically distinct groups, and these two groups dif-fered from the subgroups in Botswana.
MATERIALS AND METHODS
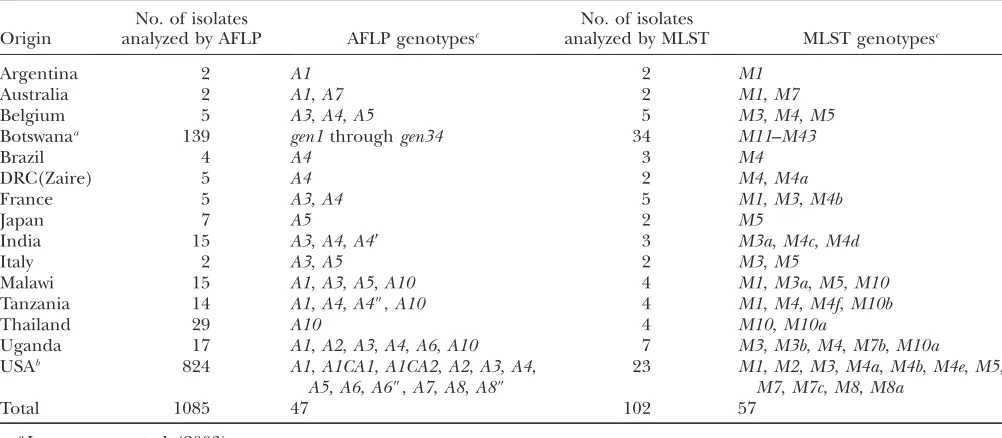
Isolates of C. neoformans: A total of 1085 isolates of C. neoformansvar.grubii(serotype A) were analyzed by the AFLP genotyping. Among them, 824 isolates were obtained from the
environmental and clinical populations in the United States, described previously (Litvintsevaet al.2005), and 139 were
cultured from spinal fluid specimens of individual patients in Botswana, also described previously (Litvintsevaet al.2003).
The remaining strains were isolated from clinical specimens and environment samples from 13 other countries (Table 1). A subset of 102 strains from different countries and with different AFLP genotypes was selected for the MLST analyses (Table 2). We also evaluated multiple strains of the same AFLP genotype to assess the sensitivity and concordance of both genotyping techniques. In addition, VNI and VNII standard strains (Meyeret al.2003) were included to provide a link to
studies performed by others. To root the maximum-parsimony tree, we used the recently sequenced JEC21 strain of sero-type D (Loftus et al. 2005). Isolates were maintained on
yeast extract–peptone–dextrose (YPD) agar medium (Difco, Detroit) at 30°.
DNA manipulations and AFLP: Genomic DNA was ex-tracted from each isolate and the AFLP analysis was performed as described (Litvintsevaet al.2003, 2005). Only intense and
reproducible bands were scored for the analyses of population structure. Polymorphic AFLP bands were defined as bands of the same size that were present in some but not all isolates. To assess the reproducibility of the AFLP method, DNA was extracted and the AFLP reactions and analyses were per-formed on at least two separate occasions for each isolate. In comparing replicate analyses, 92% of the AFLP bands were identical (data not shown).
MLST: Twelve unlinked MLST loci on nine of the chro-mosomes were selected for the analysis (C. neoformans H99 sequencing project, Duke IGSP Center for Applied Genomics and Technology, http://cgt.duke.edu/; Table 3). The follow-ing criteria were applied to the selection of MLST loci: (i) the primer-binding sites were designed to be situated within protein-coding sequences to maximize the number of strains for which a particular locus can be PCR amplified; (ii) each MLST locus contained a number of variable noncoding DNA regions, such as introns or intergenic regions, to maximize the number of strains that can be distinguished by this genotyping approach; and (iii) the MLST loci were selected so that they were physically unlinked,i.e., dispersed on different chromo-somes or separated by at least 100,000 nucleotides (Marra
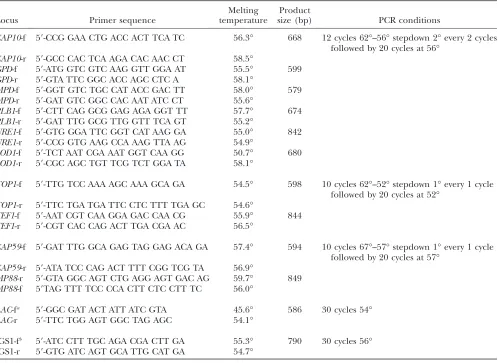
et al.2004), to test for linkage equilibrium among the loci in the population. The PCR primers and amplification condi-tions are shown in Table 4. Each PCR mixture contained 32ml of 13PCR buffer, 2 mmMgCl2, 0.2 mmdNTPs, 1 mmeach
primer, 0.065 ml iTaq DNA Polymerase (Bio-Rad, Hercules, CA), and1 ng genomic DNA. PCR products were purified using the QIAquick PCR purification kit (QIAGEN, Valencia, CA) and sequenced using an ABI 3700 sequencer with Big Dye terminators (Applied Biosystems, Foster City, CA). For most loci, PCR primers used for the amplification of the fragments were also used for sequencing. The only exceptions wereMP88 and CAP59, for which the following primers were used to obtain the complimentary DNA:MP88-seq-f, 59-TCCTCTTT TACTGGCCGTAT (forward orientation), and CAP59-seq-r, 59- GGTACTGCGCTCGAGAATGC (reverse orientation). For all of the loci, sequences were generated from both DNA strands and edited manually. Unique MLST sequence types are listed in supplemental Table 1 (http://www.genetics.org/ supplemental/) and deposited in GenBank under accession nos. DQ212527–DQ212692.
Data analyses:Sequences were automatically aligned using Sequencher 4.1 (Gene Codes, Ann Arbor, MI); the alignment was imported into MacClade 4.05 (Maddisonand Maddison
number designated the allelic profile of each isolate (supple-mental Table 1 at http://www.genetics.org/supple(supple-mental/; Enrightand Spratt1999; Taylorand Fisher2003). The
genetic relatedness among the AFLP and MLST genotypes was evaluated by nonmetric multidimensional scaling (MDS) analysis using Euclidian distance measures and by principal component analysis (PCA) with the correlation matrix, using Community Analysis Package 2.4 (PISCES Conservation, Hampshire, UK) (Hebertet al.2002).
Phylogenetic analyses were performed with PAUP version 4.0b10 (Swofford 1996). Maximum-parsimony (MP) trees
for the individual loci were identified with heuristic searches based on 500 random sequence additions for each data set; gaps in the sequence alignment were collapsed to a single character and included in the maximum-parsimony analysis as a fifth character. Strict consensus trees for the 12 genes were compared for topological congruence; taxa were deemed in conflict when they showed different relationships in two genes that were supported by a bootstrap value of$70% (Mason
-Gamerand Kellogg1996). In addition, phylogenetic
con-gruence among the 12 gene genealogies was tested by the partition homogeneity test with 1000 bootstrap replicas [in-congruence length difference (ILD) test] implemented in PAUP (Swofford1996). Because of the observed
incongru-ence in the gene genealogies of several genes, combined sequence data for all 102 isolates were analyzed with the neighbor-joining (NJ) method using uncorrected (‘‘p’’) genetic distances (Neiand Kumar2000). Sequences of the 12 MLST
loci from 92 strains of serotype A that had congruent gene genealogies were aligned with those of the recently sequenced JEC21 strain ofC. neoformansserotype D (Loftuset al.2005);
10 strains that demonstrated significant incongruence among the gene genealogies were excluded from the alignment. Maximum-parsimony trees were generated for the representa-tive strains of each unique genotype and rooted with the JEC21 strain of serotype D. Statistical support for the phylogenetic
groups was assessed by bootstrap analysis using 500 replicate data sets.
Hierarchical analysis of molecular variance (AMOVA) was performed with the Arlequin 2.0 software package (Schneider et al.2000). The total variance was partitioned
into variance among individuals within populations, variance among populations, and variance among groups of popula-tions. Variance components were calculated for the following comparisons: (i) the three groups and five populations based on the phylogenetic structure depicted in Figures 1 and 2, where group VNB contains two populations, subgroup VNB-A (n¼9) and subgroup VNB-B (n¼7), group VNI also contains two populations, global VNI (n¼60) and the Botswanan clade of VNI (n¼9), and group VNII contains one population, VNII (n¼10); and (ii) the two groups and four populations based on geographic origin, where group I contains all isolates from Botswana (n¼34), and group II contains isolates from three populations, Europe (n¼12), Africa (excluding Botswana, n¼16), and North America (n¼24). The significance of the estimated variance of each component was tested using a nonparametric permutation method with 1000 permutations (Excoffieret al.1992). In addition, pairwise Wright’s
fixa-tion indexes (FST) were calculated for the pairs of popula-tions defined by phylogenetic analysis or geographic origin using Arlequin 2.0 (Hartl and Clark 1997). The
signifi-cance of each FST-value was tested by a nonparametric per-mutation method with 1000 perper-mutations (Schneideret al.
2000).
To evaluate the association among loci in each sample, we used the index of association (IA) and the maximum-parsimony tree length (MPTL) test (MaynardSmithet al.1993;
Burtet al.2000).IA-values were calculated using Multilocus
1.2 software, and 1000 artificially recombined data sets were used to determine the statistical values of the tests. The MPTL test was performed with PAUP; 1000 permutations were used to determine the statistical value of the test.
TABLE 1
Strains analyzed by the AFLP and MLST genotyping
Origin
No. of isolates
analyzed by AFLP AFLP genotypesc
No. of isolates
analyzed by MLST MLST genotypesc
Argentina 2 A1 2 M1
Australia 2 A1,A7 2 M1,M7
Belgium 5 A3,A4,A5 5 M3,M4,M5
Botswanaa 139 gen1throughgen34 34 M11–M43
Brazil 4 A4 3 M4
DRC(Zaire) 5 A4 2 M4,M4a
France 5 A3,A4 5 M1,M3,M4b
Japan 7 A5 2 M5
India 15 A3,A4,A49 3 M3a,M4c,M4d
Italy 2 A3,A5 2 M3,M5
Malawi 15 A1,A3,A5,A10 4 M1,M3a,M5,M10
Tanzania 14 A1,A4,A4$,A10 4 M1,M4,M4f,M10b
Thailand 29 A10 4 M10,M10a
Uganda 17 A1,A2,A3,A4,A6,A10 7 M3,M3b,M4,M7b,M10a
USAb 824 A1,A1CA1,A1CA2,A2,A3,A4, A5,A6,A6$,A7,A8,A8$
23 M1,M2,M3,M4a,M4b,M4e,M5, M7,M7c,M8,M8a
Total 1085 47 102 57
aLitvintsevaet al.(2003). bLitvintsevaet al.(2005).
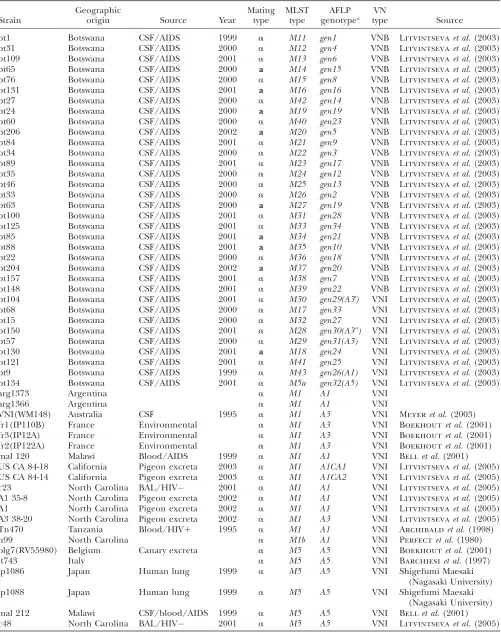
TABLE 2
Strains ofCryptococcus neoformansused in this study
Strain
Geographic
origin Source Year
Mating type
MLST type
AFLP genotypea
VN
type Source
bt1 Botswana CSF/AIDS 1999 a M11 gen1 VNB Litvintsevaet al.(2003)
bt31 Botswana CSF/AIDS 2000 a M12 gen4 VNB Litvintsevaet al.(2003)
bt109 Botswana CSF/AIDS 2001 a M13 gen6 VNB Litvintsevaet al.(2003)
bt65 Botswana CSF/AIDS 2000 a M14 gen15 VNB Litvintsevaet al.(2003)
bt76 Botswana CSF/AIDS 2000 a M15 gen8 VNB Litvintsevaet al.(2003)
bt131 Botswana CSF/AIDS 2001 a M16 gen16 VNB Litvintsevaet al.(2003)
bt27 Botswana CSF/AIDS 2000 a M42 gen14 VNB Litvintsevaet al.(2003)
bt24 Botswana CSF/AIDS 2000 a M19 gen19 VNB Litvintsevaet al.(2003)
bt60 Botswana CSF/AIDS 2000 a M40 gen23 VNB Litvintsevaet al.(2003)
bt206 Botswana CSF/AIDS 2002 a M20 gen5 VNB Litvintsevaet al.(2003)
bt84 Botswana CSF/AIDS 2001 a M21 gen9 VNB Litvintsevaet al.(2003)
bt34 Botswana CSF/AIDS 2000 a M22 gen3 VNB Litvintsevaet al.(2003)
bt89 Botswana CSF/AIDS 2001 a M23 gen17 VNB Litvintsevaet al.(2003)
bt35 Botswana CSF/AIDS 2000 a M24 gen12 VNB Litvintsevaet al.(2003)
bt46 Botswana CSF/AIDS 2000 a M25 gen13 VNB Litvintsevaet al.(2003)
bt33 Botswana CSF/AIDS 2000 a M26 gen2 VNB Litvintsevaet al.(2003)
bt63 Botswana CSF/AIDS 2000 a M27 gen19 VNB Litvintsevaet al.(2003)
bt100 Botswana CSF/AIDS 2001 a M31 gen28 VNB Litvintsevaet al.(2003)
bt125 Botswana CSF/AIDS 2001 a M33 gen34 VNB Litvintsevaet al.(2003)
bt85 Botswana CSF/AIDS 2001 a M34 gen21 VNB Litvintsevaet al.(2003)
bt88 Botswana CSF/AIDS 2001 a M35 gen10 VNB Litvintsevaet al.(2003)
bt22 Botswana CSF/AIDS 2000 a M36 gen18 VNB Litvintsevaet al.(2003)
bt204 Botswana CSF/AIDS 2002 a M37 gen20 VNB Litvintsevaet al.(2003)
bt157 Botswana CSF/AIDS 2001 a M38 gen7 VNB Litvintsevaet al.(2003)
bt148 Botswana CSF/AIDS 2001 a M39 gen22 VNB Litvintsevaet al.(2003)
bt104 Botswana CSF/AIDS 2001 a M30 gen29(A39) VNI Litvintsevaet al.(2003)
bt68 Botswana CSF/AIDS 2000 a M17 gen33 VNI Litvintsevaet al.(2003)
bt15 Botswana CSF/AIDS 2000 a M32 gen27 VNI Litvintsevaet al.(2003)
bt150 Botswana CSF/AIDS 2001 a M28 gen30(A3$) VNI Litvintsevaet al.(2003)
bt57 Botswana CSF/AIDS 2000 a M29 gen31(A3) VNI Litvintsevaet al.(2003)
bt130 Botswana CSF/AIDS 2001 a M18 gen24 VNI Litvintsevaet al.(2003)
bt121 Botswana CSF/AIDS 2001 a M41 gen25 VNI Litvintsevaet al.(2003)
bt9 Botswana CSF/AIDS 1999 a M43 gen26(A1) VNI Litvintsevaet al.(2003)
bt134 Botswana CSF/AIDS 2001 a M5a gen32(A5) VNI Litvintsevaet al.(2003)
arg1373 Argentina a M1 A1 VNI
arg1366 Argentina a M1 A1 VNI
VNI(WM148) Australia CSF 1995 a M1 A3 VNI Meyeret al.(2003)
fr1(IP110B) France Environmental a M1 A3 VNI Boekhoutet al.(2001)
fr3(IP12A) France Environmental a M1 A3 VNI Boekhoutet al.(2001)
fr2(IP122A) France Environmental a M1 A3 VNI Boekhoutet al.(2001)
mal 120 Malawi Blood/AIDS 1999 a M1 A1 VNI Bellet al.(2001)
US CA 84-18 California Pigeon excreta 2003 a M1 A1CA1 VNI Litvintsevaet al.(2005)
US CA 84-14 California Pigeon excreta 2003 a M1 A1CA2 VNI Litvintsevaet al.(2005)
c23 North Carolina BAL/HIV 2001 a M1 A1 VNI Litvintsevaet al.(2005)
A1 35-8 North Carolina Pigeon excreta 2002 a M1 A1 VNI Litvintsevaet al.(2005)
A1 North Carolina Pigeon excreta 2002 a M1 A1 VNI Litvintsevaet al.(2005)
A3 38-20 North Carolina Pigeon excreta 2002 a M1 A3 VNI Litvintsevaet al.(2005)
Tn470 Tanzania Blood/HIV1 1995 a M1 A1 VNI Archibaldet al.(1998)
h99 North Carolina a M1b A1 VNI Perfectet al.(1980)
blg7(RV55980) Belgium Canary excreta a M5 A5 VNI Boekhoutet al.(2001)
it743 Italy a M5 A5 VNI Barchiesiet al.(1997)
jp1086 Japan Human lung 1999 a M5 A5 VNI Shigefumi Maesaki
(Nagasaki University)
jp1088 Japan Human lung 1999 a M5 A5 VNI Shigefumi Maesaki
(Nagasaki University)
mal 212 Malawi CSF/blood/AIDS 1999 a M5 A5 VNI Bellet al.(2001)
c48 North Carolina BAL/HIV 2001 a M5 A5 VNI Litvintsevaet al.(2005)
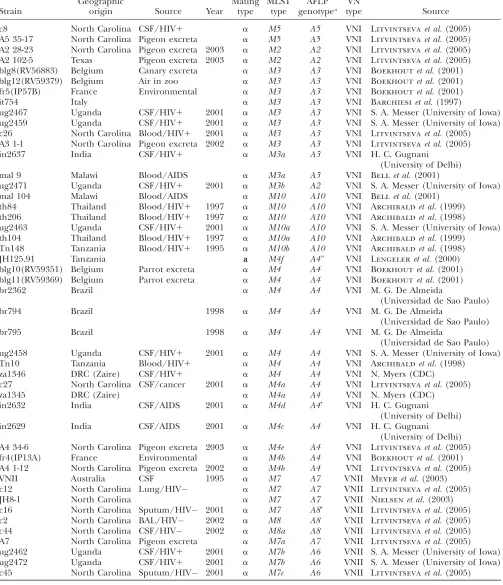
TABLE 2 (Continued)
Strain
Geographic
origin Source Year
Mating type
MLST type
AFLP genotypea
VN
type Source
c8 North Carolina CSF/HIV1 a M5 A5 VNI Litvintsevaet al.(2005)
A5 35-17 North Carolina Pigeon excreta a M5 A5 VNI Litvintsevaet al.(2005)
A2 28-23 North Carolina Pigeon excreta 2003 a M2 A2 VNI Litvintsevaet al.(2005)
A2 102-5 Texas Pigeon excreta 2003 a M2 A2 VNI Litvintsevaet al.(2005)
blg8(RV56883) Belgium Canary excreta a M3 A3 VNI Boekhoutet al.(2001)
blg12(RV59379) Belgium Air in zoo a M3 A3 VNI Boekhoutet al.(2001)
fr5(IP57B) France Environmental a M3 A3 VNI Boekhoutet al.(2001)
it754 Italy a M3 A3 VNI Barchiesiet al.(1997)
ug2467 Uganda CSF/HIV1 2001 a M3 A3 VNI S. A. Messer (University of Iowa)
ug2459 Uganda CSF/HIV1 2001 a M3 A3 VNI S. A. Messer (University of Iowa)
c26 North Carolina Blood/HIV1 2001 a M3 A3 VNI Litvintsevaet al.(2005)
A3 1-1 North Carolina Pigeon excreta 2002 a M3 A3 VNI Litvintsevaet al.(2005)
in2637 India CSF/HIV1 a M3a A3 VNI H. C. Gugnani
(University of Delhi)
mal 9 Malawi Blood/AIDS a M3a A3 VNI Bellet al.(2001)
ug2471 Uganda CSF/HIV1 2001 a M3b A2 VNI S. A. Messer (University of Iowa)
mal 104 Malawi Blood/AIDS a M10 A10 VNI Bellet al.(2001)
th84 Thailand Blood/HIV1 1997 a M10 A10 VNI Archibaldet al.(1999)
th206 Thailand Blood/HIV1 1997 a M10 A10 VNI Archibaldet al.(1998)
ug2463 Uganda CSF/HIV1 2001 a M10a A10 VNI S. A. Messer (University of Iowa)
th104 Thailand Blood/HIV1 1997 a M10a A10 VNI Archibaldet al.(1999)
Tn148 Tanzania Blood/HIV1 1995 a M10b A10 VNI Archibaldet al.(1998)
JH125.91 Tanzania a M4f A4$ VNI Lengeleret al.(2000)
blg10(RV59351) Belgium Parrot excreta a M4 A4 VNI Boekhoutet al.(2001)
blg11(RV59369) Belgium Parrot excreta a M4 A4 VNI Boekhoutet al.(2001)
br2362 Brazil a M4 A4 VNI M. G. De Almeida
(Universidad de Sao Paulo)
br794 Brazil 1998 a M4 A4 VNI M. G. De Almeida
(Universidad de Sao Paulo)
br795 Brazil 1998 a M4 A4 VNI M. G. De Almeida
(Universidad de Sao Paulo)
ug2458 Uganda CSF/HIV1 2001 a M4 A4 VNI S. A. Messer (University of Iowa)
Tn10 Tanzania Blood/HIV1 a M4 A4 VNI Archibaldet al.(1998)
za1346 DRC (Zaire) CSF/HIV1 a M4 A4 VNI N. Myers (CDC)
c27 North Carolina CSF/cancer 2001 a M4a A4 VNI Litvintsevaet al.(2005)
za1345 DRC (Zaire) a M4a A4 VNI N. Myers (CDC)
in2632 India CSF/AIDS 2001 a M4d A49 VNI H. C. Gugnani
(University of Delhi)
in2629 India CSF/AIDS 2001 a M4c A4 VNI H. C. Gugnani
(University of Delhi) A4 34-6 North Carolina Pigeon excreta 2003 a M4e A4 VNI Litvintsevaet al.(2005)
fr4(IP13A) France Environmental a M4b A4 VNI Boekhoutet al.(2001)
A4 1-12 North Carolina Pigeon excreta 2002 a M4b A4 VNI Litvintsevaet al.(2005)
VNII Australia CSF 1995 a M7 A7 VNII Meyeret al.(2003)
c12 North Carolina Lung/HIV a M7 A7 VNII Litvintsevaet al.(2005)
JH8-1 North Carolina a M7 A7 VNII Nielsenet al.(2003)
c16 North Carolina Sputum/HIV 2001 a M7 A89 VNII Litvintsevaet al.(2005)
c2 North Carolina BAL/HIV 2002 a M8 A8 VNII Litvintsevaet al.(2005)
c44 North Carolina CSF/HIV 2002 a M8a A8 VNII Litvintsevaet al.(2005)
A7 North Carolina Pigeon excreta a M7a A7 VNII Litvintsevaet al.(2005)
ug2462 Uganda CSF/HIV1 2001 a M7b A6 VNII S. A. Messer (University of Iowa)
ug2472 Uganda CSF/HIV1 2001 a M7b A6 VNII S. A. Messer (University of Iowa)
c45 North Carolina Sputum/HIV 2001 a M7c A6 VNII Litvintsevaet al.(2005)
a
Different from the AFLP genotyping scheme used by Boekhoutet al.(2001) (see Table 9).
RESULTS
AFLP genotyping confirmed the existence of two genetically isolated groups in the global population and revealed unique and diverse strains of C. neoformans
serotype A in Botswana:We used AFLP genotyping with two independent primer pairs to investigate the geno-typic diversity among 1085 strains of C. neoformans se-rotype A isolated from different parts of the world, including 139 (13%) isolates from Botswana (Table 1). Forty-five polymorphic bands were generated, which delineated 47 unique AFLP genotypes (Table 2). Among these genotypes, 34 (72%) were found only in Botswana, and the remaining 13 occurred in other countries. Among these 34 AFLP genotypes unique to Botswana, 12 genotypes were found in single isolates, and 22 were represented by more then one isolate (Litvintseva
et al.2003). Conversely, among the remaining 13 AFLP genotypes found in other countries, only 2 genotypes did not have clonemates, namely, isolates in2632 from India and JH125.91, a rareMATastrain from Tanzania (Nielsenet al.2003). The remaining 11 AFLP genotypes were identified in multiple isolates from different countries and continents (Table 2).
Genetic relationships among the 47 different AFLP genotypes are visualized by the nonmetric MDS plot (Figure 1A). Forty-four of these strains grouped into three genetically isolated subpopulations: group VNI, which includes the VNI standard strain (Meyeret al. 2003), group VNII, which includes the VNII standard strain(Meyer et al. 2003), and group VNB, which is unique to Botswana (Figure 1A). Isolates from group VNI were found in Botswana as well as globally. Members of group VNII were rare but isolated from the United States, Australia, and Uganda (Figure 1A). The Botswanan and global isolates in group VNI are related
to one another, but most of the Botswanan isolates of this group have unique genotypes. Three isolates from the Botswanan population (bt125, bt131, and bt68) pos-sess AFLP patterns that are characteristic of both group VNB and group VNI, and they may have arisen from recombination between members of the two groups. The same three groups (VNI, VNII, and VNB) were de-lineated by using PCA (data not shown).
Overall, the population in Botswana has the highest number of unique AFLP genotypes, and they have not been found anywhere else, including other African countries. For example, among the 55 strains of sero-type A from Tanzania (n¼14), Malawi (n¼15), Uganda (n¼21), and the Democratic Republic of Congo (n¼
5), only six different AFLP genotypes were identified, and none had genotypes similar to those in Botswana (Table 1).
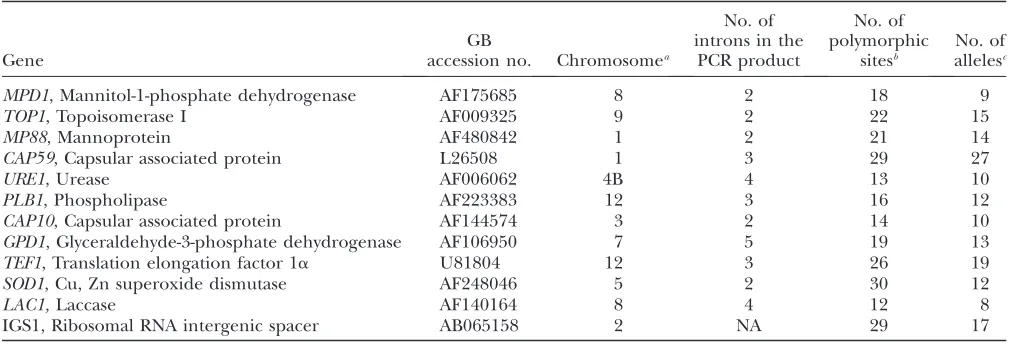
Development of the MLST genotyping system:The 12 gene sequences analyzed totaled 6835 nucleotides from which we identified 239 polymorphic sites. Among these multilocus gene sequences, SOD1 was the most variable with 30 polymorphic sites, and LAC1was the least variable with 12 polymorphic sites (Table 3).
Among the 102 strains examined, 57 different MLST genotypes were identified: 32 (56.1%) occurred among strains in Botswana and 25 in the other countries (Table 2). There was good correlation between the MLST and AFLP genotypes. For example, with two exceptions from Botswana (bt57 and bt104), every strain with a unique AFLP genotype had a unique MLST genotype. Similarly, strains with the AFLP genotype A5 always had MLST genotype M5. There were multiple strains for which the MLST genotype was more discriminatory than the AFLP genotype. For example, strains with AFLP geno-type A3 possessed MSLT genotypes M1, M3, or M3a. AFLP genotypeA4 was the most polymorphic, since it TABLE 3
MLST loci used for the analysis
Gene
GB
accession no. Chromosomea
No. of introns in the
PCR product
No. of polymorphic
sitesb
No. of allelesc
MPD1, Mannitol-1-phosphate dehydrogenase AF175685 8 2 18 9
TOP1, Topoisomerase I AF009325 9 2 22 15
MP88, Mannoprotein AF480842 1 2 21 14
CAP59, Capsular associated protein L26508 1 3 29 27
URE1, Urease AF006062 4B 4 13 10
PLB1, Phospholipase AF223383 12 3 16 12
CAP10, Capsular associated protein AF144574 3 2 14 10
GPD1, Glyceraldehyde-3-phosphate dehydrogenase AF106950 7 5 19 13
TEF1, Translation elongation factor 1a U81804 12 3 26 19
SOD1, Cu, Zn superoxide dismutase AF248046 5 2 30 12
LAC1,Laccase AF140164 8 4 12 8
IGS1, Ribosomal RNA intergenic spacer AB065158 2 NA 29 17
a
Duke IGSP Center for Applied Genomics and Technology (http://cgt.duke.edu/). b
Gaps were treated as single polymorphic sites. c
encompassed 7 related, but distinct MLST genotypes,
M4andM4a-4f(Table 2).
MLST genotyping confirmed the existence of two genetically isolated groups in the global population of
C. neoformans serotype A and a unique population in Botswana: Genetic relationships among the 57 MLST genotypes have been visualized by the nonmetric MDS plot (Figure 1B). The same three groups defined by the AFLP genotypes also emerged from the MLST analyses. Isolates from group VNB are unique to Botswana; isolates from group VNI are found both in Botswana and globally; isolates from group VNII are isolated from the United States, Australia, and Uganda. Similarly, 2 of the 3 putative hybrid genotypes identified by the AFLP analysis (bt125 and bt131) also contained MLST alleles of both groups, suggesting that they may be products of recombination between the groups. However, the third hybrid genotype identified by the AFLP analysis (bt68) grouped well within group VNI and was not identified as a hybrid by the MLST genotyping (Figure 1B). As with
AFLP, the same three groups were delineated by an alternative PCA ordination method (data not shown).
In addition, genetic relationships among all 102 iso-lates were estimated using the NJ method. (Figure 2A). The three major groups identified by the MDS and PCA analyses of the AFLP and MLST genotypes are clearly recognized and well supported by bootstrap values of 90, 77, and 100% for groups VNB, VNI, and VNII, respectively. In addition, group VNB consists of three clades, VNB-A and VNB-B, which were identified pre-viously (Litvintsevaet al.2003), and VNB-C. The VNB-A clade is dominated by the isolates with MATa mating type, the VNB-B clade contains most of the isolates with theMATaallele, and VNB-C contains isolates with both mating types (Figure 2A). In addition, the VNB-C clade is unusual because it contains only the isolates with incongruent gene genealogies of several genes (see below). Group VNI consists of five shorter clades that correspond to six distinct AFLP genotypes: A1andA3
(67% bootstrap support), A2 (99%), A3 (91%), A4
TABLE 4 MLST primers
Locus Primer sequence
Melting temperature
Product
size (bp) PCR conditions
CAP10-f 59-CCG GAA CTG ACC ACT TCA TC 56.3° 668 12 cycles 62°–56°stepdown 2°every 2 cycles followed by 20 cycles at 56°
CAP10-r 59-GCC CAC TCA AGA CAC AAC CT 58.5°
GPD-f 59-ATG GTC GTC AAG GTT GGA AT 55.5° 599 GPD-r 59-GTA TTC GGC ACC AGC CTC A 58.1°
MPD-f 59-GGT GTC TGC CAT ACC GAC TT 58.0° 579 MPD-r 59-GAT GTC GGC CAC AAT ATC CT 55.6°
PLB1-f 59-CTT CAG GCG GAG AGA GGT TT 57.7° 674 PLB1-r 59-GAT TTG GCG TTG GTT TCA GT 55.2°
URE1-f 59-GTG GGA TTC GGT CAT AAG GA 55.0° 842 URE1-r 59-CCG GTG AAG CCA AAG TTA AG 54.9°
SOD1-f 59-TCT AAT CGA AAT GGT CAA GG 50.7° 680 SOD1-r 59-CGC AGC TGT TCG TCT GGA TA 58.1°
TOP1-f 59-TTG TCC AAA AGC AAA GCA GA 54.5° 598 10 cycles 62°–52°stepdown 1°every 1 cycle followed by 20 cycles at 52°
TOP1-r 59-TTC TGA TGA TTC CTC TTT TGA GC 54.6°
TEF1-f 59-AAT CGT CAA GGA GAC CAA CG 55.9° 844 TEF1-r 59-CGT CAC CAG ACT TGA CGA AC 56.5°
CAP59-f 59-GAT TTG GCA GAG TAG GAG ACA GA 57.4° 594 10 cycles 67°–57°stepdown 1°every 1 cycle followed by 20 cycles at 57°
CAP59-r 59-ATA TCC CAG ACT TTT CGG TCG TA 56.9°
MP88-r 59-GTA GGC AGT CTG AGG AGT GAC AG 59.7° 849 MP88-f 59TAG TTT TCC CCA CTT CTC CTT TC 56.0°
LAC-fa 59-GGC GAT ACT ATT ATC GTA 45.6° 586 30 cycles 54° LAC-r 59-TTC TGG AGT GGC TAG AGC 54.1°
IGS1-fb 59-ATC CTT TGC AGA CGA CTT GA 55.3° 790 30 cycles 56° IGS1-r 59-GTG ATC AGT GCA TTG CAT GA 54.7°
a
Xuet al.(2000).
b
(91%),A5 (100%), andA10 (98%). With one excep-tion, the Botswanan isolates in group VNI formed a distinct clade within the A1/A3 clade with bootstrap support of 64%. The exceptional isolate from Botswana (bt134) is embedded within the A5 clade of group VNI (Figure 2A, Table 1), which also includes isolates from Belgium, Italy, Japan, Malawi, and the United States. Additional analyses by maximum parsimony, UPGMA, and maximum-likelihood methods generated similar phylogenetic patterns (data not shown).
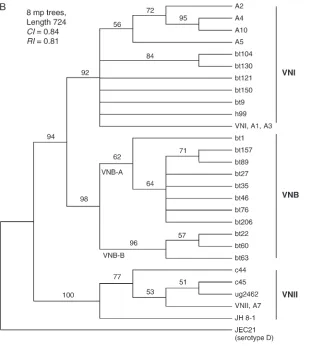
To better understand the evolutionary relationships among these populations, we compared the MLST gene sequences of 92 strains of serotype A, which had con-gruent gene genealogies (see below) with those of the recently sequenced JEC21 strain ofC. neoformans sero-type D (Loftuset al.2005). Among the variable regions of theCAP59, IGS1, andURE1loci, there was substantial polymorphism between the two serotypes. Large in-sertions/deletions were excluded from the alignment, which decreased the number of different strains that could be distinguished. Overall, 6478 nucleotides were aligned, 135 parsimoniously informative polymorphic sites were compared, and 27 genotypes were differenti-ated. Figure 2B depicts the strict consensus of the eight most parsimonious trees rooted with the JEC21 serotype D strain. The position of the root indicates that group VNII is closest to the most recent common ancestor and that groups VNB and VNI diverged more recently.
AMOVA analysis of AFLP and MLST genotypes re-veals the genetic isolation of groups VNI, VNII, and VNB and the absence of geographic structure in the global population:Phylogenetic methods and non-hierarchical ordination analyses (MDS and PCA) of
both AFLP and MLST data delineated three major groups in the global population. As an independent assessment of the validity of these groups, we performed an AMOVA on both data sets. Variance components were calculated for the following comparisons: (i) on the basis of the phylogenetic structure depicted in Figures 1 and 2, we compared three groups (VNI, VNII, and VNB) and five populations (VNI, VNI-Botswana, VNII, VNB-A, and VNB-B), and (ii) on the basis of the geographic origins of the strains, we compared two groups (Botswana and everywhere else) and four popula-tions (Botswana, elsewhere in Africa, Europe, and North America). Results of the AMOVA are shown in Table 5. For the groups based on the phylogeny, most of the AFLP allelic variation is due to variance among the groups (58.8%); the remaining AFLP variation is attributed to variance among populations (16.9%) and variance among the individuals within the population (24.3%). For the MLST genotypes, the majority of the variation is ascribed to variance within the populations (52.4%); however, the remaining variation, which is due to variance among the groups (23.8%) and among the populations (23.8%), is highly significant (P,0.001), indicating ex-tensive divergence among these groups and populations. Conversely, when groups and populations are defined on the basis of geography, the majority of the variation among both AFLP and MLST alleles is attributable to variance among the individuals within the populations (66.2 and 78.2%, respectively) as well as variance among the groups (31 and 18.9%, respectively), which indi-cates that the isolates from Botswana are indeed unique and different from all the other isolates that were analyzed. In contrast, variation among the populations Figure1.—Genetic relationships among the 47
from other sub-Saharan Africa countries, Europe, and North America was much smaller (2.8% AFLP and 2.9% MLST), indicating little differences among these populations.
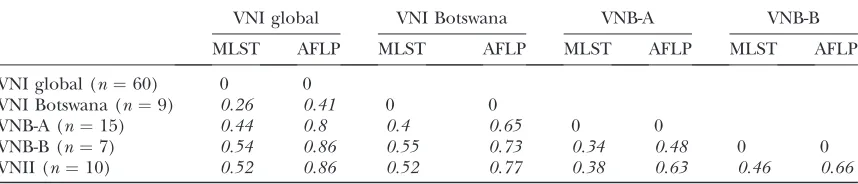
To further evaluate genetic divergence among the populations, Wright’s fixation indexes (FST) were
cal-culated for pairs of putative populations. FST has a
theoretical minimum of 0 (indicating no genetic di-vergence) and a theoretical maximum of 1 (indicating fixation for alternative alleles in different popula-tions); however, the index rarely reaches the maximum of 1, and an FST-value .0.15 denotes considerable
differentiation.
For all of the five phylogenetically defined popula-tions, the pairwise FST-values were above .0.25 (P ,
0.001, Table 6), indicating significant genetic diver-gence among these populations. Conversely, when the populations were defined according to the geographi-cal origins of the isolates, the population from Botswana was significantly divergent from the other samples from Africa, North America, and Europe (FST $ 0.18; P ,
0.001, Table 7). However, there was no significant dif-ference among the populations from non-Botswanan Africa, North America, and Europe. In both sets ofFST
calculations (Tables 6 and 7), the AFLP and MLST data yielded the same results.
Figure 2.—(A) Genetic
relationships of MLST ge-notypes among the 102 isolates ofC. neoformans se-rotype A visualized by the neighbor-joining dendro-gram. Numbers on each branch indicate the boot-strap values .50%, based on 500 replications. Vertical lines represent strains with identical genotypes. The clades labeled A1–A5 and A10 are AFLP genotypes that correspond to the AFLP genotypes listed in Table 1. VNB-A and VNB-B are two subpopulations within the VNB group described previously (Litvintseva
et al. 2003). Isolates from Botswana are shown in red, and isolates with theMATa mating type are shown in boldface type and desig-nated with ‘‘a.’’ (B) Strict consensus of eight maxi-mum-parsimony trees in-ferred from the combined gene genealogies of the C. neoformans serotype A MLST genotypes and rooted with sequences of the JEC21 serotype D strain (Loftuset al. 2005). Only
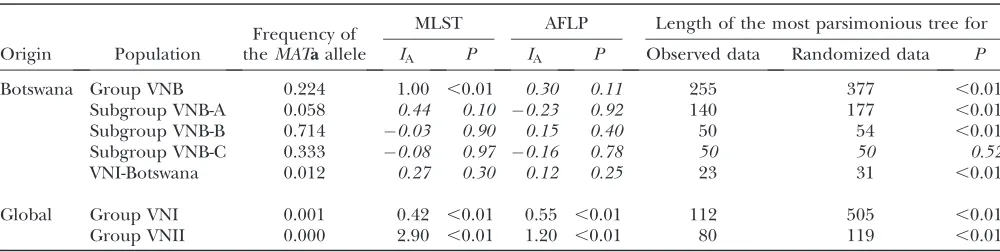
Evidence of clonality in the global population and recombination in the Botswanan population: The ex-istence of identical MLST/AFLP genotypes on different continents (Figure 2A) suggests that the global popula-tion of C. neoformans var. grubii (serotype A) is pre-dominately clonal. Previous data indicated that the isolates from Botswana exhibit evidence of both clon-ality and recombination (Litvintsevaet al.2003). Here we used MLST as well as AFLP genotypes to further investigate the possibility of recombination in the Botswanan sample. The index of association (IA) estimates
linkage disequilibrium among the loci in the popula-tion (MaynardSmithet al.1993).IAwas calculated for the AFLP and MLST genotypes in different populations and groups. Linkage equilibrium has been detected among both AFLP and MLST loci in the Botswanan subgroups VNB-A, VNB-B, and VNB-C and in the Botswanan clade of VNI (Table 8). However, the null hypothesis of linkage equilibrium was rejected for the MLST loci in groups VNI, VNII, and VNB, as well as among the AFLP loci in groups VNI and VNII (Table 8,
P,0.01).
Nonrandom associations among the loci in the various groups were also evaluated by phylogenetic methods. When all of the strains were included in the analysis, 855 most parsimonious trees were generated (data not shown). The consistency indexes (CI) of those
trees were low (CI¼0.43); however, the strict consensus of the trees was well resolved (data not shown). More-over, the lengths of the most parsimonious trees (LMPT) of the entire sample of 102 isolates and of groups VNI, VNII, and VNB, as well as subgroups VNB-A and VNB-B, were significantly shorter then the lengths of the most parsimonious trees calculated for the randomized data, indicating significant linkage disequilibrium among the alleles in all of the groups (Table 8,P,0.01). The only exception was the VNB-C subgroup, in which linkage equilibrium among the loci was also detected by the LMPT test (P¼0.52, Table 8).
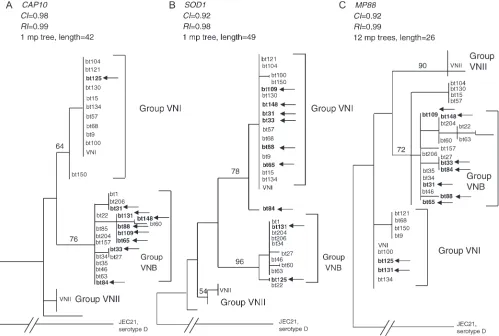
We developed a phylogeny for each of the 12 genes in the MLST data set of 102 isolates, and these gene genealogies were analyzed for their congruence. Under strict clonality, the genealogies of multiple genes should be congruent (Tayloret al. 1999b; Burtet al. 2000). Nine Botswanan strains (bt125, b148, bt33, bt88, bt84, bt65, bt131, bt31, and bt109) and the MATa strain ( JH125.91) from Tanzania were inconsistently placed in the 12 gene genealogies. For example, in the CAP10
gene genealogy, bt148, bt33, bt88, bt65, bt131, bt31, and bt109 cluster with group VNB strains from Botswana, whereas bt125 clusters with group VNI (bootstrap 76%, Figure 3A). Conversely, in the SOD1 gene genealogy, bt131 and bt125 cluster with group VNB, whereas bt148, bt33, bt88, bt65, and bt109 cluster with group VNI
(bootstrap 96%, Figure 3B). Moreover, in the MP88
gene genealogy, both bt131 and bt125 cluster with group VNI, whereas the remaining six strains cluster with group VNB (bootstrap 72%, Figure 3C). Overall, phy-logenetic incongruence among the 12 gene genealogies genes was statistically significant (ILD test,P,0.01).
Confirmation of the existence of genetically isolated groups of serotype A:Other reports have documented the existence of genetically distinct groups among iso-lates of serotype A, but intrinsic problems associated with interpreting and comparing fingerprinting data have precluded clarification of the relationships among the previously described groups.
i. Using multilocus enzyme electrophoresis (MLEE), Brandtet al.analyzed a large clinical population of serotype A in the United States and described two distinct groups, designated ET1 and ET2 (Brandt
et al.1995, 1996).
ii. Using AFLP genotyping, Boekhoutet al.examined a global collection of serotype A and identified two distinct clusters, termed genotypes 1 and 1A
(Boekhoutet al.2001).
iii. Meyer et al. used PCR fingerprints to identify two distinct molecular types within a global population
of serotype A, designated VNI and VNII (Meyer
et al.2003).
iv. Litvintseva et al. analyzed AFLP genotypes in the Botswanan population of serotype A and identified two groups, I and II (Litvintsevaet al.2003); they also investigated a large sample of clinical and environmental isolates from the United States and discerned two distinct subgroups, also designated I and II (Litvintsevaet al.2005).
To clarify this confusing nomenclature and compare isolates used in previous studies, this investigation included the reference strains of VNI and VNII (Meyer
et al.2003) and adopted the VNI–VNII nomenclature. The MLST/AFLP cluster that included the VNI typing strain was designated group VNI, and the cluster with the VNII reference strain was named group VNII (Figures 1 and 2). The relationships among these variously labeled genetic groups are shown in Table 9.
DISCUSSION
Although the population structure of C. neoformans
has been studied for many years (Brandt et al.1995; Mitchell and Perfect 1995; Casadevall and TABLE 5
Analysis of variance (AMOVA) of AFLP and MLST genotypes of 102 isolates ofC. neoformans
Source of variation d.f.
Sum of squares Variance components P-value
AFLP MLST AFLP (%) MLST (%) AFLP MLST
Populations are defined on the basis of phylogeny (VNB group: populations VNB-A and VNB-B; VNI group: populations VNI Botswanan and VNI global; VNII group: population VNII)
Among groups 2 177.3 120.9 3.6 (58.8) 1.3 (23.8) ,0.001 ,0.001
Among populations within groups 2 29.9 38.9 1.0 (16.9) 1.2 (23.8) ,0.001 ,0.001
Within populations 97 103.6 255.1 1.5 (24.3) 2.9 (52.4) ,0.001 ,0.001
Total 101 310.8 414.9 6.1 5.4
Populations are defined on the basis of the geographical structure (group I: population Botswana; group II: populations Africa (excluding Botswana), Europe, and North America)
Among groups 1 67.7 46.2 1.5 (31.0) 0.9 (18.9) ,0.001 ,0.001
Among populations within groups 2 11.0 12.7 0.1 (2.8) 0.1 (2.9) ,0.001 0.03
Within populations 81 260.7 316.8 3.2 (66.2) 3.9 (78.2) ,0.001 ,0.001
Total 84 339.4 375.7 4.8 4.9
TABLE 6
PairwiseFSTamong five populations defined on the basis of phylogeny (all dataP,0.001)
VNI global VNI Botswana VNB-A VNB-B
MLST AFLP MLST AFLP MLST AFLP MLST AFLP
VNI global (n¼60) 0 0
VNI Botswana (n¼9) 0.26 0.41 0 0
VNB-A (n¼15) 0.44 0.8 0.4 0.65 0 0
VNB-B (n¼7) 0.54 0.86 0.55 0.73 0.34 0.48 0 0
VNII (n¼10) 0.52 0.86 0.52 0.77 0.38 0.63 0.46 0.66
Perfect1998; Boekhoutet al.2001; Meyeret al.2003; Litvintseva et al. 2005), the DNA fingerprinting methods that have been used in the past precluded comparing genotypes developed in different laborato-ries. Therefore, the overall understanding of the global population structure of this important pathogen has been fragmentary. For example, unusual populations ofC. neoformans var.grubii serotype A were discovered in Botswana (Litvintseva et al. 2003) and Brazil (Barreto deOliveiraet al.2004), but their relation-ships to isolates from other countries are obscure.
The first attempt to apply multilocus sequence typing to the analysis of the population structure ofC. neofor-manswas performed by Xuet al.(2000), who analyzed the sequences of four genes and determined the evo-lutionary relationships among 34 strains, representing all four serotypes ofC. neoformansandC. gattii. However, due to the limited number of strains and genes ana-lyzed, their study did not explicate the population structure ofC. neoformans var. grubii (serotype A), the most clinically relevant variety of the fungus. Here we focused on isolates of serotype A and expanded the MLST approach, which enables unambiguous genotyp-ing of isolates, eliminates the necessity of reference strains, simplifies sharing genotypic data among other laboratories, and permits other researchers to add new strains to further refine the analyses. We compared
genotyping by MLST to the more commonly used AFLP method and found that MLST had greater discrimina-tory power. Overall, there was good correlation between the MLST and AFLP genotypes, and combining these methods allowed excellent discrimination among even closely related strains of serotype A.
To analyze the genetic relationships among the AFLP and MLST genotypes, we used three independent meth-ods: AMOVA, ordination methods (MDS and PCA), and phylogenetic analyses, which are commonly used to detect evidence of population subdivision and differen-tiation (Hartl and Clark 1997; Burnett 2003). All three methods demonstrated that the global popula-tion ofC. neoformansvar.grubiicomprised at least three genetically distinct groups, designated VNI, VNII, and VNB. Isolates of the VNB group were unique to Botswana; whereas strains of VNI and VNII groups were widespread (Figure 2A).
With the exception of the unusual population in Botswana, the global population of serotype A was dominated by isolates of the VNI and VNII groups and exhibited strong evidence of clonality (MaynardSmith
et al.1993; Tayloret al.1999a,b): (i) identical MLST/ AFLP genotypes were isolated from quite distant loca-tions (Figure 2A, Table 2); (ii) statistically significant linkage disequilibrium was detected among the AFLP and MLST loci in both VNI and VNII groups (Table 8); TABLE 7
PairwiseFSTamong four populations defined on the basis of geography
Botswana Africaa Europe
MLST (P)* AFLP (P) MLST (P) AFLP (P) MLST (P) AFLP (P)
Botswana (n¼34) 0 0
Africa (n¼16) 0.19(,0.001) 0.31(,0.001) 0 0
Europe (n¼12) 0.25(,0.001) 0.43(,0.001) 0.06 (0.08) 0.05 (0.21) 0 0
North America (n¼24) 0.18(,0.001) 0.22(,0.001) 0.02 (0.19) 0.05 (0.12) 0.03 (0.20) 0.13(0.04)
Statistically significantFST-values are shown in italics. aExcluding Botswana.
TABLE 8
Statistical tests of associations among the loci in different populations
Origin Population
Frequency of theMATaallele
MLST AFLP Length of the most parsimonious tree for
IA P IA P Observed data Randomized data P
Botswana Group VNB 0.224 1.00 ,0.01 0.30 0.11 255 377 ,0.01
Subgroup VNB-A 0.058 0.44 0.10 0.23 0.92 140 177 ,0.01
Subgroup VNB-B 0.714 0.03 0.90 0.15 0.40 50 54 ,0.01
Subgroup VNB-C 0.333 0.08 0.97 0.16 0.78 50 50 0.52
VNI-Botswana 0.012 0.27 0.30 0.12 0.25 23 31 ,0.01
Global Group VNI 0.001 0.42 ,0.01 0.55 ,0.01 112 505 ,0.01
Group VNII 0.000 2.90 ,0.01 1.20 ,0.01 80 119 ,0.01
(iii) the gene genealogies of both groups were congru-ent; (iv) AMOVA andFST-analyses detected little or no
differences in the genotypic frequencies among the populations from North America, Europe, and Africa (excluding Botswana) (Tables 5–7); and (v) in addition, geographic structure was not evident in the phylogeny of these groups, which is consistent with a predomi-nantly clonal mode of reproduction.
In particular, six AFLP/MLST genotypes (A1/M1, A3/M1, A3/M3, A4/M4, A5/M5, and A7/M7)
ac-counted for 53% of the global isolates excluding Botswana and Thailand (Tables 1 and 2; Figure 2A). [The unusual population in Botswana is discussed below, and the 29 clinical isolates from Thailand (Archibaldet al.1999) contained two clonally related genotypes, A10/M10 and A10/M10a, which were also found in Uganda and Malawi (Figure 2A)]. The prevalence of a few identical strains and overall low level of polymorphisms in the global population suggest an ‘‘epidemic’’ structure of the population with recent Figure3.—Most parsimonious trees for 102 isolates ofC. neoformansserotype A based on sequence polymorphisms in the
fol-lowing genes:CAP10(A),SOD1(B), andMP88(C) rooted with sequences of the JEC21 serotype D strain. For clarity of presen-tation only selected isolates from Botswana are shown. Vertical lines represent identical genotypes. Numbers above each branch indicate bootstrap values.50%, based on 500 replications. Strains that are inconsistently placed within the gene genealogies are shown in boldface type and marked with arrows. CI, consistency index; RI, retention index.
TABLE 9
Relationships among different molecular groups inC. neoformansvar.grubiidescribed by different authors
Author Methods Grouping
This investigation AFLP, MLST VNI group VNII group VNB group
Brandtet al.(1995) MLEE, PCR fingerprinting ET1 complex ET2 complex ND
Boekhoutet al.(2001) AFLP 1 1A ND
Meyeret al.(2003) PCR fingerprinting, RFLP VNI VNII ND
Litvintsevaet al.(2003) AFLP, sequencing II ND I
Litvintsevaet al.(2005) AFLP II I ND
emergence and/or dispersal of these strains around the globe (MaynardSmithet al.1993). Similar population structures have been described for pathogenic bacteria (Maynard Smith et al. 1993; Enright and Spratt 1999), protozoa (Tibayreng et al. 1990), and other fungi (Graseret al.1996; Carboneet al.1999; Couch and Kohn 2000; Morehouseet al. 2003; O’Donnell
et al.2004). However, in these cases, the spread of clonal microorganisms was attributed either to the migration of infected humans or to the international trade of horticultural and agricultural products (Graser et al. 1996; Carbone et al. 1999; Couch and Kohn 2000; Morehouseet al.2003; O’Donnellet al.2004). Wind (Hovmoolleret al.2002) and water (O’Donnellet al. 2004) may also contribute to the dispersal of clonal lineages. However, these explanations are unsatisfactory because cryptococcosis is not transmitted among hu-mans or animals and isolates of serotype A are not known to produce airborne spores capable of dispersion over long distances (Casadevalland Perfect1998).
This global clonality and low genetic diversity may be attributable to the well-documented association of iso-lates of serotype A with feral pigeons, which can serve as vectors of transmission (Casadevall and Perfect 1998; Litvintseva et al. 2005). Although the pigeons do not acquire cryptococcosis, most likely because
C. neoformans cannot grow at the normal avian body temperature of 41°–42°, the yeast cells survive passage through the pigeon intestinal tract and may remain viable for up to 2 years in pigeon excreta, which contain urea and other utilizable substrates (Casadevall and Perfect 1998). Feral pigeons have populated the re-gions surrounding the Mediterranean basin for the last 2000 years and were introduced to many other areas during the European expansion within the last 400 years (Long 1981). Therefore, in recent centuries pigeons probably facilitated the global spread of serotype A. Our investigation supports this hypothesis, as strains from both groups VNI and VNII, as well as the six most prevalent genotypes, have been isolated from pigeon excreta and other environmental sources in the United States and Europe (Table 2, Figure 2A; Boekhout
et al.2001; Litvintsevaet al.2005). Moreover, with the exception of the A2/M2 genotype, which so far has been detected only in the environment (Table 2; Litvintseva
et al.2005), most of the genotypes were equally prevalent in clinical and in environmental samples.
Unlike the remaining global population, the popula-tion in Botswana is more diverse and appears to be genetically and geographically unique. We have AFLP genotyped.1000 haploid isolates of serotype A from different parts of the world, including the sub-Saharan countries of Tanzania, Uganda, Malawi, and the Dem-ocratic Republic of the Congo (Zaire), and isolates of group VNB were found only in Botswana. Moreover, with one exception (bt134, Figure 2A), genotypes of the Botswanan isolates within group VNI formed a single,
relatively well supported clade (bootstrap 64%), and they were not found outside Botswana. Both VNB and VNI isolates from Botswana were capable of mating with other global isolates of the VNI group in the laboratory (Litvintseva et al. 2003), as well as with the JH8-1 strain from the VNII group (our unpublished data). The presence of apparent hybrid genotypes in the Botswanan population (Figure 3) indicates that VNB and VNI strains can mate and recombine in the environment. Most likely, isolation or selection of the unique population of serotype A in Botswana is attrib-uted to the presence of geographical or ecological barriers that impede genetic exchange with other populations.
Without local environmental studies, the possibility of an unusual ecological niche for the VNB subpopulation is open to conjecture. Strains of the other groups of serotype A have been isolated from a variety of natural environments, including the excreta of several avian species (Casadevalland Perfect1998; Litvintseva
et al.2005), decayed wood (Casadevalland Perfect 1998; Randhawaet al.2003), trees (Meyeret al.2003; Barreto deOliveiraet al.2004; Gugnaniet al.2005), domestic dust (Swinneet al.1989; Barreto deOliveira
et al.2004), and apian habitats (Erginet al.2004). Few, if any, plants and animals are solely endemic to Botswana, and it is likely that VNB genotypes will be discovered in vicinal countries. In general, the sub-Saharan region supports a rich variety and abundance of plant, avian, mammalian, and insect species (Burger2003), and any component(s) of this biota could conceivably enrich for and harborC. neoformans.(Certainly, the highest global incidence of cryptococcosis occurs in sub-Saharan Africa.) The Botswanan population of serotype A is charac-terized by a high proportion of fertileMATaisolates that have not been found in any other parts of the world (Table 8). However, the proportion ofMATastrains in the VNB group was not consistent with frequent sexual recombinationðpˆ¼0:22, Table 8). Moreover, the distri-bution of the MATa allele within the VNB group was uneven: the VNB-A clade was dominated by the isolates with the MATa mating type (Table 8, Figure 2A), whereas VNB-B was dominated by the isolates with the
VNB group of C. neoformans, VNB-C, includes isolates with both mating types, all of which have incongruent genealogies and bear direct evidence of recombination (Figures 2 and 3). Furthermore, VNB-C was the only sub-group of the global sample, in which linkage equilib-rium was detected with both the IA and LMPT tests
(Table 8), and therefore it may represent an actively recombining component of the Botswanan population. However, the ecological or geographical rationale for applying these statistics for the VNB-C group alone requires additional investigation (MaynardSmithet al. 1993; Litvintsevaet al.2003). In addition to the VNB-C isolates, several strains in the Botswanan population (e.g., bt125, bt131, and bt148) contain hybrid genotypes that originated from recombination between VNB and VNI groups (Figures 2A and 3). Environmental sampling in Botswana and neighboring regions will be necessary to investigate the possibility and extent of genetic recom-bination in the population.
Overall, our results indicate that the population of serotype A in Botswana exhibits evidence of both clonality and recombination, whereas the remaining global population is predominantly clonal. Population genet-ics studies of other medically important fungi com-monly manifest evidence of both clonal propagation and recombination (Tayloret al.1999a; O’Donnell
et al. 2004). Both modes of reproduction confer evo-lutionary advantages and as well as costs to fitness. For example, it was recently demonstrated that interaction between the mating partners inC. neoformansserotype D incurred a 10% reduction in vegetative fitness, which may explain the overall preference for clonal propa-gation in the population (Xu 2005). Conversely, in
Saccharomyces cerevisiaesexual reproduction significantly increased the rate of adaptation to new environments (Goddardet al.2005), which may explain why a small amount of recombination is maintained in fungal pop-ulations, despite the apparent compromise in fitness.
This study applied two independent genotyping methods, MLST and AFLP, and an array of population genetics tests to investigate a sample of global isolates ofC. neoformansvar.grubii. Our investigation addressed several relevant issues regarding the diversity, popula-tion structure, and mode of reproducpopula-tion of this pathogen. The results indicated the presence of three genetically isolated groups in the global population. Groups VNI and VNII are widespread, dominated by isolates with the MATa mating-type allele, and pre-dominantly clonal; whereas, isolates of group VNB are unique to Botswana, contain a significant proportion of fertile strains with theMATamating type, exhibit greater genotypic diversity than groups VNI or VNII, and manifest evidence of clonality and recombination. To our knowledge this is the first report of an endemic, genetically distinct population of C. neoformans associ-ated with a particular geographical locality, and this finding may have attendant clinical implications.
How-ever, it is probable that the global population of C. neoformans var. grubii (serotype A) is not restricted to these three genetic groups. We predict that other ge-netically distinct endemic groups will be identified in other countries and continents. The MLST genotyping system developed here can be used by multiple labora-tories for a global surveillance of strains to identify addi-tional clinical and environmental isolates and assign them to characterized or new populations of serotype A.
Cultures were generously provided by Wiley A. Schell (Medical Mycological Research Laboratory, Duke University Medical Center), L. Barth Reller (Department of Pathology, Duke University Medical Center), Wieland Meyer (Center for Infectious Diseases and Microbi-ology, Westmead Hospital, Sydney, Australia), and Teun Boekhout (Centraalbureau voor Schimmelcultures, Utrecht, The Netherlands). We thank Timothy Y. James and Robert E. Marra for helpful discussions, and we are grateful to Lisa Bukovnik for DNA sequencing. This investigation was supported by Public Health Service grants AI25783 and AI44975 from the National Institutes of Health.
LITERATURE CITED
Archibald, L. K., M. O. den Dulk, K. J. Pallangyo and L. B.
Reller, 1998 FatalMycobacterium tuberculosisbloodstream
infec-tions in febrile hospitalized adults in Dar es Salaam, Tanzania. Clin. Infect. Dis.26:290–296.
Archibald, L. K., L. C. McDonald, S. Rheanpumikankit,
S. Tansuphaswadikul, A. Chaovanichet al., 1999 Fever and
human immunodeficiency virus infection as sentinels for emerg-ing mycobacterial and fungal bloodstream infections in hospital-ized patients./¼15 years old, Bangkok. J. Infect. Dis.180:87–92. Barchiesi, F., L. F. Di Francesco, P. Compagnucci, D. Arzeni,
O. Cirioniet al., 1997 Genotypic identification of sequential
Can-dida albicansisolates from AIDS patients by polymerase chain reac-tion techniques. Eur. J. Clin. Microbiol. Infect. Dis.16:601–605. Barreto deOliveira, M. T., T. Boekhout, B. Theelen, F. Hagen,
F. A. Baroniet al., 2004 Cryptococcus neoformansshows a
remark-able genotypic diversity in Brazil. J. Clin. Microbiol. 42:1356– 1359.
Bell, M., L. K. Archibald, O. Nwanyanwu, J. Tokars, P. Kazembe
et al., 2001 Seasonal variation in the etiology of bloodstream in-fections in a febrile inpatient population in a developing country. J. Infect. Dis.5:63–69.
Boekhout, T., B. Theelen, M. R. Diaz, J. W. Fell, W. C. Hopet al.,
2001 Hybrid genotypes in the pathogenic yeastCryptococcus neo-formans.Microbiology147:891–907.
Brandt, M. E., L. C. Hutwagner, R. J. Kuykendalland R. W.
Pinner, 1995 Comparison of multilocus enzyme electrophoresis
and random amplified polymorphic DNA analysis for molecular subtyping of Cryptococcus neoformans. The cryptococcal disease active surveillance group. J. Clin. Microbiol.33:1890–1895. Brandt, M. E., L. C. Hutwagner, L. A. Klug, W. S. Baughman,
D. Rimlandet al., 1996 Molecular subtype distribution of
Cryp-tococcus neoformansin four areas of the United States. Cryptococ-cal Disease Active Surveillance Group. J. Clin. Microbiol. 34:
912–917.
Burger, D. (Editor), 2003 South Africa Year Book.2003/04.
Gover-ment Communications (GCIS), Pretoria, South Africa. Burnett, J., 2003 Fungal Populations and Species.Oxford University
Press, New York.
Burt, A., V. Koufopanouand J. W. Taylor, 2000 Population
genet-ics of human-pathogenic fungi, pp. 229–244 inMolecular Epidemi-ology of Infectious Diseases, edited by R. A. Thompson. Edward
Arnold, London.
Campbell, L. T., B. J. Currie, M. Krockenberger, R. Malik, W. Meyer
et al., 2005 Clonality and recombination in genetically differenti-ated subgroups ofCryptococcus gattii.Eukaryot. Cell4:1403–1409. Carbone, I., J. B. Anderson and L. M. Kohn, 1999 Patterns of
descent in clonal lineages and their multilocus fingerprints are
Casadevall, A., and J. R. Perfect, 1998 Cryptococcus neoformans.
ASM Press, Washington, DC.
Couch, B. C., and L. M. Kohn, 2000 Clonal spread ofSclerotium
cepivorumin onion production with evidence of past recombina-tion events. Phytopathology90:514–521.
Currie, B. P., L. F. Freundlichand A. Casadevall, 1994 Restriction
fragment length polymorphism analysis ofCryptococcus neoformans
isolates from environmental (pigeon excreta) and clinical sources in New York City. J. Clin. Microbiol.32:1188–1192.
Enright, M. C., and B. G. Spratt, 1999 Multilocus sequence
typ-ing. Trends Microbiol.7:482–487.
Ergin, C., M. Ilkitand O. Kaftanoglu, 2004 Detection of
Crypto-coccus neoformansvar.grubiiin honeybee (Apis mellifera) colonies.
Mycoses47:431–434.
Excoffier, L., P. E. Smouseand J. M. Quattro, 1992 Analysis of
molecular variance inferred from metric distances among DNA haplotypes: application to human mitochondrial DNA restriction data. Genetics131:479–491.
Goddard, M. R., H. C. Godfrayand A. Burt, 2005 Sex increases
the efficacy of natural selection in experimental yeast popula-tions. Nature434:636–640.
Graser, Y., M. Volovsek, J. Arrington, G. Schonian, W. Presber
et al., 1996 Molecular markers reveal that population structure of the human pathogenCandida albicansexhibits both clonality and recombination. Proc. Natl. Acad. Sci. USA93:12473–12477. Gugnani, H. C., T. G. Mitchell, A. P. Litvintseva, K. Lengeler,
J. Heitmanet al., 2005 Isolation ofCryptococcus gattiiand
Cryp-tococcus neoformansvar.grubiifrom the flowers and bark of Euca-lyptus trees in India. Med. Mycol.43:565–569.
Halliday, C. L., and D. A. Carter, 2003 Clonal reproduction and
limited dispersal in an environmental population ofCryptococcus neoformansvargattiiisolates from Australia. J. Clin. Microbiol.41:
703–711.
Hartl, D. L., and A. G. Clark, 1997 Principles of Population Genetics.
Sinauer Associates, Sunderland, MA.
Hebert, P., A. Cywinnska, S. Balland J.deWaard, 2002 Biological
identifications through DNA barcodes. Proc. R. Soc. Lond.270:
313–321.
Hovmooller, M. S., A. F. Justesen and J. K. M. Brown,
2002 Clonality and long-distance migration ofPuccinia striformis f. sp. triticiin North-West Europe. Plant Pathol.51:24–32.
Kwon-Chung, K. J., T. Boekhout, J. W. Fell and M. Diaz,
2002 Proposal to conserve the nameCryptococcus gattiiagainst
C. hondurianusandC. bacillisporus(Basidiomycota,Hymenomycetes,
Tremellomycetidae). Taxon51:804–806.
Lengeler, K. B., G. M. Coxand J. Heitman, 2001 Serotype AD strains
ofCryptococcus neoformansare diploid or aneuploid and heterozy-gous at the mating-type locus. Infect. Immun.69:115–122. Lengeler, K. B., P. Wang, G. M. Cox, J. R. Perfectand J. Heitman,
2000 Identification of the MATa mating-type locus of Cryptococ-cus neoformansreveals a serotype A MATa strain thought to have been extinct. Proc. Natl. Acad. Sci. USA97:14455–14460. Litvintseva, A. P., R. E. Marra, K. Nielsen, J. Heitman, R. Vilgalys
et al., 2003 Evidence of sexual recombination among Cryptococ-cus neoformansserotype A isolates in sub-Saharan Africa. Eukaryot.
Cell2:1162–1168.
Litvintseva, A. P., L. Kestenbaum, R. Vilgalysand T. G. Mitchell,
2005 Comparative analysis of environmental and clinical
popu-lations ofCryptococcus neoformans.J. Clin. Microbiol.43:556–564. Loftus, B. J., E. Fung, P. Roncaglia, D. Rowley, P. Amedeoet al.,
2005 The genome of the basidiomycetous yeast and human
pathogenCryptococcus neoformans.Science307:1321–1324. Long, J. L., 1981 Introduced Birds of the World: The Worldwide History,
Distribution and Influence of Birds Introduced to New Environments.
David & Charles, London.
Maddison, W. P., and D. R. Maddison, 1989 Interactive analysis of
phylogeny and character evolution using the computer program
MacClade. Folia Primatol.53:190–202.
Marra, R. E., J. C. Huang, E. Fung, K. Nielsen, J. Heitmanet al.,
2004 A genetic linkage map ofCryptococcus neoformansvariety
neoformans serotype D (Filobasidiella neoformans). Genetics167:
619–631.
Mason-Gamer, R. J., and E. A. Kellogg, 1996 Testing for
phyloge-netic conflict among molecular data sets in the tribe Triticeae
(Gramineae). Syst. Biol.45:524–545.
MaynardSmith, J. M., N. H. Smith, M. O’Rourkeand B. Spratt,
1993 How clonal are bacteria? Proc. Natl. Acad. Sci. USA90:
4384–4388.
Meyer, W., A. Castaneda, S. Jackson, M. Huynhand E. Castaneda,
2003 Molecular typing of IberoAmerican Cryptococcus
neofor-mansisolates. Emerg. Infect. Dis.9:189–195.
Mitchell, T. G., and J. R. Perfect, 1995 Cryptococcosis in the era
of AIDS–100 years after the discovery ofCryptococcus neoformans.
Clin. Microbiol. Rev.8:515–548.
Morehouse, E. A., T. Y. James, A. R. Ganley, R. Vilgalys, L. Berger
et al., 2003 Multilocus sequence typing suggests the chytrid pathogen of amphibians is a recently emerged clone. Mol. Ecol.
12:395–403.
Nei, M., and S. Kumar, 2000 Molecular Evolution and Phylogenetics.
Oxford University Press, New York.
Nielsen, K., G. M. Cox, P. Wang, D. Toffaletti, J. R. Perfectet al.,
2003 Sexual cycle ofCryptococcus neoformansvar.grubiiand viru-lence of congenic a andaisolates. Infect. Immun.71:4831–4841. O’Donnell, K., D. A. Sutton, M. G. Rinaldi, K. C. Magnon, P. A.
Coxet al., 2004 Genetic diversity of human pathogenic
mem-bers of theFusarium oxysporumcomplex inferred from multilocus DNA sequence data and amplified fragment length polymor-phism analyses: evidence for the recent dispersion of a geograph-ically widespread clonal lineage and nosocomial origin. J. Clin.
Microbiol.42:5109–5120.
Perfect, J. R., S. D. R. Langand D. T. Durack, 1980 Chronic
cryp-tococcal meningitis: a new experimental model in rabbits. Am. J. Pathol.101:177–194.
Randhawa, H. S., T. Kowshikand Z. U. Khan, 2003 Decayed wood
ofSyzygium cuminiandFicus religiosaliving trees in Delhi/New Delhi metropolitan area as natural habitat of Cryptococcus
neo-formans. Med. Mycol.41:199–209.
Schneider, S., D. Roessliand L. Excoffier, 2000 Arlequin: A
Soft-ware for Population Genetics Data Analysis, Ver. 2.000. Genetics and Biometry Lab, Department of Anthropology, University of Geneva (http://lgb.unige.ch/arlequin/).
Sugita, T., R. Ikedaand T. Shinoda, 2001 Diversity among strains
ofCryptococcus neoformansvar.gattiias revealed by a sequence anal-ysis of multiple genes and a chemotype analanal-ysis of capsule
poly-saccharide. Microbiol. Immunol.45:757–768.
Swinne, D., M. Deppner, R. Laroche, J. J. Flochand P. Kadende,
1989 Isolation ofCryptococcus neoformansfrom houses of AIDS-associated cryptococcosis patients in Bujumbura (Burundi).
AIDS3:389–390.
Swofford, D. L., 1996 Phylogenetic inference, pp. 407–514 in
Molecular Systematics, edited by D. Hill, C. Moritzand B. Mable.
Sinauuer Associetes, Sunderland, MA.
Taylor, J. W., and M. C. Fisher, 2003 Fungal multilocus sequence
typ-ing—it’s not just for bacteria. Curr. Opin. Microbiol.6:351–356. Taylor, J. W., D. M. Geiser, A. Burt and V. Koufopanou,
1999a The evolutionary biology and population genetics
un-derlying fungal strain typing. Clin. Microbiol. Rev.12:126–146. Taylor, J. W., D. J. Jacobsonand M. C. Fisher, 1999b The
evolu-tion of asexual fungi: reproducevolu-tion, speciaevolu-tion, and classifica-tion. Annu. Rev. Phytopathol.37:197–246.
Tibayreng, M., F. Kjellbergand F. J. Ayala, 1990 A clonal theory
of parasitic protozoa: the population structures ofEntamoeba,
Giardia,Leishmania,Naegleria,Plasmodium,Trichomonas, and Trypa-nosomaand their medical and taxonomical consequences. Proc.
Natl. Acad. Sci. USA87:2414–2418.
Xu, J., 2005 Cost of interacting with sexual partners in a facultative
sexual microbe. Genetics171:1597–1604.
Xu, J., and T. G. Mitchell, 2003 Comparative gene genealogical
analyses of strains of serotype AD identify recombination in pop-ulations of serotypes A and D in the human pathogenic yeast
Cryptococcus neoformans.Microbiology149:2147–2154.
Xu, J., R. Vilgalysand T. G. Mitchell, 2000 Multiple gene
gene-alogies reveal recent dispersion and hybridization in the human pathogenic fungusCryptococcus neoformans.Mol. Ecol.9:1471– 1481.
Xu, J., G. Luo, R. J. Vilgalys, M. E. Brandtand T. G. Mitchell,
2002 Multiple origins of hybrid strains of Cryptococcus
neofor-manswith serotype AD. Microbiology148:203–212.