ABSTRACT
BROWN, VICTORIA LIN. Optimization of Matrix Enhanced-Surface Assisted Laser Desorption Ionization Mass Spectrometry Imaging (ME-SALDI MSI) for Preliminary Studies Involving Supported Lipid Bilayers. (Under the direction of Lin He).
Research has shown that lipids, the building blocks of cellular membranes, can laterally organize into highly ordered domains upon activation from external stimuli. Imaging techniques such as atomic force- and fluorescence microscopy provide great insight into lipid domain formation within cell membrane surfaces, however, they lack the ability to simultaneously detect and identify species involved in domain formation. Mass spectrometry imaging (MSI), a complementary label-free surface characterization technique, is a powerful tool that provides the identity and spatial locale of molecules within a sample. In regards to lipidomics, MSI has emerged as a robust instrumentation platform that allows for the simultaneous detection of intact lipids within cells, biological tissues, and biomimetic systems. As a soft ionization method, matrix assisted laser desorption ionization (MALDI) is often coupled with MSI for lipidomics applications; however, due to the matrix-related noise in the low molecular weight regime, many efforts have been put forth to reduce matrix interference in lipid detection. Particular focus has been placed on using porous silicon (pSi) for surface assisted laser desorption ionization (SALDI) as the solid pSi surface serves as an energy transfer medium for enhanced desorption/ionization of analytes.
Optimization of Matrix Enhanced-Surface Assisted Laser Desorption Ionization Mass Spectrometry Imaging (ME-SALDI MSI) for Preliminary Studies Involving
Supported Lipid Bilayers
by
Victoria L. Brown
A thesis submitted to the Graduate Faculty of North Carolina State University
in partial fulfillment of the requirements for the degree of
Master of Science
Chemistry
Raleigh, North Carolina 2014
APPROVED BY:
_______________________________ ______________________________ Dr. David C. Muddiman Dr. Gufeng Wang
DEDICATION
BIOGRAPHY
Born: 10 May 1989
Parents: Alice and Michael J. Brown Siblings: Matthew Brown
High School: Paul VI High School (graduated 2007) Undergraduate: James Madison University
ACKNOWLEDGMENTS
I would first like to thank my advisor, Dr. Lin He, for all of her guidance and support throughout my graduate career. Through her encouragement, I have been given the opportunity to grow as an independent thinker, researcher, and writer. I would like to thank my group members (Tom Chase, Tara Moening, Antoine Levy, Kangshu Zhan, Nathalia Ortiz and Frederick Jaeger) for their friendship and scientific criticism.
I am very grateful to the Muddiman Lab, particularly Dr. Guillaume Robichaud for his help with the MSiReader™ software and Amber Cook, for her support and assistance with statistical analyses. To the NCSU Mass Spectrometry Facility, I thank you for allowing me to work in the facility and also for your assistance with instrument troubleshooting and repairs. I also thank Dr. Eva Johannes from the Cellular and Molecular Imaging Facility for her extensive help with the confocal microscopy experiments. I acknowledge the Analytical Instrument Facility for their help with SEM characterization.
I also thank my committee members, Dr. David Muddiman and Dr. Gufeng Wang, who have given me extremely valuable guidance during my graduate studies. I would like to acknowledge my professors from James Madison University who pushed me to take the initiative to pursue a career in graduate school.
TABLE OF CONTENTS
LIST OF TABLES………..vi
LIST OF FIGURES………...vii
LIST OF ABBREVATIONS……….xii
CHAPTER 1. BACKGROUND AND SIGNIFICANCE 1.1 Matrix Assisted Laser Desorption Ionization (MALDI)……….1
1.2 Surface Assisted Laser Desorption Ionization (SALDI) ………6
1.3 Mass Spectrometry Imaging (MSI)………..….8
1.4 The Importance of MSI in Lipidomics………...11
1.5 Lipid Microdomains (Rafts) in Cellular Membranes………13
1.6 Fluorescence Recovery After Photobleaching (FRAP) ……….14
1.7 Motivation………...………...15
References………...………17
CHAPTER 2. COMPARISON OF POROUS SILICON (pSi) TECHNIQUES FOR ENHANCED LIPID DETECTION FOR MASS SPECTROMETRY IMAGING (MSI) APPLICATIONS 2.1 Introduction………..………23
2.2 Experimental ………..………..23
2.3 Results and Discussion 2.3.1 pSi Substrate Fabrication……….…………28
2.3.2 DPPC Detection Using Different pSi Substrates……….35
2.3.3 Parameter Optimization for n-type and p-type ME-SALDI.………41
2.3.4 Comparison of Results for n-type and p-type ME-SALDI………….44
2.4 Conclusions………...………46
References………...………47
CHAPTER 3. DETERMINATION OF THE LOWER LIMIT OF DETECTION (LOD) ON N-TYPE AND P-TYPE ME-SALDI SUBSTRATES 3.1 Introduction………..……49
3.2 Experimental ………..……..50
3.3 Results and Discussion 3.3.1 Theoretical Calculations for Necessary Limit of Detection of Lipids in SLBs………...………. 52
3.3.2 LOD on DPPC……...……….53
3.3.3 Intra-substrate and Inter-substrate variability………..56
3.4 Conclusions………...………69 References………...………70
CHAPTER 4. FLUORESCENCE RECOVERY AFTER PHOTOBLEACHING (FRAP) CHARACTERIZATION OF DPPC AND DOPC LIPID BILAYERS ON FLAT AND POROUS SILICON (pSi) SUPPORTS
4.1 Introduction………..………71 4.2 Experimental ………..………..72 4.3 Results and Discussion
LIST OF TABLES
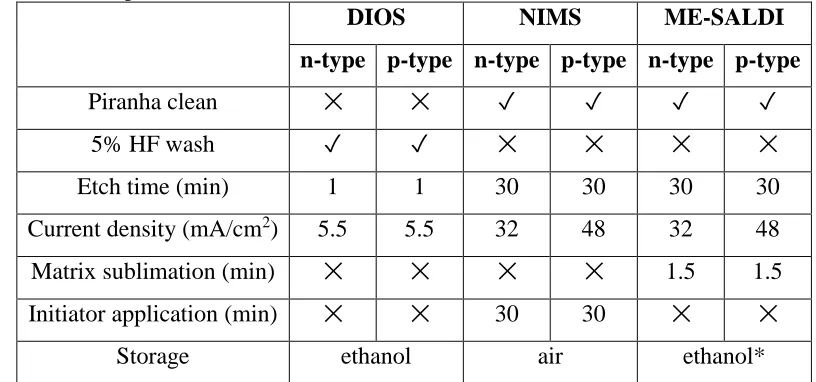
Table 2.1 Comparison of preparation parameters and storage conditions for DIOS, NIMS, and ME-SALDI pSi substrates………29 Table 2.2 Summary of pore features for DIOS and NIMS substrates……….32 Table 2.3 Summary of p-values obtained from the one-way ANOVA analyses for DHB
variation………...40 Table 2.4 Comparison of DPPC:PC ion ratios for S/N and PH (laser 4300) between
n-type and p-n-type ME-SALDI substrates………...…….45 Table 3.1A Normalized and raw data for n-type ME-SALDI (IV = independent
variable)……….…..59
Table 3.1B Normalized and raw data for p-type ME-SALDI (IV = independent
variable)………...60 Table 3.2 One-way ANOVA results for n-type and p-type ME-SALDI at each
concentration point tested in the LOD experiments……….……....62 Table 3.3 Comparison of LOD values for n-type and p-type ME-SALDI substrates……65 Table 3.4 P-values obtained from a one-way ANOVA for DOPC inter-substrate variance………67 Table 3.5 Comparison of calculated LOD values for DPPC and DOPC on n-type
LIST OF FIGURES
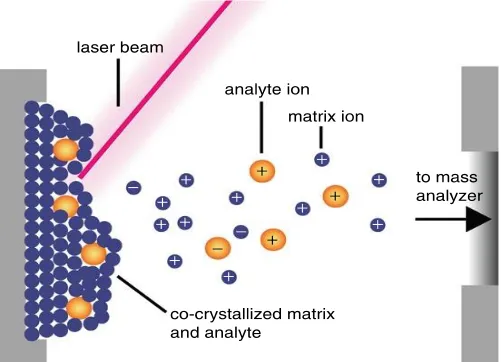
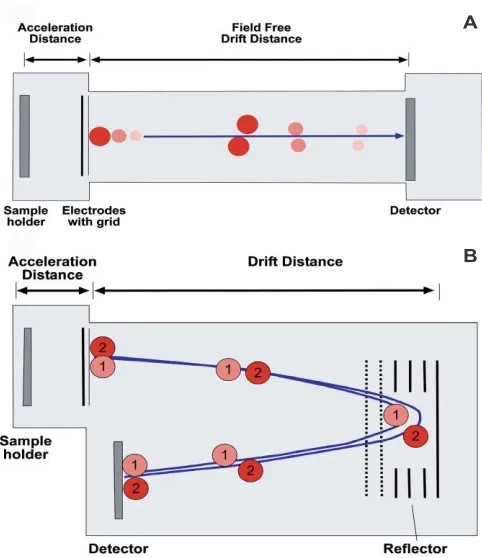
Figure 1.1 Schematic of the desorption/ionization process in MALDI ……….1 Figure 1.2 Schematic of a TOF mass analyzer in linear mode (A) and reflectron mode
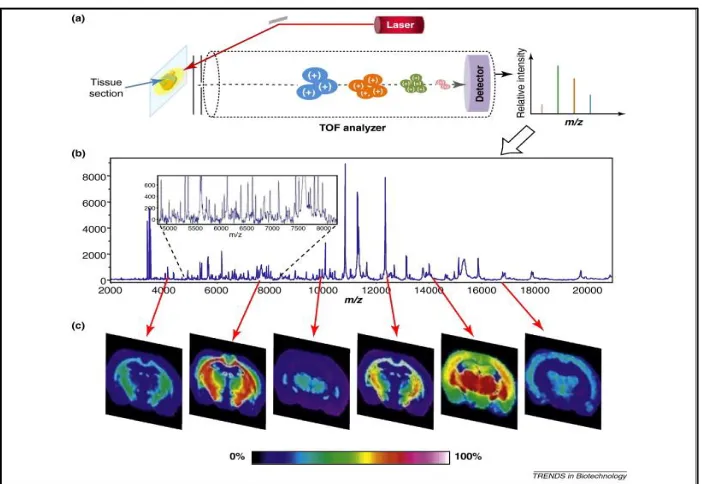
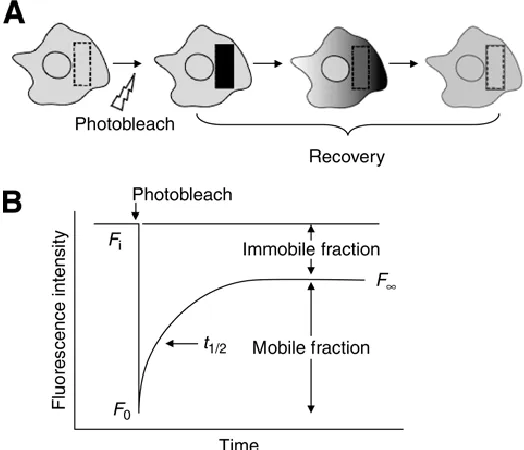
(B)………..3 Figure 1.3 A schematic representation of the MSI process.54 A laser is fired at a tissue sample atop a conductive substrate in a raster fashion to initiate the desorption and ionization process. Desorbed/ionized analytes then travel through the TOF tube, are separated, and their flight times are converted to a m/z ratio (A). A representative mass spectrum from the tissue sample illustrates the various ions detected over a certain mass range; the inset highlights the complexity within that spectrum (B). Molecular ion maps can be made using an average spectrum from the entire tissue section. The difference in spatial locale and intensity of specific molecules can be shown based on their specific m/z ratio (C).………...9 Figure 1.4 Schematic representation of a confocal FRAP experiment whereby a select region area of molecules is irreversibly photobleached and the diffusion of adjacent fluorescence molecules is monitored over time (A). The normalized FRAP curve illustrates two characteristic parameters of the fluorescence recovery: (t1/2), which is related to the diffusion coefficient, and the mobile fraction, which corresponds to the fraction of molecules that are able to diffuse over the time course of the recovery (B).86 ………...15 Figure 2.1 Schematic representation of the Teflon etching cell used for pSi substrate fabrication.………...25
substrates. Panel C and F show a comparison between DIOS and NIMS substrates, respectively. Note that the error bars in panel F were omitted for clarity………...34 Figure 2.6 Experimental design illustrating the 2x2 pattern used to drop-coat DPPC
solutions (A). Chemical structure of DPPC (B). Representative mass spectrum of DPPC from a spot check prior to MSI (C). Reconstructed 2D ion maps of DPPC spotted on a n-type DIOS substrate show signal from the DPPC fragment peak (D) and the intact DPPC ion (E)………...35 Figure 2.7 Representative mass spectrum from a spot check on the NIMS (BisF17 initiator) substrate prior to MSI (A); the starred feature is indicative of the BisF17 related ion (m/z = 185.1) Reconstructed 2D ion map of m/z 185 (B)..36 Figure 2.8 Chemical structure of APDMES (A) and a representative spot check spectrum from the NIMS (APDMES initiator) substrate (B)………...38 Figure 2.9 Representative spot check spectrum of DPPC (m/z = 734.5) spotted on a n-type ME-SALDI substrate (A) and the reconstructed 2D ion map of DPPC (B)…...39 Figure 2.10 Comparison of DHB signal intensity within and between n-type ME-SALDI (A, ☐) and p-type ME-SALDI (B, )……….40
Figure 2.11 Plots depicting the change in PH (A,B) and S/N (C,D) for the intact DPPC ion () and the PC headgroup fragment () on a n-type ME-SALDI substrate in response to different laser intensities and number of shots fired per spectrum collected………...42 Figure 2.12 Plots depicting the change in PH (A,B) and S/N (C,D) for the intact DPPC ion () and the PC headgroup fragment () on a p-type ME-SALDI substrate in response to different laser intensities and number of shots fired per spectrum collected………...44 Figure 2.13 Comparison of DPPC:PC ion ratio values for S/N (A) and PH (B) in n-type () and p-type () ME-SALDI………..45
distance than the diameter of the laser; this method can be used to push the achievable resolution of the instrumentation (C)…….………54 Figure 3.3 Representative spot check spectra of DPPC on n-type and p-type ME-SALDI (A, B). The corresponding 2D images show the PC headgroup fragment (m/z = 184.1), the intact DPPC ion (m/z 734.5) and the DPPC salt adduct (m/z = 756.5)………...55
Figure 3.4 Schematic outlining the components within each MS experiment………56 Figure 3.5 Box plot displaying the spread of the response as a function of concentration, replicate and pSi type (A). Panel B displays the ANOVA results and panel C shows the breakdown of the variance components………...61 Figure 3.6 Schematic depiction of the ROIs selected within each concentration spot on
n-type (A) and p-n-type (B) ME-SALDI substrates; the numbers within each concentration spot correspond to their position within the raster scan. The plots show the effect of the raster on DPPC signal intensity at 0.5µM (), 1µM (), 5µM () and 50µM () for each replicate………...63 Figure 3.7 DPPC calibration curve for n-type ME-SALDI () and p-type ME-SALDI ()………...64
Figure 3.8 Chemical structure of 1,2-dioleoyl-sn-glycero-3-phosphocholine (18:1, DOPC) (m/z = 786.5)……….66 Figure 3.9 Representative spot check spectrum of DOPC spotted on a n-type ME-SALDI substrate. The 2D images depict the PC headgroup fragment (m/z = 184.1), the intact DOPC ion (m/z = 786.5) and the DOPC sodium adduct (m/z = 809.5)..66 Figure 3.10 Comparison of the DPPC () and DOPC () molecular ion signal intensity on n-type ME-SALDI………...68 Figure 4.1 Schematic of the vesicle fusion process (cross-section view)………...74 Figure 4.2 Chemical structure of (A) 1,2-dipalmitoyl-sn-glycero-3-phosphocholine
(DPPC, 16:0) and (B) 1,2-dioleoyl-sn-glycero-3-phosphocholine (DOPC,
18:1)……….76
transitions.19 (Note that So and Ld are synonymous with Lβ and Lα, respectively)……….76 Figure 4.4 Confocal microscopy images from the FRAP characterization of DPPC and DOPC bilayers on flat silicon supports. Before photobleachimg, pre-bleach images were taken for DPPC (A) and DOPC (D). The photobleached ROIs and the fluorescence recovery images for each SLB are shown in panels B and C, and panels E and F, respectively. Scale bar = 15 µm……….77 Figure 4.5 Normalized FRAP curves for DPPC replicates (A) and DOPC replicates (B)..78 Figure 4.6 FRAP recovery curves for replicates of flat silicon supported DPPC bilayers (A, B) and DOPC bilayers (C, D) fitted to Equation 4.3…..……….80 Figure 4.7 Confocal microscopy images of pSi supported DPPC bilayers (A) and
LIST OF ABBREVIATIONS
AFM atomic force microscopy ANOVA analysis of variance
APDMES 3-aminopropyldimethylethoxysilane
BisF17 Bis(heptadecafluoro-1,1,2,2-tetrahydrodecyl)tetramethyldisiloxane DHB 2,5-dihydroxybenzoic acid
DIOS desorption/ionization on silicon
DOPC 1,2-dioleoyl-sn-glycero-3-phosphocholine DPPC 1,2-dipalmitoyl-sn-glycero-3-phosphocholine FRAP fluorescence recovery after photobleaching MALDI matrix-assisted laser desorption/ionization MSI mass spectrometry imaging
NIMS nanostructured initiator mass spectrometry PBS phosphate buffered saline
pSi porous silicon
SALDI surface-assisted laser desorption/ionization SIMS secondary ion mass spectrometry
CHAPTER 1. BACKGROUND AND SIGNIFICANCE
1.1Matrix Assisted Laser Desorption Ionization (MALDI)
Since its inception in the 1980s, matrix assisted laser desorption ionization (MALDI) has evolved into a dynamic and versatile mass spectrometry (MS) platform.1,2 MALDI matrices, commonly aromatic organic acids, serve to alleviate analytes from the harsh conditions of the laser beam and to facilitate intact desorption/ionization of analytes, thus making MALDI a “soft” ionization technique. Due to its ability to desorb/ionize intact molecules, MALDI possesses a detectable mass range that spans from small molecular weight (MW) metabolites to proteins and macromolecules with MWs reaching hundreds of thousands of Daltons. Soft ionization techniques such as MALDI and electrospray have immensely transformed the landscape of MS within the scientific community as it allows for comprehensive characterization, quantification, and qualification of complex samples. As a high-throughput platform with routine detection limits in the low femtomole to attomole range, MALDI has been utilized in a wide array of applications involving lipidomics, proteomics, metabolomics, materials science and forensics.3-9
Figure 1.2. Schematic of a TOF mass analyzer in linear mode (A) and reflectron mode (B).14
Other mass analyzers, such as Fourier transform ion cyclotron resonance (FTICR), orbitrap, and classic triple quadrupole (QqQ) offer complementary benefits when coupled with MALDI. For example, high mass measurement accuracy and high resolving power can be achieved with FTICR, however it has a significantly lower throughput in comparison to TOF.15-17 Orbitrap mass analyzers are often coupled with MALDI as they offer high resolving power and accurate mass detection (≤ 3ppm); these mass analyzers have also demonstrated their ability to resolve isobaric species, which is particularly important for the identification of small molecules (such as lipids) that exhibit high mass defects.18 In order to achieve such accurate mass detection, throughput must be compromised as the trapping of ion packets and subsequent scanning requires longer measurement times.19 Although QqQ mass analyzers require an a priori knowledge of a particular m/z range, they allow for extremely
high-A
throughput screening of desired analytes of interest.20 There are also many hybrid mass analyzer technologies that have been paired with MALDI, the primary MS analyzer used in this study is based on TOF technology.
Regardless of the selection of mass analyzer, analyte ionization is a critical step in MS analysis. Due to the complex concomitant processes that occur in the desorption/ionization event, the physical dynamics of matrix/analyte desorption remain to be one of the most challenging occurrences to mechanistically describe within MALDI. Since the birth of MALDI, comprehensive studies and molecular simulations have shed light on the desorption process in hopes to paint a more thorough picture of the intricacies involved. Briefly, it is believed that when a laser is fired at a mixture of matrix and analyte molecules, a rapid local heating occurs, often reaching temperatures up to or past 600 K within a nanosecond time scale.9,21 Due to the strong absorption coefficient of the matrix, the photon energy absorbed causes rapid heating, followed by an ejection, or ablation, of material that contains both neutral and ionic species. The expansion of this dense plume of material takes place on the sub-microsecond time scale, and is thought to be the place where many complex events occur. Factors that greatly impact the desorption process include: the phase transition of the solid material, the excited state dynamics of the matrix, experimental parameters such as the laser irradiance, the penetration depth of the laser into the sample and matrix to analyte concentrations, etc. Studies have shown that laser fluence and laser pulse duration greatly affect how materials desorb, namely in that above certain thresholds, thermal and mechanical stress can cause ejection of clusters and/or particulates of solid material.9,22-26
molecules pool their electronic excitation energy to generate a single matrix radical ion.9 Other proposed sources for primary ion formation include: disproportionation between two matrix molecules, preformed ions during sample preparation and primary ion formation during the rapid heating within the thermal desorption process.9,21,25
Secondary ion formation arises from charge transfer within the MALDI plume, or the rapid solid-to-gas phase expansion of ablated material. In this highly dense plume of material, it is well known that analyte ionization can occur via proton transfer between primary ions and neutral analyte molecules, collision-induced proton transfer between acidic matrix molecules and analytes and gas-phase cationization.9,21 In MALDI, singly charged ions are typically the most dominant charge state detected in analyses. In regards to large biomolecules, this observation can be explained by the “lucky survivor” model, which states that proteins retain their in-solution charge state when co-crystallized with matrix. Upon ablation in the MALDI plume, a highly protonated protein would undergo electron neutralization in the gas phase until the analyte was carrying only one excess charge, thus becoming the lucky survivor of the neutralization process.27,28 A later extension of the lucky survivor model included the cluster model, which proposed that pre-charged analytes are desorbed with clusters of matrix molecules, followed by the desolvation of matrix molecules in the gas phase and subsequent generation of analyte ions.9,29 Another noteworthy model is the matrix suppression effect; this involves complete suppression of matrix ions when a certain amount of analyte is present.21,25 While the proposed models for ion formation may not factor in every scenario within the MALDI process, each respective theory offers invaluable insight into mechanisms and complex pathways that occur during desorption/ionization.
analyte and matrix concentrations, and matrix crystallization patterns are all factors that must be considered when performing MALDI experiments. Using the dried-droplet method, matrices can dry in an inhomogeneous layer and lead to “sweet spots”, whereby the best signal is gained from certain locations of matrix crystals; this feature becomes problematic as results are user-dependent and shot-to-shot reproducibility is diminished.27,30 Further limitations of using matrix for LDI include interference in the low MW regime and matrix-related background noise. Although many novel matrix variations such as ionic additives,31 binary matrix mixtures,32,33 and high MW matrices,34 have been created to tailor towards small MW analysis, increasing research interests involving low MW species have led to a surge in novel techniques that stray away from the use of matrix.
1.2Surface Assisted Laser Desorption Ionization (SALDI)
Developed in parallel to MALDI, surface-assisted laser desorption/ionization (SALDI) offers a matrix-free approach to LDI mass spectrometry. Initial efforts in developing a surface-based method for MS involved using an inorganic matrix composed of 30 nm cobalt particles suspended in glycerol, which resulted in the detection of proteins exceeding masses of 20,000 Da.2,35 Many materials have since been tested as viable candidates for SALDI analyses, some of which include: Au, Si, TiO2, Zn, carbon nanotubes, graphite and nanostructured thin metal films.35-41The first successful and strictly matrix-free SALDI method was introduced in 1999 by the Siuzdak group, whereby porous silicon (pSi) was utilized as the energy transfer medium to assist in analyte desorption/ionization. More commonly known as desorption ionization on silicon (DIOS), these pSi substrates initially demonstrated their ability to detect picomole to high femtomole amounts of intact molecular species without the presence of matrix.42 In addition, a diverse group of compounds such as carbohydrates, small MW drug molecules, glycolipids, peptides and natural products were successfully analyzed on DIOS surfaces—thus exemplifying its versatility for MS applications.35,42
photoluminescent properties upon exposure to UV light; this property plays a large role in the desorption/ionization process in laser-based mass spectrometry. Additional properties of the pSi substrate, such as morphology and porosity, are dependent on factors such as the silicon precursor dopant type and level, applied current density, etching time and etching solution.35,42,44
In SALDI, matrix-free samples are deposited directly onto porous surfaces prior to MS analysis. The absence of matrix results in the removal of low MW background noise, thus making detection of small MW species more facile to accomplish. Despite the absence of organic matrix, the unique properties of pSi permit SALDI to be a soft ionization technique for laser-based MS. As in MALDI, the desorption/ionization process in SALDI is still heavily debated, but extensive research has helped shed light on this dynamic process. Many reports have attributed analyte desorption/ionization to the electronic and physical properties of porous silicon, specifically its large surface area, low thermal conductivity and ability to absorb UV energy.35,42 In comparison to bulk silicon, pSi possesses an ability to confine deposited energy within its pore walls, thus allowing it to reach a given temperature much faster with a lower laser fluence input. Reports have attributed the rapid heating of the pore walls as one of the main facilitators of analyte desorption in SALDI. Briefly, the laser pulse-induced heating of the pore walls will cause an energy transfer from the substrate to the analytes, thus enabling desorption. It should be noted that desorption can occur through a “dry” or “wet” process, where the former relates to direct analyte desorption from the pSi and the latter pertains to a plume formation caused by trapped solvent molecules.45,46 Since there is no matrix present in SALDI, ionization is thought to occur through existing surface charges on the pSi surface or through solvent-analyte interactions within the plume. Additional factors that have been found to play a role in ionization include: analyte proton affinity, pore depth, surface roughness, and the propensity of the substrate to form free electron/hole pairs.46-48
examples of such innovations.35,37,45,49-52 One of the most successful extensions of DIOS that has emerged is nanostructured initiator mass spectrometry (NIMS), which uses a UV-transparent, non-ionizable liquid initiator atop pSi to assist in the desorption/ionization process.53 After samples are directly deposited atop the initiator surface, they undergo the desorption/ionization process upon initiator vaporization, which is prompted by the input of laser energy. Due to the ease of sample preparation, increased substrate reproducibility, reduced analyte fragmentation and flexibility for MS applications, NIMS has become a widely used matrix-free method for mass spectrometric studies. Combining the strength of NIMS with conventional MALDI technique by applying an ultrathin layer of matrix atop pSi substrates, we have previously demonstrated a matrix-enhanced (ME)-SALDI method that exhibits little matrix background but significantly enhanced ionization efficiency for low mass analytes.29, 56
1.3Mass Spectrometry Imaging (MSI)
Figure 1.3. A schematic representation of the MSI process.54 A laser is fired at a tissue sample atop a conductive substrate in a raster fashion to initiate the desorption and ionization process. Desorbed/ionized analytes then travel through the TOF tube, are separated, and their flight times are converted to a m/z ratio (A). A representative mass spectrum from the tissue sample illustrates the various ions detected over a certain mass range; the inset highlights the complexity within that spectrum (B). Molecular ion maps can be made using an average spectrum from the entire tissue section. The difference in spatial locale and intensity of specific molecules can be shown based on their specific m/z ratio (C).
and instrumental aspects of MSI have fostered interdisciplinary collaboration in fields such as materials science, engineering, and bioinformatics.
The initial development of MSI utilized MALDI as an ionization source, and was primarily focused on mapping proteins and peptides within samples such as tissues and cells.55 Due to the increased desire for small molecule detection for biomarker discovery, pharmaceutical and clinical applications, remarkable technological innovations have been made to improve the analysis of low MW compounds. Advancements in laser-based and ambient ionization sources have allowed techniques such as secondary ion mass spectrometry (SIMS) and desorption electrospray ionization (DESI) to greatly improve the imaging of small molecules.56 Additionally, the coupling of DIOS, NIMS, matrix-enhanced surfaces and other SALDI substrates with MSI has contributed enormously to the detection and quantification of small molecules. It should be noted that advances in mass analyzer technology have been pivotal in the improvement of mass resolving power, mass measurement accuracy, sensitivity and dynamic range within mass spectrometers.3,57
Due to the breadth of applications MSI can benefit, sample collection and preparation is very much dependent on the goals and type of project. Regardless of the means of sample acquisition, proper handling and preparation of samples is vital in MSI studies; preservation of a sample’s molecular morphology is a necessity in order to obtain reproducible and reliable results. In cases where matrix is applied to surfaces such as a tissue slice, the homogeneity and physical state of the matrix is a major aspect of concern. Inhomogeneous matrix application can cause inconsistent signal across a surface, whereas solvent-based matrix deposition has the potential to cause analyte migration or redistribution within samples. Previous work in our lab has shown that homogenous, solvent-free application of matrix can be achieved through sublimation, which has abated concern over solvent-induced analyte migration and has been beneficial for small molecule analysis.58
SALDI-MSI experiments using DIOS achieved spatial resolutions between 20-30 µm60; however, NIMS has improved the attainable spatial resolution on pSi, extending it towards the 10-20 µm range.61 Ambient ionization sources like DESI require no sample pretreatment, however, its spatial resolution averages between 50-200 µm, which is much lower than MALDI or SIMS. The recent development of nanospray (nano)-DESI has greatly improved spatial resolution limits within ambient ionization techniques, demonstrating values as low as 12 µm.62 The disparity of spatial resolution between these methods can be attributed to factors such as high vacuum or ambient environments, diameter and type of laser beam, laser footprint, presence of matrix, surface pretreatment, and the samples being analyzed.
Despite its emergence as a powerful analytical platform, inherent limitations still exist within MSI. By nature, mass spectrometry is a destructive technique. Imaging studies that involve tissue sections or cells are invasive, most often requiring biopsies or post-mortem sample collection. Instrument accessibility is a major determinant for achievable sensitivity, accuracy, resolution and throughput. Variation between and within samples, sample preparation and user expertise will also have a major impact on the quality and reproducibility of results. Notwithstanding these drawbacks, the unique analytical capabilities of MSI have allowed it to become a prominent tool within research and academia.
1.4 The Importance of MSI in Lipidomics
spectroscopy is a powerful and high throughput tool that allows for the analysis of lipid-protein interactions and structural dynamics of purified lipids. However, NMR is limited in terms of sensitivity and ability due to the restricted movement of lipids within macromolecular structures.63 While LC-MS is a robust tool that can achieve near-global analysis of complex lipids mixtures (e.g. quantification and structural identity), digestion, extraction, and purification steps are arduous and cause the loss of lipid distribution across the biological sample.4,63 In addition to the ability to monitor lateral movement of lipids within biological and synthetic samples for in vivo and in vitro studies, fluorescence microscopy techniques provide enormous insight into lipid-protein binding and their diffusion behaviors.64 Nevertheless, due to its requirements of fluorescent tags, it is difficult to analyze a complex mixture of lipids within a given sample using this technique. Additionally, fluorescence microscopy cannot yield the specific structural identity of lipids.
resolution observed in MALDI-MSI, it is a much softer ionization method than SIMS that allows for the simultaneous detection of intact lipids. For lipidomics studies, MALDI-MSI offers great dexterity in regards to the intact detection of lipids that have a propensity to fragment even in the presence of matrix. For example, the use of an ionic liquid matrix has allowed for the intact detection of gangliosides in mouse brain samples, whose sialic acid residues are known to readily cleave using MALDI.70 As MALDI-MSI possesses the ability to simultaneously detect and visualize intact lipid species from complex mixtures, it has rooted itself as an indispensible tool within the lipidomics field.
1.5 Lipid Microdomains (Rafts) in Cellular Membranes
1.6 Fluorescence Recovery After Photobleaching (FRAP)
Figure 1.4. Schematic representation of a confocal FRAP experiment whereby a select area of molecules is irreversibly photobleached and the diffusion of adjacent fluorescence molecules is monitored over time (A). The normalized FRAP curve illustrates two characteristic parameters of the fluorescence recovery: (t1/2), which is related to the diffusion coefficient, and the mobile fraction, which corresponds to the fraction of molecules that are able to diffuse over the time course of the recovery (B).86
1.7 Motivation
The objective of this project is to explore the potential of utilizing M(S)ALDI-MSI as a dynamic tool to investigate lipid raft formation on SLBs. M(S)ALDI-MSI are complementary techniques that can allow for the detection of lipid-specific head-groups as well as intact lipids. In order to ascertain the viability of the characterization methods being employed, the following goals were defined and explored in detail:
(1) Evaluate DIOS, NIMS, and matrix-enhanced SALDI (ME-SALDI), three different SALDI-MS techniques, and determine the efficacy of each technique for intact lipid detection.
surface. Establishing the lowest limit of detection is a necessity, as it will define the technical limitation of the proposed tools for SLB characterization.
References
(1) Karas, M.; Bachmann, D.; Bahr, U.; Hillenkamp, F. Int. J. Mass Spectrom. Ion Processes 1987, 78, 53.
(2) Tanaka, K.; Waki, H.; Ido, Y.; Akita, S.; Yoshida, Y.; Yoshida, T.; Matsuo, T. Rapid Comm. Mass Spectrom. 1988, 2, 151.
(3) McDonnell, L. A.; Heeren, R. M. A. Mass Spectrom. Rev. 2007, 26, 606.
(4) Goto-Inoue, N. H., T.; Zaima, N.; Setou, M. Biochim. Biophys. Acta 2011, 1811, 961. (5) Han, X. A., A.; Yates, J.R. Curr. Opin. Chem. Biol. 2008, 12, 483.\
(6) Musshoff, F.; Arrey, T.; Strupat, K. Drug Test. Anal. 2013, 5, 361. (7) Neubert, P.; Walch, A. Expert Rev. of Proteomics 2013, 10, 259.
(8) Amantonico, A.; Urban, P. L.; Fagerer, S. R.; Balabin, R. M.; Zenobi, R. Anal. Chem.
2010, 82, 7394.
(9) Knochenmuss, R. Analyst 2006, 131, 966.
(10) Shah, B.; Kozlowski, R.; Han, J.; Borchers, C. In Seed Dormancy; Kermode, A. R., Ed.; Humana Press: 2011; Vol. 773; p 259.
(11) Vestal, M. L.; Juhasz, P.; Martin, S. A. Rapid Comm. Mass Spectrom. 1995, 9, 1044. (12) Kaufmann, R.; Chaurand, P.; Kirsch, D.; Spengler, B. Rapid Comm. Mass Spectrom.
1996, 10, 1199.
(13) Haney, L. L.; Riederer, D. E. Anal. Chim. Acta 1999, 397, 225.
(14) Soares, R.; Franco, C.; Pires, E.; Ventosa, M.; Palhinhas, R.; Koci, K.; Martinho de Almeida, A.; Varela Coelho, A. J. Proteomics 2012, 75, 4190.
(17) Taban, I. M.; Altelaar, A. F. M.; van der Burgt, Y. E. M.; McDonnell, L. A.; Heeren, R. M. A.; Fuchser, J.; Baykut, G. K. J. Am. Soc. Mass Spectrom. 2007, 18, 145. (18) Strupat, K.; Kovtoun, V.; Bui, H.; Viner, R.; Stafford, G.; Horning, S. J. Am. Soc. Mass
Spectrom. 2009, 20, 1451.
(19) Sparvero, L. J.; Amoscato, A. A.; Dixon, C. E.; Long, J. B.; Kochanek, P. M.; Pitt, B. R.; Bayır, H. l.; Kagan, V. E. Chem. Phys. Lipids 2012, 165, 545.
(20) Aebersold, R.; Mann, M. Nature 2003, 422, 198.
(21) Zenobi, R.; Knochenmuss, R. Mass Spectrom. Rev. 1998, 17, 337. (22) Dreisewerd, K. Chem. Rev. 2003, 103, 395.
(23) Handschuh, M.; Nettesheim, S.; Zenobi, R. Appl. Surf. Sci. 1999, 137, 125. (24) Zhigilei, L. V.; Garrison, B. J. Appl Phys. A 1999, 69, S75.
(25) Knochenmuss, R.; Zenobi, R. Chen. Rev. 2002, 103, 441.
(26) Dreisewerd, K.; Schürenberg, M.; Karas, M.; Hillenkamp, F. Int. J. Mass Spectrom. Ion Processes 1996, 154, 171.
(27) Hillenkamp, F.; Karas, M. The MALDI Process and Method. In MALDI MS: A Practical Guide to Instrumentation, Methods and Applications; F. Hillenkamp, F., Peter-Katalinić, J., Eds.; Wiley-VCH Verlag GmbH & Co. KGaA : Weinheim, Germany: 2007; p 1.
(28) Karas, M.; Glückmann, M.; Schäfer, J. J. Mass Spectrom. 2000, 35, 1. (29) Karas, M.; Krüger, R. Chem. Rev. 2003, 103, 427.
(30) Karas, M.; Hillenkamp, F. Anal. Chem. 1988, 60, 2299. (31) Liu, Q.; He, L. J. Am. Soc. Mass Spectrom. 2009, 20, 2229. (32) Guo, Z.; He, L. Anal. Bioanal. Chem. 2007, 387, 1939.
(33) Shanta, S.R.; Zhou, L.-H.; Park, Y.S.; Kim, Y.H.; Kim, Y.; Kim, K.P. Anal. Chem.
(34) Ayorinde, F. O.; Hambright, P.; Porter, T. N.; Keith, Q. L. Rapid Comm. Mass Spectrom. 1999, 13, 2474.
(35) Peterson, D. S. Mass Spectrom. Rev. 2007, 26, 19. (36) Nayak, R.; Knapp, D. R. Anal. Chem. 2010, 82, 7772.
(37) Watanabe, T.; Kawasaki, H.; Yonezawa, T.; Arakawa, R. J. Mass Spectrom. 2008, 43, 1063.
(38) Sunner, J.; Dratz, E.; Chen, Y.C. Anal. Chem. 1995, 67, 4335.
(39) Kraft, P.; Alimpiev, S.; Dratz, E.; Sunner, J. J. Am. Soc. Mass Spectrom. 1998, 9, 912. (40) Xu, S.; Li, Y.; Zou, H.; Qiu, J.; Guo, Z.; Guo, B. Anal. Chem. 2003, 75, 6191.
(41) Arakawa, R.; Kawasaki, H. Analytical Sciences 2010, 26, 1229. (42) Wei, J.; Buriak, J. M.; Siuzdak, G. Nature 1999, 399, 243.
(43) Liu, Q.; Xiao, Y.; He, L. In Mass Spectrometry Imaging; Rubakhin, S. S., Sweedler, J. V., Eds.; Humana Press: 2010; Vol. 656, p 243.
(44) Sailor, M. J. In Porous Silicon in Practice: Preparation, Characterization and Applications; Wiley-VCH Verlag GmbH & Co. KGaA: 2011, p 1.
(45) Vertes, A. In Laser Ablation and its Applications; Phipps, C., Ed.; Springer US: 2007; Vol. 129, p 505.
(46) Xiao, Y.; Retterer, S. T.; Thomas, D. K.; Tao, J.-Y.; He, L. J. Phys. Chem. C 2009,
113, 3076.
(47) Alimpiev, S.; Grechnikov, A.; Sunner, J.; Karavanskii, V.; Simanovsky, Y.; Zhabin, S.; Nikiforov, S. J. Chem. Phys. 2008, 128, 014711.
(48) Law, K. P. Int. J. Mass Spectrom. 2010, 290, 47.
(49) Go, E. P.; Apon, J. V.; Luo, G.; Saghatelian, A.; Daniels, R. H.; Sahi, V.; Dubrow, R.; Cravatt, B. F.; Vertes, A.; Siuzdak, G. Anal. Chem. 2005, 77, 1641.
(51) Lo, C.-Y.; Lin, J.-Y.; Chen, W.-Y.; Chen, C.-T.; Chen, Y.-C. J. Am. Soc. Mass Spectrom.2008, 19, 1014.
(52) Doan, V. V.; Sailor, M. J. Appl. Phys. Lett. 1992, 60, 619.
(53) Northen, T. R.; Yanes, O.; Northen, M. T.; Marrinucci, D.; Uritboonthai, W.; Apon, J.; Golledge, S. L.; Nordstrom, A.; Siuzdak, G. Nature 2007, 449, 1033.
(54) Seeley, E. H. C., R.M. Trends Biotechnol. 2011, 29, 126.
(55) Caprioli, R. M.; Farmer, T. B.; Gile, J. Anal. Chem. 1997, 69, 4751. (56) Watrous, J. D.; Dorrestein, P. C. Nat. Rev. Micro. 2011, 9, 683.
(57) Rubakhin, S. S.; Jurchen, J. C.; Monroe, E. B.; Sweedler, J. V. Drug Discov. Today
2005, 10, 823.
(58) Liu, Q., North Carolina State University, 2009.
(59) Wiseman, J. M.; Ifa, D. R.; Song, Q.; Cooks, R. G. Angew. Chem. Int. Ed. 2006, 45, 7188.
(60) Liu, Q.; Guo, Z.; He, L. Anal. Chem. 2007, 79, 3535.
(61) Greving, M. P.; Patti, G. J.; Siuzdak, G. Anal. Chem. 2010, 83, 2.
(62) Laskin, J.; Heath, B. S.; Roach, P. J.; Cazares, L.; Semmes, O. J. Anal. Chem. 2011,
84, 141.
(63) Wenk, M. R. Nat. Rev. Drug Discov. 2005, 4, 594.
(64) Simons, K. G., M.J. Nat. Rev. Mol. Cell Bio. 2010, 11, 688.
(65) Zemski Berry, K. A. H., J.A.; Barkley, R.M.; Spraggins, J.M.; Caprioli, R.M.; Murphy, R.C. Chem. Rev. 2011, 111, 6491.
(66) Murphy, R. C. A., P.H. Mass Spectrom. Rev. 2011, 30, 579.
(70) Chan, K.; Lanthier, P.; Liu, X.; Sandhu, J. K.; Stanimirovic, D.; Li, J. Anal. Chim, Acta
2009, 639, 57.
(71) Simons, K.; Ikonen, E. Nature 1997, 387, 569.
(72) Simons, K.; Toomre, D. Nat. Rev. Mol. Cell. Biol. 2000, 1, 31. (73) Brown, D. A.; London, E. Annu. Rev. Cell Dev. Biol. 1998, 14, 111. (74) Pike, L. J. J. Lipid Res. 2009, 50, S323.
(75) Dietrich, C.; Bagatolli, L. A.; Volovyk, Z. N.; Thompson, N. L.; Levi, M.; Jacobson, K.; Gratton, E. Biophys. J. 2001, 80, 1417.
(76) Campbell, S. M.; Crowe, S. M.; Mak, J. J. Clin. Virol. 2001, 22, 217.
(77) Liao, Z. G., D. R; Hildreth, J.E. AIDS Res. Hum. Retroviruses 2003, 19, 675.
(78) Liao, Z. C., L.M.; Hampton, R.; Nguyen, D.H.; Hildreth, J.E. AIDS Re.s Hum. Retroviruses 2001, 17, 1009.
(79) Brügger, B.; Glass, B.; Haberkant, P.; Leibrecht, I.; Wieland, F. T.; Kraüsslich, H.G.
Proc. Natl. Acad. Sci. U.S.A. 2006, 103, 2641.
(80) Manes, S.; del Real, G.; Lacalle, R. A.; Lucas, P.; Gomez-Mouton, C.; Sanchez-Palomino, S.; Delgado, R.; Alcami, J.; Mira, E.; Martinez-A, C. EMBO Rep. 2000, 1, 190.
(81) Fantini, J.; Garmy, N.; Mahfoud, R.; Yahi, N. Expert Rev. Mol. Med. 2002, 4, 1. (82) Fittipaldi, A.; Ferrari, A.; Zoppé, M.; Arcangeli, C.; Pellegrini, V.; Beltram, F.; Giacca,
M. J. Biol. Chem. 2003, 278, 34141.
(83) Axelrod, D.; Koppel, D. E.; Schlessinger, J.; Elson, E.; Webb, W. W. Biophys. J. 1976,
16, 1055.
(84) Délèze, J.; Delage, B.; Hentati-Ksibi, O.; Verrecchia, F.; Hervé, J.-C. In Connexin Methods and Protocols; Bruzzone, R., Giaume, C., Eds.; Humana Press: 2001; Vol. 154, p 313.
(87) Richter, R. P.; Brisson, A. R. Biophys. J. 2005, 88, 3422.
CHAPTER 2. COMPARISON OF POROUS SILICON (pSi) TECHNIQUES FOR ENHANCED LIPID DETECTION FOR MASS SPECTROMETRY
IMAGING (MSI) APPLICATIONS
2.1 Introduction
Method sensitivity is a critical factor in any MS-based application. The purpose of implementing porous silicon (pSi) substrates is to exploit the enhanced sensitivity that they offer, particularly in the low MW range. Detection limits using pSi or surface-modified substrates for mass spectrometry imaging (MSI)-based applications have been well reported in the literature. PSi-based ionization methods such as nanostructure initiator mass spectrometry and matrix enhanced-surface assisted laser desorption ionization have reported detection limits in the high attomole to low femtomole range for peptides, carbohydrates and lipids.1-4 Other porous-based materials such as laser engineered graphene and titania nanotubes have exhibited detection limits in the low femtomole regime for biomolecules such as lipids and proteins, respectively.5,6 As for the proposed framework for supported lipid bilayers, it was necessary to investigate the performance of pSi substrates and the sensitivity that each offered. In this chapter, the systematic testing of three different pSi techniques to explore their potential for studying lipid domains on pSi supports is reported. Specifically, DIOS, NIMS, and ME-SALDI were studied to determine which technique offered the best initial sensitivity levels for the model analyte, 1,2-dipalmitoyl-sn-glycero-3-phosphocholine (DPPC). Parameter optimization for DPPC signal detection on n-type and p-type pSi was conducted; the reproducibility of substrate fabrication using DIOS and NIMS etching parameters and matrix sublimation reproducibility for ME-SALDI substrate preparation was studied as well.
2.2 Experimental
(Pittsburg, PA). Ethanol (95%) was purchased from Aaper Alcohol (Shelbyville, KY). Hydrogen peroxide 30% (w/w) (H2O2) was purchased from VWR International, LLC. (Bridgeport, NJ). 1,2-Dipalmitoyl-sn-glycero-3-phosphocholine (DPPC, 16:0) was purchased from Avanti Polar Lipids Inc. (Alabaster, AL). Bis(heptadecafluoro-1,1,2,2-tetrahydrodecyl)tetramethyldisiloxane (BisF17) and 3-aminopropyldimethylethoxysilane (APDMES) initiators was purchased from Gelest, Inc. (Morrisville, PA). 2,5-Dihydroxybenzoic acid (DHB) was purchased from Alfa Aesar (Ward Hill, MA). 18 MΩ deionized (DI) H2O (Millipore, PO) was used for all experiments.
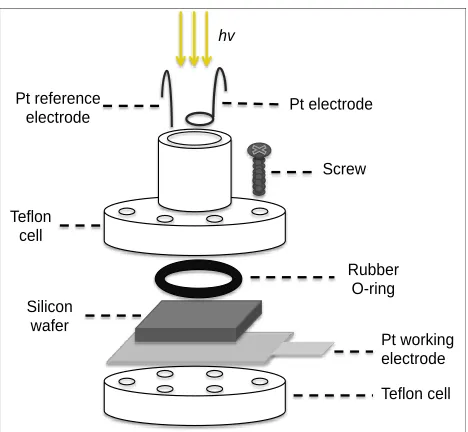
Figure 2.1 Schematic representation of the Teflon etching cell used for pSi substrate fabrication.
NIMS Substrate Fabrication NIMS substrates were prepared using a modified protocol reported in literature.8 Briefly, a 1.5-cm2 silicon wafer was cleaned in piranha solution containing a 2:1 (v/v) ratio of H2SO4 and H2O2 for 30 min, thoroughly washed in 18 MΩ DI H2O and dried with N2. The wafer was electrochemically etched for 30 min without additional light illumination in a 25% HF/ethanol solution with an applied current density of 32 mA/cm2 or 48 mA/cm2 for n-type and p-type Si, respectively. After etching, the prepared pSi substrate was washed thoroughly in ethanol, dried with a stream of N2 and then dried in a 100˚C oven for 5 min. A neat solution of BisF17 (33 µL) or APDMES (33 µL) was pipetted onto the pSi and allowed to soak for 30 min at room temperature (RT) to form the initiator coating. Excess initiator was removed from the pSi by applying a high-flow stream of N2, followed by a 3-5 s drying period in a 100˚C oven; this was repeated 3 times in order to sufficiently remove excess initiator solution. NIMS substrates were stored in closed petri dishes at room temperature and were used within 3 days of initial fabrication.
Teflon cell Pt working electrode Silicon
wafer
Rubber O-ring Teflon
cell
Screw Pt electrode Pt reference
electrode
Matrix-Enhanced (ME)-SALDI Substrate Fabrication N-type and p-type ME-SALDI substrates were electrochemically etched using the aforementioned conditions used for NIMS substrates. A thin layer of matrix was then thermally deposited on the substrate in a sublimation chamber. The sublimation apparatus was prepared as shown in Figure 2.2. Approximately 0.5 mg of DHB was added and evenly spread on the bottom of the sublimation chamber. Using double-sided tape, pSi substrates spotted with the DPPC concentration gradient was attached upside down to the bottom of the condenser that was in direct contact with running water for cooling. An Edwards E2M8 vacuum pump with a vacuum meter was used to provide a controlled vacuum environment in the sublimation chamber. After maintaining the sublimation chamber for 2 min at approximately 50 torr, the apparatus was submerged into a 110˚C oil bath for 1.5 min. Under these temperature and vacuum conditions, DHB immediately vaporized and re-deposited upon contact with the pSi substrate. Once matrix deposition was completed, the sublimation apparatus was removed from the oil bath and the vacuum was slowly released. Substrates coated with matrix were removed from the apparatus and immediately loaded into the MS sample chamber for analysis.
Figure 2.2 Photo of the apparatus used for matrix sublimation and the chemical structure of 2,5-dihydroxybenzoic acid (DHB), the matrix used for these studies.
Matrix
SALDI substrate Cooling H2O inlet Cooling
H2O outlet
Vacuum line
110˚C oil bath
OH O
OH HO
Scanning Electron Microscopy (SEM) Measurements A JEOL JSM-6400F field-emission scanning electron microscope (FE-SEM) with an Everhart-Thornley secondary electron detector was used to examine the surface features of the pSi substrates. An accelerating voltage of 1 kV and a working distance of ~4 mm was used during the image acquisition. The magnification was varied between 500X and 500,000X to gain the best image contrast for each substrate. All substrates were attached to an aluminum block with double-sided conductive tape prior to loading into the instrument. Most substrates were imaged directly for top-down analysis; some substrates were also cleaved in half in order to attain cross-section images of the porous features. Approximately 20 pores and cross-sections from each pSi surface were chosen to measure the relative size distribution of the electrochemically-etched features.
Sample Preparation for MS Measurements Analyte molecules were deposited onto pSi substrates via the drop-coating method. Briefly, DPPC solutions of varying concentration (0.5 µM, 1 µM, 5 µM, and 50 µM) dissolved in chloroform were drop-coated onto separate locations on pSi substrates for MS measurements. For DIOS and NIMS substrates, DPPC was drop-coated after the final preparation step and right before loading into the MS sample chamber; for ME-SALDI substrates, DPPC was drop-coated onto the porous surface prior to matrix-deposition. Prior to drop-coating DPPC solutions, a diamond cutter, washed thoroughly in acetone and ethanol, was used to draw a grid on the pSi surface in order to avoid overlap when spotting solutions.
absolute peak intensities for main lipid ion species in each spectrum were calculated by the instrument manufacturer software. In MS imaging mode,all mass spectra were collected in an automatic MS control mode using the AB Sciex TOF/TOF Imaging software; 50-500 laser shots, as specified in the text, were averaged to yield one accumulated spectrum at each location. Mass spectra were reconstructed into 2D ion maps using the MSiReader™ software.9
2.3 Results and Discussion 2.3.1 pSi Substrate Fabrication
The anodic etching cell is shown in Figure 2.1. Etching of pSi substrates was achieved by applying a fixed current density to the cell, which contains a 25% (v/v) solution of HF/ethanol. The overall reaction mechanism is shown in Reaction 2.1. Table 2.1 lists the preparation and storage conditions for the specific pSi substrates that were investigated in this study. It should be noted that for n-type DIOS, a light source is used to help expedite the hole-generation process due to the short etching time; a light source was not utilized for n-type NIMS due to the longer etching time used to prepare these substrates. Additionally, previous work in our lab has shown that n-type and p-type NIMS cannot be prepared using the same conditions as higher current densities caused rapid surface etching and flaking for n-type NIMS (data not shown).
𝑆𝑖 + 6𝐻𝐹 + ℎ𝑣 → 𝑆𝑖𝐹62−+ 2𝐻++ 2𝐻
2 (𝑅𝑒𝑎𝑐𝑡𝑖𝑜𝑛 2.1)
Table 2.1. Comparison of preparation parameters and storage conditions for DIOS, NIMS, and ME-SALDI pSi substrates.
DIOS NIMS ME-SALDI
n-type p-type n-type p-type n-type p-type
Piranha clean ✕ ✕ ✓ ✓ ✓ ✓
5% HF wash ✓ ✓ ✕ ✕ ✕ ✕
Etch time (min) 1 1 30 30 30 30
Current density (mA/cm2) 5.5 5.5 32 48 32 48 Matrix sublimation (min) ✕ ✕ ✕ ✕ 1.5 1.5 Initiator application (min) ✕ ✕ 30 30 ✕ ✕
Storage ethanol air ethanol*
Our previous studies have shown that the pSi performance as MS substrates is directly related to the substrate porosity.11 Direct inspection of the pSi substrates is therefore the first step to ensure substrate performance: for the n-type DIOS, a dark blue hue is typically indicative of porous trenches being formed on the substrate surface (Figure 2.3A). After etching the p-type DIOS under the same condition, however, the surface was bright yellow in color (Figure 2.3B). Etching of n-type NIMS yielded a dark blue surface; etching of p-type NIMS, on the other hand, yielded a light blue porous surface. It is known that the optical property of a pSi wafer is dictated by its surface porosity; we therefore suspect that the different substrate colors observed positively correlate to certain pore formation characteristics.
Figure 2.3 Optical images depicting the porous surface color of n-type DIOS (A), p-type DIOS (B), n-type NIMS (C) and p-type NIMS (D) substrates.
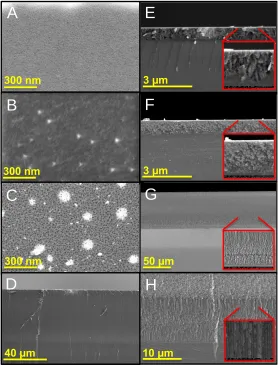
SEM was hence used to determine the average pore diameter and pore depth for each pSi substrate. SEM images of p-type DIOS indicated that undesirable pore formation occurred using the etching conditions applied (Figure 2.4B); this result supports the prior suspicion that the yellow substrate color was suggestive of poor pore formation.12 Pore formation was observed for n-type DIOS as the etching generated a surface possessing a dark blue hue. With respect to n-type DIOS and n-type NIMS, it is clearly evident that the longer etching time leads to an increase in pore depth as the latter substrate has a porous layer more than 15 times as
A
B
Table 2.2. Summary of pore features for DIOS and NIMS substrates.
Substrate Type Average Pore Diameter (nm) Average Pore Depth (µm)
n-type DIOS 9 ± 2 0.9 ± 0.03
p-type DIOS - -
n-type NIMS 17 ± 6 16 ± 0.4
p-type NIMS 14 ± 2 45 ± 0.8
Figure 2.4 Top-down SEM images of n-type DIOS (A), p-type DIOS (B), p-type NIMS (C), and n-type NIMS (D). Cross-section images for n-type DIOS, p-type DIOS, p-type NIMS and n-type NIMS are shown in panels E, F, G and H, respectively. Insets on panels E-H display a zoomed in view of the porous channels.
A
E
B
F
C
D
G
H
300 nm300 nm
300 nm
40 µm
3 µm
3 µm
50 µm
surface; the yellow ring appeared to be similar in color to the p-type DIOS, which may support the notion that the etching time was insufficient for p-type DIOS.
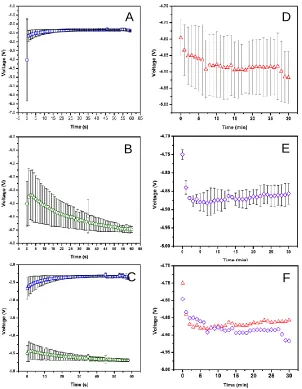
Figure 2.5 Plots depicting the voltage stability during the electrochemical etching of: n-type DIOS (A), p-type DIOS (B), n-type NIMS (D), and p-type NIMS (E) pSi substrates. Panel C and F show a comparison between DIOS and NIMS substrates, respectively. Note that the error bars in panel F were omitted for clarity.
A
B
C
D
E
2.3.2 DPPC Detection Using Different pSi Substrates
Due to its ease of preparation and the previous/extensive work completed in our lab, DIOS substrates were tested first as a potential candidate for studies involving lipid species. Four DPPC solutions over a broad range of concentrations, from 0.5 µM to 50 µM, were prepared and drop-coated on the pSi substrates in a 2x2 spot pattern (Figure 2.6A). Figure 2.6C shows a representative MS spectrum of DPPC from spot check on a n-type DIOS substrate where the PC headgroup is the most pronounced feature observed because the intact DPPC lipid underwent significant fragmentation under the laser condition needed for analyte desorption and the PC headgroup was the primary surviving ion detected. Similarly, Figure 2.6D and 2.6E shows the reconstruction of DPPC spots on the substrate: high concentrations of DPPC spots were clearly observed for the headgroup ion (m/z = 184.1) whereas few ions showed up for the molecular map of m/z= 734.5. As described in detail in the previous section, the shallow pore depth may also be a contributing factor as to why DIOS did not perform well. Due to these results, DIOS was eliminated as a possibility for long-term use for MSI studies.
Figure 2.6 Experimental design illustrating the 2x2 pattern used to drop-coat DPPC solutions (A). Chemical structure of DPPC (B). Representative mass spectrum of DPPC from a spot check prior to MSI (C). Reconstructed 2D ion maps of DPPC spotted on a n-type DIOS substrate show signal from the DPPC fragment peak (D) and the intact DPPC ion (E).
P O -O O N+ O H O O O O
m/z 184
+2H
50 5
1 0.5
*
A B
Nanostructure initiator mass spectrometry (NIMS) has been reported widely throughout the literature to routinely achieve detection limits in the low femtomole range to even the yoctomole range.16 Additionally, NIMS has been demonstrated as a versatile matrix-free platform for MS analysis of various low-mass molecules. NIMS is an adaptation of the original DIOS method, however NIMS utilizes a liquid initiator coating, with the initiator typically being a highly fluorinated, UV-transparent, Teflon-like molecule to facilitate local concentrating of analytes of interest. Like DIOS, NIMS relies on the absorption of the laser energy from the porous material. However, upon the input of laser energy into the sample, the “trapped” initiator molecules in the porous structures of the substrate undergo a rapid vaporization due to the absorption of energy and rapid heating of the porous surface; the rapid vaporization of the initiator molecules subsequently facilitates the desorption/ionization process for analytes under study with minimal fragmentation.16 Since the calculated sensitivity threshold was in the femtomole range, testing NIMS as a candidate for these studies seemed advantageous. Additionally, the preparation of NIMS substrates had been reported to fabricate substrates with more ordered porous structures, which would circumvent the issue seen in DIOS. NIMS substrates were tested using the same concentration range as the previous experiments with DIOS. Figure 2.7 depicts the 2D image from the imaging experiment.
Figure 2.7 Representative mass spectrum from a spot check on the NIMS (BisF17 initiator) substrate prior to MSI (A); the starred feature is indicative of the BisF17 related ion (m/z = 185.1). Reconstructed 2D ion map of m/z 185 (B).
A B
Figure 2.8 Chemical structure of APDMES (A) and a representative spot check spectrum from the NIMS (APDMES initiator) substrate (B).
The third and final candidate that was tested for lipid analysis was a technique that is termed ME-SALDI. As a hybrid ionization approach, ME-SALDI aims to improve the ionization of low MW molecules by combining the beneficial attributes of pSi and MALDI matrices. Briefly, “ME” portion of ME-SALDI utilizes conventional matrices to provide a proton-rich environment to limit destructive overheating of analytes; the “SALDI” portion of ME-SALDI takes advantage of the ability of porous structures to more effectively absorb photons than MALDI matrices. Due to these benefits, it was expected that the hybrid ME-SALDI approach would complement our goals for lipid analysis. Previous scientists in our lab prepared ME-SALDI substrates by following the DIOS preparation parameters. However, in order to keep a smaller pore size to reduce variability during the raster scan, ME-SALDI substrates were etched using the same parameters as NIMS. After etching, a thin layer of matrix (DHB) was sublimed onto the porous surface. The presence of matrix serves to “soften” the harsh environment that the laser induces on the substrate surface. The imaging results for n-type ME-SALDI are shown in Figure 2.9. As depicted, initial ME-SALDI results showed signal for both the intact DPPC lipid and the PC headgroup.
Si NH2
O
3-aminopropyldimethylethoxysilane (APDMES)
Figure 2.9 Representative spot check spectrum of DPPC (m/z = 734.5) spotted on a n-type ME-SALDI substrate (A) and the reconstructed 2D ion map of DPPC (B).
Due to this size of the matrix sublimation chamber, only one pSi substrate could be prepared at a time. To ensure that the matrix sublimation process was reproducible across multiple substrates, statistical analyses were carried out to assess the intra- and inter-substrate variability from matrix deposition. Briefly, three n-type and three p-type ME-SALDI substrates coated with DHB were analyzed in MSI mode. After the imaging was completed, four regions of interest (ROIs) were chosen at separate locations on each substrate, with each ROI containing a minimum of 50 pixels (Figure 2.10). A one-way analysis of variance (ANOVA) test was first used to separately compare the DHB signal intensity for the replicates of the n-type and p-n-type groups The ANOVA test was then used to determine if there was a significant difference in the DHB signal intensity between the substrate groups. Table 2.3 provides a summary of results from the ANOVA test.
B
*
Figure 2.10 Comparison of DHB signal intensity within and between n-type ME-SALDI (A, ☐) and p-type ME-SALDI (B, ).
Table 2.3 Summary of p-values obtained from the one-way ANOVA analyses for DHB variation.
p-value Replicates of n-type 0.53 Replicates of p-type 0.20 n-type vs. p-type 0.30
All p-values obtained from the one-way ANOVA were greater than 0.05. Therefore, it was determined that the sublimation of DHB was not significantly different between replicates or across different substrate types (e.g. n-type and p-type), and that the matrix sublimation technique was reproducible under controlled conditions and could be implemented in further studies.
2.3.3 Parameter Optimization for n-type and p-type ME-SALDI
Upon selection of ME-SALDI as the most suitable method for lipid analysis, parameter optimization for ME-SALDI was conducted to determine the best conditions for DPPC detection. While detection of the intact DPPC ion was ideal for LOD experiments, a major fragment ion of the DPPC headgroup was often observed. Both ionic species, the molecular ion (m/z = 734.5) and the primary fragment phosphocholine (PC) headgroup (m/z = 184.1) were monitored for their corresponding peak heights (PHs) and the signal-to-noise (S/N) ratios as the number of shots per spectrum and the laser intensity were systematically varied (Figures 2.11A-D). Other characteristic MS values, such as mass resolution, mass accuracy, etc, were not measured since the system under study was a simple one-component system. To ensure that enough material would be on the surface for repeated measurements, 5µM of DPPC was spotted onto the pSi surface and the subsequent matrix sublimation was carried out. For each parameter, three measurements were recorded so an average and standard deviation could be calculated.
Figure 2.11 Plots depicting the change in PH (A,B) and S/N (C,D) for the intact DPPC ion () and the PC headgroup fragment () on a n-type ME-SALDI substrate in response to different laser intensities and number of shots fired per spectrum collected.
As shown in Figure 2.11C, the S/N for DPPC and PC remain relatively constant across all shots/spectrum tested, with DPPC exhibiting higher S/N values in general. An increase in laser intensity did not have a pronounced effect on DPPC, however, the S/N for the PC fragment doubled and became comparable in value to its intact counterpart (Figure 2.11D). While the overall DPPC PH and S/N values remain comparable across low and high laser intensities, the PH and S/N for the PC headgroup fragment increase as the laser intensity is increased. These results support the notion that the ME-SALDI technique does, in fact, protect analytes from deterioration and degradation while undergoing harsher instrument conditions.
A B
C D
laser intensity: 4300 laser intensity: 5300
Figure 2.12. Plots depicting the change in PH (A,B) and S/N (C,D) for the intact DPPC ion () and the PC headgroup fragment () on a p-type ME-SALDI substrate in response to different laser intensities and number of shots fired per spectrum collected.
2.3.4 Comparison of Results for n-type and p-type ME-SALDI
After optimization for the n-type and p-type ME-SALDI substrates, it was beneficial to compare the two substrates against each other to gain a general sense of how their sensitivity levels for the intact DPPC ion compared to each other. Particular focus was placed on the results obtained from the 4300 laser intensity as DPPC exhibited higher S/N and PH values at that parameter for both type and p-type substrates. To carry out a direct comparison of n-type and p-n-type ME-SALDI substrates, all PH and S/N values were normalized to the highest recorded value from the n-type and p-type data sets. The normalized values were then plotted as ion intensity ratios to highlight how the tested parameters affected the fragmentation of DPPC (Figure 2.13). A summary of the DPPC:PC ion ratios is shown in Table 2.4. It can be
A B
C D
laser intensity: 4300 laser intensity: 5300
seen that the ion ratios are quite similar across both substrate types, with 50 shots/spectrum yielding the largest ion ratios. Additionally, both substrates exhibit the trend of decreasing PH signal in response to more shots/spectrum. From these observations, it was determined that the optimal parameters to use for future LOD experiments would be a combination of laser intensity of 4300 and 50 shots/spectrum, as they yielded the highest molecular ion S/N ratio without significantly compromising in the absolute ion intensity (PH).
Figure 2.13 Comparison of DPPC:PC ion ratio values for S/N (A) and PH (B) in n-type () and p-type () ME-SALDI.
Table 2.4 Comparison of DPPC:PC ion ratios for S/N and PH (laser 4300) between n-type and p-type ME-SALDI substrates.
S/N Ratio PH Ratio #shots/spectrum n-type p-type n-type p-type
25 0.77 0.55 1 0.65
50 1 0.87 0.64 0.47
100 0.74 0.70 0.32 0.24 200 0.68 0.56 0.17 0.15
2.4 Conclusions
References
(1) Passarelli, M. K.; Ewing, A. G. Curr. Opin. Chem. Biol. 2013, 17, 854.
(2) Liu, Q.; Xiao, Y.; Pagan-Miranda, C.; Chiu, Y. M.; He, L. J. Am. Soc. Mass Spectrom.
2009, 20, 80.
(3) Patti, G. J.; Woo, H.-K.; Yanes, O.; Shriver, L.; Thomas, D.; Uritboonthai, W.; Apon, J. V.; Steenwyk, R.; Manchester, M.; Siuzdak, G. Anal. Chem. 2009, 82, 121.
(4) Sturm, R.M. G., T.; Chen, R.; Hensen, B.; Li, L.; Li, L. Anal. Methods. 2013, 5, 1623.
(5) Qian, K.; Zhou, L.; Liu, J.; Yang, J.; Xu, H.; Yu, M.; Nouwens, A.; Zou, J.; Monteiro, M. J.; Yu, C. Sci. Rep. 2013, 3.
(6) Chiang, C.-K.; Chen, W.-T.; Chang, H.-T. Chem. Soc. Revs. 2011, 40, 1269.
(7) Wei, J.; Buriak, J. M.; Siuzdak, G. Nature 1999, 399, 243.
(8) Woo, H.-K.; Northen, T. R.; Yanes, O.; Siuzdak, G. Nat. Protocols 2008, 3, 1341.
(9) Robichaud, G.; Garrard, K.; Barry, J.; Muddiman, D. J. Am. Soc. Mass Spectrom. 2013,
24, 718.
(10) Sailor, M. J. In Porous Silicon in Practice; Wiley-VCH Verlag GmbH & Co. KGaA: 2011, p 1.
(11) Xiao, Y.; Retterer, S.T.; Thomas, D.K.; Tao, J.-Y.; He, L. J. Phys. Chem. C 2009, 113, 3076.
(12) Liu, Q.; Xiao, Y.; He, L. In Mass Spectrometry Imaging; Rubakhin, S. S., Sweedler, J. V., Eds.; Humana Press: 2010; Vol. 656, p 243.
(13) Smith, R. L.; Collins, S. D. J. App. Phys. 1992, 71, R1.
(14) Lehmann, V.; Föll, H. J. Electroch. Soc. 1990, 137, 653.
(16) Greving, M. P.; Patti, G. J.; Siuzdak, G. Anal. Chem. 2010, 83, 2.
CHAPTER 3. DETERMINATION OF THE LOWER LIMIT OF DETECTION (LOD) ON N-TYPE AND P-TYPE ME-SALDI SUBSTRATES
3.1 Introduction