Sales Forecasting using Linear Regression and
Support Vector Machine
Pinki1, Swati Gupta2
M. Tech Student, Dept. of Computer Science & Engineering, Satya College of Engineering and Technology, Palwal,
Haryana, India1
Assistant Professor, Dept. of Computer Science & Engineering, Satya College of Engineering and Technology, India2
ABSTRACT: This scheme aims to provide an insight in the role intelligent forecasting methods can play in the world
of Sales Management. An important assumption throughout this investigation is that data originating from real life processes can behave in a capricious and non-stationary manner. In such case adaptive methods, capable of making accurate forecasts while they need to respond to changes in demand over time, can bring relief and are a must to maintain control over the supply chain. In the context the fields are explored where sophisticated forecasting strategies can play a significant role. We pay attention to the difficulties and limitations that have to be overcome. To emphasize the surplus value these strategies can have for business we illustrate our story with some examples of recent implementations from major players in business intelligence. However see interesting opportunities too, as they have set in a trend with the development of a wide range of applications that are all presented as sophisticated demand forecasting algorithms. Unfortunately these implementations are more an exception than a rule. Therefore one of the goals of this scheme is to contribute to the publicity of these intelligent forecasting techniques and make the reader aware of the opportunities for businesses. The second part of this paper can be viewed as an introduction to the methods that lay on the foundation of these applications. The conventional techniques to solve forecasting problems have their roots in applied mathematics. However, in the last decade modern learning techniques, such as artificial neural networks, have caught up fast and their successful implementations are encouraging to build new applications. Since many companies rarely give away competitive information, we turned to literature and looked for mathematical as well as modern learning methods. Subsequently we selected the most common approaches, which are Linear Regression and Support Vector Machine to forecast the best possibilities for sales forecasting.
KEYWORDS: Linear Regression, Support Vector Machine, Machine Learning, Confusion Matrix.
I. INTRODUCTION
Forecasting sales is a common task performed by organizations. This usually involves manually intensive processes using spreadsheets that require input from various levels of an organization. This approach introduces bias and is generally not accurate especially during the initial few weeks of a quarter. In fact that's the time when an accurate forecast has the most benefit after all there's little value in providing an accurate forecast in the last week of a quarter.
However, this scheme simplifies forecasting by executing machine learning models that run automatically and present a monthly or quarterly forecast of a customer's sales metric (e.g. Revenue, ROI, quantity). Sales leaders can These models consume both historical data to gauge trend and seasonality, as well as current pipeline of opportunities to then predict for the next 6 or 12 months. Accurate forecasts allow organizations to make informed business decisions. It gives insight into how a company should manage its resources - people, time and cash. Here are the various techniques that make up our forecasting ensemble. Time series forecasting using SVM Support Vector Machine (SVM using Java), Tree based techniques and other traditional methods like Linear Regression. Include predictors for time series - these could be any variables that add value to the model e.g. product usage, number of users, marketing spend, etc. Include external data where applicable such as industry trends, demographic info, etc. Evaluate current pipeline data by running classification algorithms on open opportunities - this forms a part of the ensemble. Evaluate ensemble on previous few months before finalizing the best set of models to use. Since forecasts are data driven the solution allows users to also perform "What-If" analysis. This is a tool that allows sales leaders to determine impact of certain factors on sales numbers. This type of analysis helps them determine what types of levers they have access to and what impact, either positive or negative, they can have on the sales. This advanced What-If analysis is based on machine learning where the model gets executed every time a user interacts with the tool. Some of the variables used in this analysis are number of sales reps, average deal duration, average deal amount, percent win rate. For example a sales manager can see what happens if they increase recruiting or if determine impact of a discounting program they have been considering. This list of features is configurable and can include other factors that may be more meaningful to a company
II. RELATED WORK
Giulio Zotteria, Matteo Kalchschmidt (2007) described that demand forecasting is a major issue in several industrial sectors. A relevant choice for companies is the proper level of forecast aggregation. Forecasters need to properly identify what is the object of the forecasting process, in terms of time bucket (e.g., forecasts are produced on a daily level or on weekly one), set of items the demand refers to (e.g., single item or group of items), set of locations the demand refers to (e.g., single store or chain of stores).
Michael Lawrencea and Paul Goodwin (2006) have demonstrated that the past 25 years has seen phenomenal growth of interest in judgemental approaches to forecasting and a significant change of attitude on the part of researchers to the role of judgement. While previously judgement was thought to be the enemy of accuracy, today judgement is recognized as an indispensable component of forecasting and much research attention has been directed at understanding and improving its use. Human judgement can be demonstrated to provide a significant benefit to forecasting accuracy but it can also be subjected to many biases. Much of the research has been directed at understanding and managing these strengths and weaknesses.
Robert Fildes and Paul Goodwin (2006) have explained in their work that forecasts play a key role in the management of the supply chain. In most organizations such forecasts form part of an information system on which other functions, such as scheduling, resource planning and marketing depend. Forecast accuracy is, therefore, an important component in the delivery of an effective supply chain. Typically, the forecasts are produced by integrating managerial judgment with quantitative forecasts within a Forecasting Support System (FSS). However, there is much evidence that this integration is often carried out poorly with deleterious effects on accuracy.
products, it becomes necessary while forecasting sales, to choose a forecasting model which is sensitive to the trends shown in the historical sales data. A company must fit the best suited forecasting model to each specific product to obtain the optimal forecast. This, however, is not the case, and the general practice is to use a single forecasting model for different products. Such practice may result in obtaining higher forecast error values.
Michael Lawrence and Konstantinos Nikolopoulos along with Robert Fildes and Paul Goodwin (2009) have experimented that the most common approach to forecasting demand in these companies involves the use of a computerized forecasting system to produce initial forecasts and the subsequent judgmental adjustment of these forecasts by the company’s demand planners, ostensibly to take into account exceptional circumstances expected over the planning horizon. Making these adjustments can involve considerable effort and time, but they improve accuracy.
III.PROPOSED ALGORITHM
Below diagram depicts the proposed scheme and algorithm for attaining the accurate and productive forecast for sales.
Figure 1: Proposed Workflow using Linear Regression and Support Vector Machine
The sales forecast or prediction system is basically divided into 3 different parts which use different methodologies to implement and achieve the desired output. The various approaches adopted to predict the cancer are:
• Linear Regression
• Confusion Matrix( to show the results of regression) • Support Vector Machine Algorithm (for Classification)
Figure.2: Slope and Interception Value after Regression gained using the residual sum of squares and regression sum of squares.
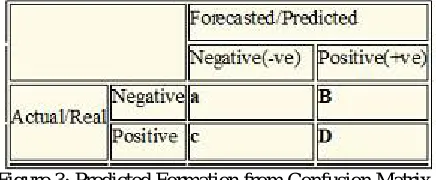
Confusion Matrix: A confusion matrix contains info concerning actual and foretold classifications done by an arrangement. Performance of such systems is usually evaluated victimization the information within the matrix. The subsequent table shows the confusion matrix for a 2 category classifier.
The values taken within the confusion matrix have the subsequent which means within the framework of our study: • A is the number of correct predictions that an instance is negative.
• B is the number of incorrect predictions that an instance is positive. • C is the number of incorrect of predictions that an instance negative. • D is the number of correct predictions that an instance is positive.
The below figure depicts the confusion matrix scenario for general under standing and ready referemce.
Figure 3: Predicted Formation from Confusion Matrix
There are various typical terms which are considered for the 2 class matrix:
The accuracy (AC) is the amount of the overall quantity of predictions that were accurate. This is calculated with the help of the following equation:
……..[1]
The recall or true positive rate (TP) is the amount of helpful cases that were accurately recognized, as found with the help of given equation:
………[2]
………[3]
The true negative rate (TN) is defined as the amount of unhelpful cases that were identified accurately, with the help of given following equation:
………[4]
The false negative rate (FN) is the amount of helpful cases that were wrongly categorized as unhelpful, with the help of given following equation:
………..[5]
Finally, precision (P) is the amount of the identified helpful positive cases that were accurate, with the help of given following equation:
………..[6]
The accuracy determined exploitation equation one might not be Associate in nursing adequate performance live once the amount of negative cases is far bigger than the amount of positive cases. Suppose there area unit a thousand cases, 995 of that area unit negative cases and five of that area unit positive cases. If the system classifies all of them as negative, the accuracy would be ninety nine. 4.9%, although the classifier incomprehensible all positive cases. different performance measures account for this by together with TP in an exceedingly product: for instance, mean value, as outlined in equations seven and eight, and F-Measure, as outlined in equation nine.
…….. [7]
…….[8]
……….[9]
In last equation, value of beta is from zero to infinite value and it is applied to manage the weight allocated to P & TP. The classifier which is assessed with the help of equations 7, 8 or 9 will have a determine value of zero, if all helpful or positive cases are categorized wrongly.
SVM: SVMs are a more recent approach of ML methods applied in the field of cancer prediction/prognosis. Initially SVMs map the input vector into a feature space of higher dimensionality and identify the hyper plane that separates the data points into two classes. The marginal distance between the decision hyper plane and the instances that are closest to boundary is maximized. The resulting classifier achieves considerable generalizability and can therefore be used for the reliable classification of new samples. It is worth noting that probabilistic outputs can also be obtained for SVMs . However an SVM might work in order to classify sales forecast among the categories based on countries and cities therein. The identified hyper plane can be thought as a decision boundary between the two clusters. Obviously, the existence of a decision boundary allows for the detection of any misclassification produced by the method and to segregate the complexity for better, effective productivity and results thereafter.
IV.PSEUDO CODE
Linear Regression:
1. Got a bunch of points in R2 , {(x i , y i )}
2. Want to fit a line y = ax + b that describes the trend.
3. We define a cost function that computes the total squared error of our predictions w.r.t. observed values y i J(a, b) = P(ax i + b − y i ) 2 that we want to minimize.
5. The coefficients you get give you the minimum squared error. 6. Can do this for specific points, or in general and find the formulas. 7. More general version in R n.
SVM Classification
V. SIMULATION RESULTS
Retail sales forecasting is the task of predicting the sales of the products at a future time and finding meaningful patterns which can used to gain a competitive edge over the competitors and become a leader in the market. However, this chapter describes the scenario required for setting up respective environment and migrating file to the ecosystem for machine learning. After migration linear regression is applied to derive confusion matrix and eventually passed on to the vectors of SVM for prediction and forecasting. Retail sales forecasting is the task of predicting the sales of the products at a future time and finding meaningful patterns which can used to gain a competitive edge over the competitors and become a leader in the market. However, this chapter describes the scenario required for setting up respective environment and migrating file to the ecosystem for machine learning. After migration linear regression is applied to derive confusion matrix and eventually passed on to the vectors of SVM for prediction and forecasting.
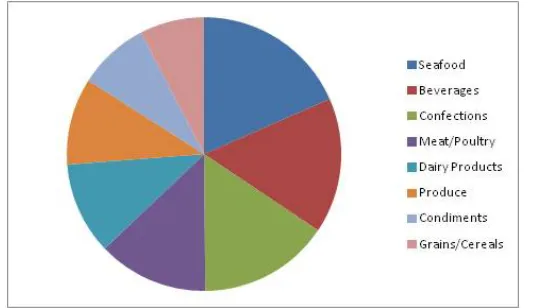
Figure 4: Sales Forecast Pie Chart Produced by Linear Regression and SVM
The above pie chart depicts the overall sales delivered on the basis of various categories wherein the categories is comprising of various products and orders are made for various products thus enabling us to foresee which categories is highly saleable.
VI.CONCLUSION AND FUTURE WORK
further collection of data. This could be due to the design choice to forecast sales in retail sector based upon the sales and inventory of the past and current scenarios, which may be short and appropriate to capture trends in market that functional regression requires. If the retail and sales forecast were instead based upon the statistical data of the past days, the bias of the SVM model could likely be reduced. However, this would require much more computation time along with retraining of the weight vector w, so this will be deferred to future retail sales forecasting with effective products and results.
However the above amalgamated technique the resultant values and derived with more accuracy where as the linear regression produced the confusion matrix thus resulting the compact the precise formation of weights based on characteristics and attributes where as SVM classifies the estimation of probabilistic model where scheme can define the range in which the prediction can be made more perfectly based on type of categorization in cancer and precautions respectively. For the future work the same the same can be implements on gigantic database vide hadoop where map and reduce will cut short the datasets in small proportions and parallel execution can be performed for quick and prompt results. However, in subsequent work the data stream can be done using apache spark the concurrent results can be products and prediction forecast can be done and productivity can be achieved.
REFERENCES
1. Giulio Zotteria , Matteo Kalchschmidtb, Science Direct Int. J. Production Economics A model for selecting the appropriate level of aggregation in forecasting processes 108 (2007) 74–8.
2. Michael Lawrencea and Paul Goodwin (2006) Judgemental Forecasting: A Review of Progress Over the Last 25 Years International
Journal of Forecasting, Vol. 22, pp. 493-518, 2006
3. P. Goodwin, R. Fildes, W.Y. Lee, K.Nikolopoulos & M. Lawrence , Understanding the use of forecasting systems: an interpretive study in
a supply-chain company University of Bath School of Management Working Paper Series 2007.14
4. Cheng Zhang, Jasbir Dhaliwal , An investigation of resource-based and institutional theoretic factors in technology adoption for
operations and supply chain management International Journal of Production Economics
5. Elimination and 8 Pixel Neighborhood Methods”, International Journal of Computer Applications (0975 – 8887), Volume 9, No.11, 2010
6. Michael Lawrence and Konstantinos Nikolopoulos along with Robert Fildes and Paul Goodwin (2009) University of Bath, School of
Management
7. Anderson E & Anderson M 2000, Are your decision today creating your future competitors? Avoid the outsourcing trap, The Systems
Thinker, Pegasus Communication, Waltham, MA.
8. Ballot, M 1986, Decision-making models in production & operations management, Florida, Robert E. Krieger Publishing Company, Inc.
9. Ballou, RH 2004, Business logistics/ supply chian management (ed.) 5, New Jersey, Pearson Education, Inc.
10. Christopher, M 2005, Logistics and supply chain management creating value-adding networks (ed.) 3, Harlow, Pearson Education
Limited.
11. Fawcett, SE, Ellram, LM, & Ogden, JA 2007, Supply Chain Management: From vision to implementation, New Jursey, Pearson Prentice
Hall.
12. Harrison, A & van Hoek, R 2005, Logistics management and strategy, Harlow, Prentice-Hall.
13. Kaydos, W 1999, Operational performance measurement increasing total productivity, New York, St. Lucie Press.
14. Krajewski, LJ, Ritzman, LP, & Malhotra, MK 2007, Operations management processes and value chains (ed.) 8, New Jersey, Pearson