1 AREVA Expert, PECC-G, AREVA NP GmbH, Offenbach, Germany ([email protected]) 2 AREVA Advisor, PECC-G, AREVA NP GmbH, Offenbach, Germany
3 Civil Engineer, PECC-G, AREVA NP GmbH, Offenbach, Germany 4 Engineer Trainee, PECC-G, AREVA NP GmbH, Offenbach, Germany
ABSTRACT
The strong Niigataken-Chuetsu-Oki Earthquake (NCOE) occurred at only 15 km distance to the world’s largest nuclear power facility – the Kashiwazaki-Kariwa nuclear power plant (NPP). The severe earthquake shaking at the site significantly exceeded the limits of the original design. Though the reactors and all their safety related structures, systems and components (SSC) performed very well, non-safety related SSC were heavily damaged, e.g. see photo with damaged road infrastructure. The significant amount of data collected by International Atomic Energy Agency (IAEA) missions on the site and recorded acceleration time-histories at different locations in soil and structures was the basis for an international benchmark study organized by the IAEA. The main objectives of the benchmark were: (1) understand the behavior of the soil, structures and equipment and their interaction during the NCO earthquake; (2) identify main parameters influencing their response; (3) calibrate simulation methodologies by comparison with observed behavior; (4) gain insight into the seismic margin of SSC by quantifying the nonlinear effects in their behavior under increasing seismic input. This paper summarizes main results of the AREVA structural analysis team.
1. INTRODUCTION
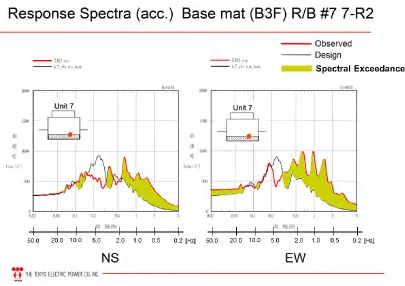
Niigataken-Chuetsu-Oki (NCO) earthquake (MW ≈ 6.6, depth ≈ 10 km) occurred at only 15 km distance to the Kashiwazaki-Kariwa NPP, which is the world’s largest nuclear power facility with a total output of 7965 MW from seven boiling water reactor units. The strong shaking (JMA intensity 6+) at the site was characterized by a peak ground acceleration of 1.25 g at free-field surface in horizontal direction (measured near Unit 5) and 0.73 g in vertical direction (measured near Unit 1). Because of the exceedance of the threshold values at the foundation basemat – in horizontal 0.12 g and 0.10 g in vertical direction – the operating reactor units (2, 3, 4 and 7) were automatically shut down. Comparisons of the design vs. observed maximum and spectral acceleration values at the basemat of the reactor buildings, respectively, are given in Figures 1 and 2. Both figures demonstrate the significant exceedance of the design values.
Following the NCO earthquake, three IAEA expert missions to the Kashiwazaki-Kariwa NPP were accomplished. Their goal was to identify findings and lessons learned from this extraordinary seismic event, document them, and later share them with the international nuclear community. As a follow-up to these missions, IAEA launched in 2008 the “Kashiwazaki-Kariwa Research Initiative for Seismic Margin Assessment” (KARISMA). An expert panel supported by the plant owner (TEPCO) elaborated the main input data, documented in the general specification, cf. IAEA (2012).
Figure 1. Comparison of design vs. observed peak acceleration at the basemat of the reactor buildings, cf. IAEA (2013).
Figure 2. Comparison of design vs. observed response spectra at the basemat of reactor building Unit 7, cf. IAEA (2013).
3. Next, soil column analysis with a one-dimensional linear-equivalent model under vertically propagating shear waves for the main shock and two aftershocks were performed. Soil shear modulus reduction, damping ratio and maximum shear strain along the depth of the soil profile were calculated. Acceleration response spectra at the surface and at four depths in the free-field – where accelerometer devices in a borehole array are installed – were calculated and compared with recorded data for the aftershocks. Finally, impedance functions with the strain-compatible soil profile were calculated.
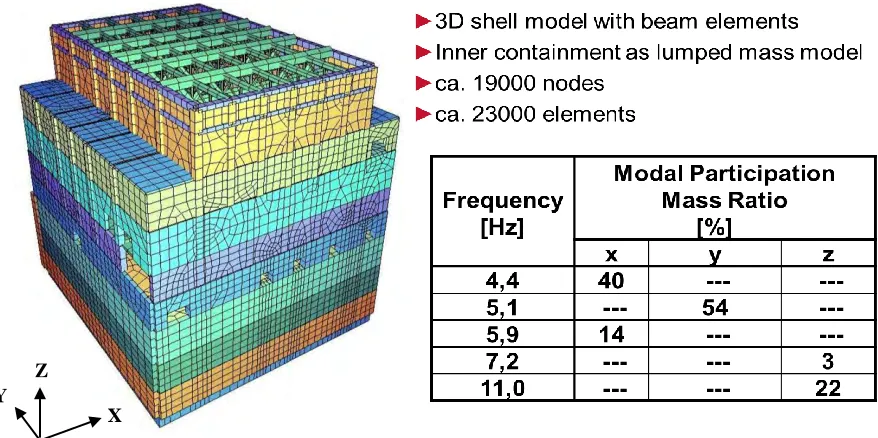
At the end of Phase I, modal analysis of the coupled soil-structure model was performed.
Figure 3. Generated 3D Finite Element model of Unit 7 reactor building structure, main frequencies and corresponding modal participating masses for fixed-base condition.
3. SITE-RESPONSE AND SOIL-STRUCTURE-INTERACTION ANALYSES
In Phase II of the benchmark exercise the response (acceleration and displacement) of the coupled soil-structure system to the main seismic shock was evaluated allowing for the foundation embedment effect and compared with recorded data for key building locations (“7-R1” and “7R-2”). This phase consisted of two subtasks, namely “Reference” and “Best Estimate” analysis.
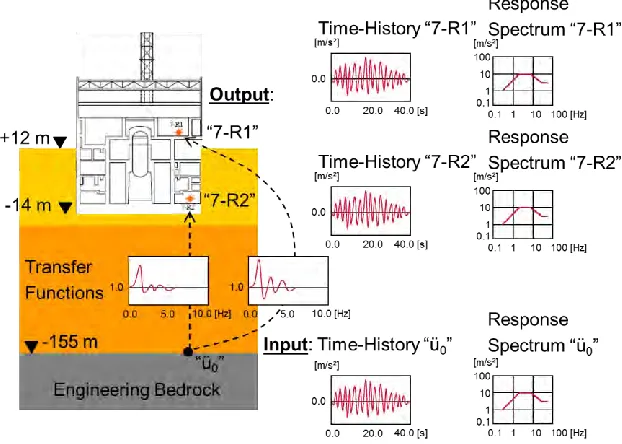
In the “Reference” analysis the seismic excitation time-histories were defined by the guidance document at outcropping engineering bedrock, i.e. at -155m TMSL. First, the response time-histories at the soil-bedrock interface were calculated in a site response analysis with SHAKE, see Figure 4. Next, these time histories were used as excitation of the coupled structure model. The result of these soil-structure interaction (SSI) calculations – performed with SASSI – are time histories at key structural locations (“7-R1” and “7R-2”) where recorded data are available, see Figure 5. Finally, calculated and measured data were compared in terms of response spectra for 5 % critical damping.
X Z
Figure 4. “Reference Analysis”; Subtask: Site response calculation of the signal “Üo” at the soil-bedrock interface from the given signal “Ü0o” at -155 m TMSL.
Figure 5. “Reference Analysis”; Subtask: Soil-structure interaction calculation of the signal at the key structural locations “7-R1” and “7-R2” from the signal calculated in the site response analysis “Üo”.
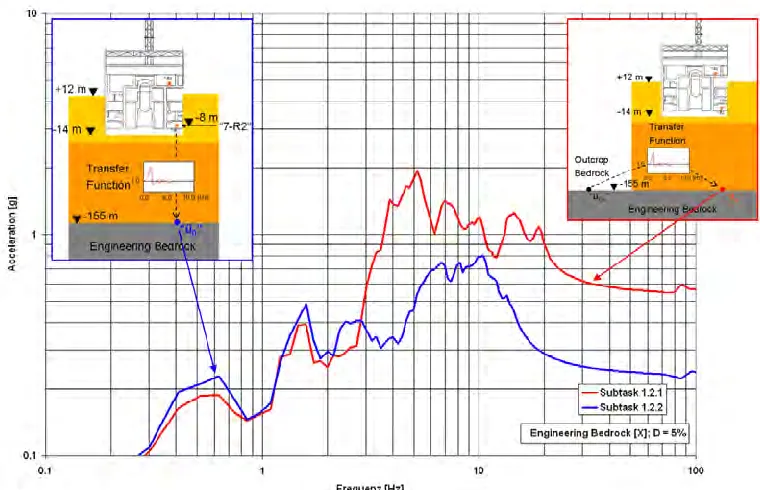
Figure 6. “Best Estimate Analysis”; Subtask: Soil-structure calculation of the signal “Üo” at the soil-bedrock interface from the given signal “7-R2” at -8 m TMSL (top of basemat).
Figure 7. Comparison of the signals “Üo” for horizontal translational acceleration (X) at the soil-bedrock interface calculated in the “Reference” and “Best Estimate” analysis.
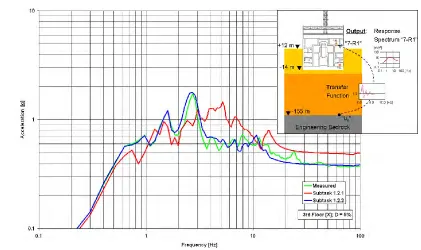
Figure 8. Comparison of the signals at “7-R1” (3rd Floor at +23.50 m TSML) for horizontal acceleration (X) calculated in the “Reference” and “Best Estimate” analysis with the measured signal.
Figure 9. Comparison of the signals at “7-R1” (3rd Floor at +23.50 m TSML) for vertical acceleration (Z) calculated in the “Reference” and “Best Estimate” analysis with the measured signal.
Figure 9 confirms the better response prediction ability of AREVA’s “Best Estimate” method compared to the benchmark “Reference” approach. However, AREVA’s results also notably over-predict the vertical acceleration at “7-R1”. It is believed that this discrepancy is caused by nonlinear effects (e.g. foundation rocking) leading to significant energy dissipation which are not realistically accounted for by the employed linear soil-structure interaction calculations.
4. NONLINEAR STATIC (PUSHOVER) AND DYNAMIC ANALYSES
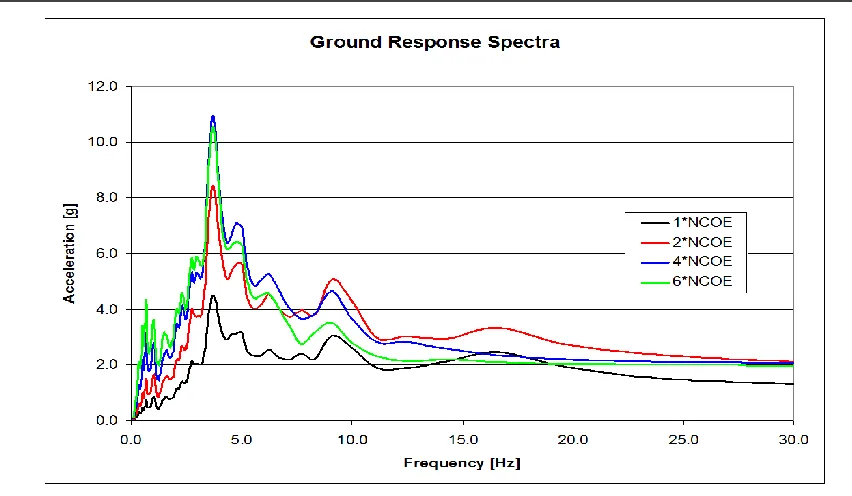
In Phase III the behavior and response (acceleration and displacement) of the structure were examined by nonlinear static (Pushover) and dynamic analysis due to increasing seismic input scaled to 1*NCOE, 2*NCOE, 4*NCOE and 6*NCOE. In Figure 10 the ground response spectra of the horizontal component in Y direction at outcropping foundation elevation at -13.7 m TMSL are depicted. Both fixed-base (equivalent to foundation on hard rock) and coupled soil-structure models were analyzed.
First, soil-structure-interaction analysis was performed in the frequency domain and impedance functions calculated with the strain-compatible soil profile. In doing so, a surface founded reactor building at elevation -13.70 m TMSL was assumed. Based on the impedance functions 6 global springs and dampers representing the 6 degrees of freedom of the rigid foundation were evaluated and modal analysis performed. Then, the global springs were discretized and distributed under the foundation mat. Their values were tuned in order to match the calculated fundamental frequencies.
Next, amount and position of the steel reinforcement was implemented into the FEM model. The nonlinear static and dynamic calculations were performed with the software package SOFiSTiK (2010). The nonlinear material behavior of reinforced concrete in the shell elements is implemented by a layer model with arrangement of the crosswise reinforcement layers in their correct positions near the surfaces. The constitutive law of the concrete and rebar steel used in the nonlinear analysis is shown in Figure 11.
Next, pushover was performed for both fixed-base and SSI cases and for all 4 excitation levels. The procedure used for determination of the performance point – intersection of the pushover curve and demand spectrum adjusted for the effective damping – was based on the capacity spectrum procedure “A” in ATC-40 (1996). For this purpose, both the demand spectrum and the calculated pushover curve were converted into acceleration-displacement response spectrum format. The employed pushover procedure generated a load function representing the inertia force based on the first vibration mode.
Figure 12 shows the effect of modeling the structure partially by linear and partially by nonlinear elements on the pushover curve. For example, assignment of nonlinear behavior to all elements of the model leads to the lowest pushover curve in the figure.
Assignment of nonlinear behavior to all elements except for the internal walls leads to the middle curve with higher capacity values, whereas assignment of nonlinear behavior to all elements except for the internal walls and floor slabs leads to the upper curve with obviously unrealistically high capacity values. This issue should be properly addressed when assigning linear behavior to parts of the model for computational efficiency reasons.
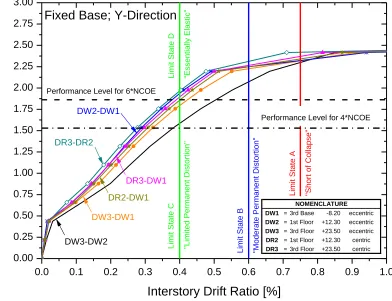
Figure 13 shows normalized pushover curves for a fixed-base model along with allowable drift values as per ASCE/SEI 43-05 (2005).
Figure 10. Ground response spectra of the horizontal component (Y) for 5% critical damping at foundation elevation at -13.7 m TMSL (Outcrop).
Figure 11. Material properties for concrete and rebar steel used in the nonlinear analysis, cf. IAEA (2012).
If we assume the limit state B “moderate permanent distortion” as per ASCE/SEI 43-05 to represent the desired performance of a nuclear power plant during a beyond design event, then the weakest story would not reach the limit “B” even for the 6*NCOE seismic level. Furthermore, the figure suggests that the story will be at limit state C “limited permanent distortion” for the seismic level 4*NCOE. These results indicate a high seismic margin of the structure and confirm the observed excellent performance for the beyond design level of NCOE.
0.0 0.1 0.2 0.3 0.4 0.5 0.6 0.7 0.8 0.9 1.0 0
1 2
Fixed Base; Y-Direction external walls, reactor walls, pool walls and slabs
nonlinear behavior in external walls, reactor walls, pool walls, slabs and inner walls
Bas
e Shear / Total W
Interstory Drift Ratio [%]
Figure 12. Effect of major structural members with assigned nonlinear behavior on the pushover curve.
0.0 0.1 0.2 0.3 0.4 0.5 0.6 0.7 0.8 0.9 1.0
0.00 0.25 0.50 0.75 1.00 1.25 1.50 1.75 2.00 2.25 2.50 2.75 3.00 L imit Sta te D "E s s e n ti a lly Ela s ti c "
Fixed Base; Y-Direction
L imit Sta te A "S h o rt o f Co lla p s e " L imit Sta te B "Mo d e ra te P e rma n e n t Dis tort ion " Limit State C " L imit e d Pe rma n e n t Dis tort ion "
Performance Level for 4*NCOE Performance Level for 6*NCOE
Bas
e Shear / Total W
eig
ht
Interstory Drift Ratio [%]
DW1 = 3rd Base -8.20 eccentric DW2 = 1st Floor +12.30 eccentric DW3 = 3rd Floor +23.50 eccentric DR2 = 1st Floor +12.30 centric DR3 = 3rd Floor +23.50 centric
NOMENCLATURE DW3-DW2 DW3-DW1 DR2-DW1 DR3-DW1 DW2-DW1 DR3-DR2
Figure 13.Nonlinear static (Pushover) analysis for fixed-base condition – Normalized base and story shear forces versus inter-story drift along with allowable drift values as per ASCE/SEI 43-05 (2005).
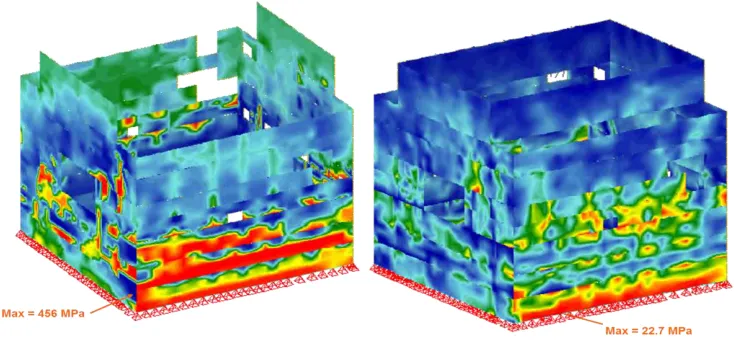
Figure 14. Identification of critically stressed structural members.
(On the left – tensile steel rebar stress; on the right – compressive concrete strength)
Both pushover and dynamic analysis were used in determining the critically loaded structural members for which fragility analysis were performed. At that point, local overstress criteria as e.g. rebar tensile stress, concrete compressive stress and concrete crack width were employed cf. Figure 14. However, the fragility calculation results are not in the scope of this publication.
5. CONCLUSIONS
The NCOE was a beyond design seismic event at the Kashiwazaki-Kariwa site. It caused strong nonlinear effects in the site response and in the interaction between the soft top soil layer and the deeply embedded stiff reactor building structure. Best results in predicting the structural response were achieved by using the signal recorded at the foundation basemat as input in a soil-structure interaction analysis. Both static and dynamic nonlinear analysis of the reactor building structure Unit 7 for NCOE confirmed structural response in the linear range and thus explain the observed excellent performance of safety relevant structures. Modeling a structure partially by linear and partially by nonlinear elements may cause over-prediction of its capacity. For determination of the critically loaded structural members both global damage criteria as the inter-story drift ratio and local overstress criteria as rebar tensile stress, concrete compressive stress and concrete crack width were successfully employed. Finally, fragility analyses of those members were performed; however, their results will be published elsewhere.
REFERENCES
American Society of Civil Engineers. (2005). Seismic Design Criteria for Structures, Systems, and
Components in Nuclear Facilities. ASCE/SEI 43-05. Reston, Virginia, USA.
Applied Technology Council. (1996). Seismic Evaluation and Retrofit of Concrete Buildings. ATC-40. Redwood City, California, U.S.A.
International Atomic Energy Agency, IAEA. (2012). Kashiwazaki-Kariwa Research Initiative for Seismic Margin Assessment. KARISMA BENCHMARK. Guidance Document Part 1: K-K Unit 7 R/B
Structure PHASE I, II & Revised III, Vienna, Austria
International Atomic Energy Agency, IAEA. (2013). Review of Seismic Evaluation Methodologies for
NPPs based on KARISMA Benchmark Results. Draft TECDOC DD1089 Rev.01. Vienna, Austria
SOFiSTiK AG. (2010). Finite Element Software Package for Analysis, Design and Detailing of Building