University of Windsor University of Windsor
Scholarship at UWindsor
Scholarship at UWindsor
Electronic Theses and Dissertations Theses, Dissertations, and Major Papers
10-5-2017
Assessing the Concurrent Validity of a Novel Performance-Based
Assessing the Concurrent Validity of a Novel Performance-Based
Task of Executive Functioning
Task of Executive Functioning
Bryanna Graves University of Windsor
Follow this and additional works at: https://scholar.uwindsor.ca/etd
Recommended Citation Recommended Citation
Graves, Bryanna, "Assessing the Concurrent Validity of a Novel Performance-Based Task of Executive Functioning" (2017). Electronic Theses and Dissertations. 7264.
https://scholar.uwindsor.ca/etd/7264
This online database contains the full-text of PhD dissertations and Masters’ theses of University of Windsor students from 1954 forward. These documents are made available for personal study and research purposes only, in accordance with the Canadian Copyright Act and the Creative Commons license—CC BY-NC-ND (Attribution, Non-Commercial, No Derivative Works). Under this license, works must always be attributed to the copyright holder (original author), cannot be used for any commercial purposes, and may not be altered. Any other use would require the permission of the copyright holder. Students may inquire about withdrawing their dissertation and/or thesis from this database. For additional inquiries, please contact the repository administrator via email
Assessing the Concurrent Validity of a Novel Performance-Based Task of Executive Functioning
By
Bryanna Graves
A Thesis
Submitted to the Faculty of Graduate Studies through the Department of Psychology in Partial Fulfillment of the Requirements for
the Degree of Master of Arts at the University of Windsor
Windsor, Ontario, Canada
2017
Assessing the Concurrent Validity of a Novel Performance-Based Task of Executive Functioning
by
Bryanna Graves
APPROVED BY:
______________________________________________ G. Salinitri
Faculty of Education
______________________________________________ A. Taylor, Special Committee Member
Windsor Essex Community Health Centre
______________________________________________ R. Cantarutti, Special Committee Member Registered Speech Language Pathologist
______________________________________________ C. Abeare
Department of Psychology
______________________________________________ J. Casey, Advisor
Department of Psychology
iii
Declaration of Originality
I hereby certify that I am the sole author of this thesis and that no part of this thesis has
been published or submitted for publication.
I certify that, to the best of my knowledge, my thesis does not infringe upon anyone’s
copyright nor violate any proprietary rights and that any ideas, techniques, quotations, or any other
material from the work of other people included in my thesis, published or otherwise, are fully
acknowledged in accordance with the standard referencing practices. Furthermore, to the extent
that I have included copyrighted material that surpasses the bounds of fair dealing within the
meaning of the Canada Copyright Act, I certify that I have obtained a written permission from the
copyright owner(s) to include such material(s) in my thesis and have included copies of such
copyright clearances to my appendix.
I declare that this is a true copy of my thesis, including any final revisions, as approved by
my thesis committee and the Graduate Studies office, and that this thesis has not been submitted
iv Abstract
Research has found that performance-based tests of executive functioning (PBT-EF) have
inherent characteristics that limit their use in describing functioning in an ecologically valid
manner. Recommendations have been made to improve prediction of everyday functioning, and
the Functional Assessment of Verbal Reasoning and Executive Strategies (FAVRES) appeared
promising. The current study investigated the concurrent validity of the FAVRES. It was
hypothesized that the FAVRES would be a better predictor of everyday EF than an estimate of
intelligence and, true to its goal, other PFT-EF. University undergraduate students and
community members were invited to participate in the study. Participants (N = 78; 63% Female,
Mage = 22 years) completed a demographic questionnaire, as well as the FAVRES, the Wechsler
Test of Adult Reading (WTAR; an estimate of intelligence) and the Behavior Rating Inventory
of Executive Function - Adult (BRIEF-A; a self-report measure of everyday EF). FAVRES and
WTAR scores were used in a hierarchical regression model to predict BRIEF-A scores. Neither
FAVRES nor WTAR scores predicted BRIEF-A scores. Post-hoc analyses revealed a relation
between FAVRES performance and WTAR scores; whereas BRIEF-A scores were predicted by
participant History of Psychopathology and State Distress. These findings indicate a stronger
relation between psychopathology and everyday EF than between intelligence or PBT and
everyday EF. Future investigation into the effect of emotion on EF related behaviours may be
v
Acknowledgments
I want to thank my fantastic supervisor, Dr. Casey, for his encouragement, passion, insight, and
support during this thesis and, more generally, throughout the completion of my degree. I also
want to thank my thesis committee members for their helpful feedback and comments in the
development of this work. Finally, I acknowledge the love, life lessons, and support of my
family, fiancé, and friends, which provide me with joie de vivre and a purposeful context for my
vi
Table of Contents
Declaration of Originality………...iii
Abstract………...iv
Acknowledgements………..v
List of Tables……….vii
1 Introduction………...1
Executive Function Conceptualization………1
Assessment of Executive Function………..4
Discrepancy Between Inventory and Performance Measures……….6
Functional Assessment of Verbal Reasoning and Executive Strategies ………...8
2 The Current Study……….………..12
3 Methods……….………...12
Behavior Rating Inventory of Executive Function………..…..…....12
Functional Assessment of Verbal Reasoning and Executive Strategies………....15
Wechsler Test of Adult Reading……….…...19
Demographic Questionnaire………...21
Study Design and Procedures……….…………....22
Participant Characteristics………...……….……..23
Data Analysis………...28
4 Results………...29
Assumptions ……….…….29
Primary Analysis………31
Post-hoc Analysis………...34
5 Discussion……….……….36
6 Conclusions ………...41
7 Future Directions ……….41
References……….……….…45
Appendix A, Demographic Questionnaire………...….……….………..59
Appendix B, List of Acronyms………..61
vii List of Tables
Table 1: Basic Demographic Characteristics of Sample………...24
Table 2: Final Sample Ethnic Composition………...25
Table 3: Psychological Characteristics of Final Sample………...26
Table 4: Medical Characteristics of Final Sample………....27
Table 5: Participant Performance on Study Measures………..31
Table 6: Participant Levels of State Distress……….32
Table 7: Summary ofModel Statistics in Regression Predicting GEC Scores………...33
Table 8: Correlations Between FAVRES Subscores and BRIEF-A Subscales...34
Table 9: Correlations Between Relevant Study Variables………...35
1
1. Introduction
Executive Function Conceptualization
The construct of executive functioning (EF) is nebulous: There are many researchers that
offer definitions of EF, and each include a varying set of cognitive components or emphasize the
importance of one or more components. In its early conceptualization, EF was coined the central
executive and it held a role in the supervision and switching of attentional pathways within the
context of working memory (Baddeley & Hitch, 1974). It was Luria (1973) that framed the central
executive as a key organizer and monitor of intelligence, and who attributed EF to the frontal
lobes (as cited in Jurado & Rosselli, 2007). The current conceptualization of EF is largely based
on this framework, although several notable theorists have continued to develop our understanding
(Banich, 2009; Jurado & Rosselli, 2007). For example, Lezak (1983) specified EF as key to the
carrying out of behaviour, and declared the concept to include goal formation, the act of carrying
out a goal-directed plan, and effective performance. Norman and Shallice (1986) describe EF as
consisting of cognitive components that allow us to effectively work with novel information, plan
for future events, and make good decisions. In the framework proposed by Barkley (2001), EF is
understood as a method for individuals to maximize long-term social benefits, primarily through
the use of response-inhibition (i.e., controlling one’s reflective response to stimuli). Additionally,
some suggest that modern frameworks of EF generally consist of inhibitory control, working
memory, and cognitive flexibility, and that these components can be further broken down into
subcomponents (e.g., planning and problem solving) (Diamond, 2013).
Discussion regarding the nature of EF and possible EF components are ongoing; no agreed
upon definition exists. Some theorists position EF as a single domain, whereas others consider it
2
however, evidence that EF is both unitary and consisting of discrete components (Miyake et al.,
2000). This controversy is further complicated by disagreement regarding the validity of EF as a
construct dissociable from general intelligence (Jurado & Rosselli, 2007). Contradictory evidence
has been provided. Some researchers suggest that EF shares little in relation to general intelligence
(Ardila, Pineda, & Rosselli, 2000), whereas others suggest EF is essentially the same construct as
general intelligence (Obonsawin et al., 2002), and others still, that only some components of EF
overlap with general intelligence (Friedman et al., 2006). Many have turned to investigations of
the frontal cortex to further develop our understanding of EF. Early studies investigating cognitive
and behavioural changes after damage to the frontal lobes have helped to establish the relationship
between EF and frontal neuroanatomy. Studies of frontal damage often revealed behavioural
dysfunction in areas now considered the domain of EF, symptoms such as apathy, amotivation,
impulsivity, perseveration, and disinhibition were common (Godefroy, 2003). As Suchy (2009)
has outlined, the prefrontal cortex (PFC) has generally been found to associate with EF capacities,
and particular anatomical sites of the PFC have been linked to specific components of EF, notably
the dorsolateral prefrontal cortex with working memory, the supermedial prefrontal cortex with
attention, response selection, and behaviour initiation, and the ventral PFC to outcome monitoring,
inhibition, and decision making. Additionally, imaging techniques have revealed complex neural
connections between regions of the PFC and subcortical and non-frontal regions during tasks
designed to measure EF, again supporting the idea that the PFC is a major substrate of EF (Suchy,
2009; Jurado & Rosselli, 2007; Miller & Cohen, 2001; Stuss, 2011).
The complex neuroanatomical heterogeneity revealed by imaging studies have led some
researchers to distinguish between “hot” and “cold” executive functioning, as tasks requiring
3
containing affectively neutral content are more often found to activate the dorsolateral prefrontal
cortex (“cold EF”) (Kerr & Zelazo, 2004; Happaney, Zelazo, & Stuss, 2004; Hongwanishkul,
Happaney, Lee, & Zelazo, 2005; Alvarez & Emory, 2006). Although neuropsychological science
has largely been interested in investigating “cool” EF and thereby minimizing g the role that
affective processes play in our understanding of EF (Kerr & Zelazo, 2004; Alvarez & Emory,
2006; Banich, 2009; Jurado & & Rosselli, 2007), there is a growing interest in this area
(Hongwanishkul, Happaney, Lee, & Zelazo, 2005). Although current research on the relation
between affective processing and EF have been conducted mostly in relation to decision making
paradigms (Hongwanishkul, Happaney, Lee, & Zelazo, 2005), it is clear that EF and affective
processes are intricately linked. For example, components of EF are thought by some as necessary
for successful emotion regulation and multiple behaviour rating inventories of EF consider
emotion regulation a major process carried out by EF (Jurado & Rosselli, 2007, Grace & Malloy,
2002; Gioia, Isquith, Guy, & Kenworthy, 2000;Hofmann, Schmeichel, & Baddeley, 2012).
Relatedly, numerous neurological studies that have neural connections between subcortical sites
linked to emotional processing and frontal areas (Pessoa, 2008; Circuits, 1994; Soares, & Mann,
1997; Royall et al., 2002; Carmichael, & Price, 1995; Ghashghaei, Hilgetag, & Barbas, 2007;
Ghashghaei, & Barbas, 2002). Considering this, it is not surprising to find EF impairments to be a
transdiagnostic marker of psychopathology (McTeague, Goodkind, & Etkin, 2016). However, it is
unclear as to the causal relation between EF and psychopathology (Snyder, Miyake, & Hankin,
2015), or as to the importance of affective processing in EF outside the domain of decision making
and emotion regulation.
Although the specificity and necessity of the frontal lobes in EF is far from irrefutable
4
include the idea that there exists a fundamental neuroanatomical relationship between EF and the
frontal lobes, that the role of EF is primarily related to the pursuit and monitoring of action toward
a goal, and that effective EF is necessary for the development of adaptive human behaviour.
Although no common framework exists, it is accepted that EF is a “multidimensional behavioural
concept covering a range of assumed higher order cortical functions, such as goal-directed
behaviour, attentional control, temporal organisation and planning” (Lehto, Juujärvi, Kooistra, &
Pulkkinen, 2003, p. 59)
Assessment of Executive Function
Despite the efficacy of neuroimaging for the localization of frontal cortex injuries that
may underlie executive dysfunction (ED), these techniques are limited in their capacity to assess
the presence or extent of functional impairment related to ED (Reynolds & MacNeill Horton,
2008). Further, complications related to the ill-defined and multidimensional nature of EF have
made it notoriously difficult to measure; it is nearly impossible to isolate EF components through
the use of any given assessment (Suchy, 2009). However, there are common approaches to the
assessment of EF. Assessment is typically undertaken with use of standardized
performance-based tests (PBT) and/or rating inventories (RI).
PBT-EF are typically employed in laboratory or office settings and are designed to
capture discrete components of EF such as inhibition, planning, or cognitive set-shifting (Toplak,
West, & Stanovich, 2013). The performance of those taking these tests are often categorized and
interpreted using accuracy or response-speed data extracted under time constraints within the
context of a structured laboratory procedure (Toplak, West, & Stanovich, 2013). A study by
Rabin, Barr, & Burton (2005) demonstrates how commonly EF is assessed using PBT. The
5
general neuropsychological test use, as well as the use of specific tests to assess particular
cognitive domains. Of the respondents who participated, 96.3% reported frequently measuring
EF specifically. It was found that the Wisconsin Card Sorting Task (WCST) (Heaton, Chelune,
Talley, Kay, & Curtiss, 1993), Rey–Osterrieth Complex Figure (Rey, 1941), Halstead Category
Test (Halstead, 1947), Trail Making Test (Lewis & Rennick, 1979), and Controlled Oral Word
Association Test (Benton & Hamsher, 1989), were most frequently used in EF assessment. To
further demonstrate the ubiquitous use of PBT-EF, 75.5% of respondents reported using the
WCST specifically (see Strauss, Sherman, & Spreen, 2006 for a detailed list of PBT-EF).
Although each of these tests are intended to measure different components of EF, they share
common characteristics (i.e., standardized administration procedures, they are completed in an
office or laboratory setting, and they categorize performance using accuracy or response time).
In contrast, RI are used to assess EF through the endorsement of observed behavioural
descriptions intended to represent the “typical” functioning of an individual. RI are thought to
measure EF as they occur in naturally complex situations over an extended period of time
(Toplak, West, & Stanovich, 2013). Reports can be given by the individual themselves or by
informants who have had a chance to observe the individual. The items in an EF-RI are intended
to “map onto” particular EF domains (e.g., “do they often rush into things without thinking”
would be a potential question for use in the measurement of impulsivity) and items relating to
conceptually similar domains are collapsed in order to give an overall impression of functioning
in that area. Typically, RI are standardized and functioning is compared to a normative sample.
Important to the assessment of any cognitive domain, ecological validity is a concept intended to
describe that a thing is adequately represented as it exists and functions in the real-world. In the
6
an individual’s functioning by their very nature (i.e., behaviours are assessed through
observations of their typical day-day activities by observers who have observed them over an
extended period of time) (Gioia & Isquith, 2004; Chaytor, & Schmitter-Edgecombe, 2003).
Further, RI are often found to strongly associate with daily living skills and adaptive functioning
in various clinical populations (Barkley & Murphy, 2011; Mangeot, Armstrong, Colvin, Yeates,
& Taylor, 2002; Clark, Prior, & Kinsella, 2002; Gilotty, Kenworthy, Sirian, Black, & Wagner,
2002), although limitations of RI assessment, such as observer bias and competency, are also
important to consider (Denckla, 2002).
Discrepancy Between Inventory and Performance Measures
Multiple EF-RI have been designed so that specific indices equate with cognitive processes
considered the domain of executive function (e.g., organization, reasoning), and others to index
common symptoms seen in those with frontal damage (Malloy & Grace, 2005). One of the most
commonly used EF-RI is the Behavior Rating Inventory of Executive Function (BRIEF; Gioia,
Isquith, Guy, & Kenworthy, 2000) (Toplak, West, & Stanovich, 2013). Toplak, West, &
Stanovich (2013) reviewed the literature and found 13 studies that investigated the relation
between the BRIEF and PBT-EF. On average, only 19% of the possible correlations between the
BRIEF and PBT-EF were statistically significant; additionally, the mean correlation was small (r
= 0.15). When considering other RI (e.g., the Dysexecutive Questionnaire) in addition to the
BRIEF, only 28% of possible correlations were significant and the amalgamated correlation was
again small (r = 0.19). This lack of association fits with numerous studies not included in their
review, or published afterward (Stedal & Dahlgren, 2015; Qian, Shuai, Cao, Chan, & Wang, 2010;
7
The generally small, and often insignificant, relation between these two assessment
procedures has inspired researchers to consider why a stronger or more consistent relation does
not exist. Theorists have offered multiple explanations, most of which involve the concept of
ecological validity. Firstly, many PBT-EF were originally designed to assess impairment related
to particular brain functions and were not intended for use in predicting real-world performance
(Odhuba, Broek, & Johns, 2005). Further, PBT-EF are construct driven and have been developed
to measure theoretically defined constructs, such as inhibition, that are interpretations of data and
not necessarily based on observed phenomena (Burgess et al., 2006). This approach to EF
assessment is problematic because EF is not thought to operate through a single process, but is
reliant on multiple cognitive process-output pathways (Burgess et al., 2006). EF, if we consider it
in a position of supervision or monitoring of discrete processes, cannot be measured through the
lens of singular constructs. Function driven assessment may better capture EF, as the focus
would turn to the “directly observable behavioural output which is the product of a series of
operations…. understood in terms of a goal, instruction or intention to act” (Burgess et al., 2006,
p.196). This issue can also be understood through the framework of the International
Classification of Functioning, Disability and Health (WHO, 2000). A pathological condition can
affect an individual at different levels, including within the individual (i.e., pathology and
impairment) or at an external level, in their activities and participation (Chan, Shum,
Toulopoulou, & Chen, 2008). Construct driven experimental manipulation and testing is
considered to measure EF at the impairment or pathology level, but it is in activity and
participation that ecologically valid functioning can be realized (Chan, Shum, Toulopoulou, &
8
RI measure different levels of EF, and that the cognitive and behavioural manifestations of EF
are essentially separate constructs (Toplak, & Stanovich, 2004).
Another issue relates to the specificity of PBT; the detection of functional impairment is
limited because the testing situation itself undermines the role of EF. These tests are typically
performed in a manner wherein an examiner assumes the role of the participant’s EF: The
examiner monitors their performance, provides instructions, initiates and corrects behaviour, and
sets goals and testing parameters (Manchester, Priestley, & Jackson, 2004). Additionally, any
affective response during testing is properly responded to and resolved (Manchester, Priestley, &
Jackson, 2004). The discrepancy between PBT and RI may also involve differences in temporal
and contextual representation. PBT involve the measurement of EF in a short, decontextualized
span of time, whereas RI capture EF as they unfold in a broad, dynamic, extended context (Gioia
& Isquith, 2004; Manchester, Priestley, & Jackson, 2004; Toplak & Stanovich, 2004). Therefore,
PBT-EF that take account of these criticisms may be in a position to reduce this discrepancy.
Functional Assessment of Verbal Reasoning and Executive Strategies
Although several PBT-EF have been created with the aim of improving ecological validity,
most of these tests require performance in a completely natural environment, reducing practicality
of their use (Chevignard, Soo, Galvin, Catroppa, & Eren, 2012). A limited number of these tasks
can be performed in an office space (Burgess & Shallice, 1997; Chalmers & Lawrence, 1993;
Wilson, Evans, Alderman, Burgess, & Emslie, 1997; Robertson, Ward, Ridgeway, Nimmo-Smith,
& McAnespie, 1991), although their efficacy is still unclear. Research has found these newer
tasks to correlate weakly with RI and adaptive functioning (Toplak, West, Stanovich, 2013; Norris
& Tate, 2000), to have similar discriminability to existing PBT-EF (Norris & Tate, 2000;
9
(Vordenberg, Barrett, Doninger, Contardo, & Ozoude, 2014). Although the tests appear to have
addressed some of the criticisms of PBT-EF, many appear to have retained core issues. For
example, the Brixton Spatial Anticipation Test (BSAT) is a rule attainment task involving
procedures that resemble the WCST. Further, like the WCST, the BSAT is intended to measure set
shifting, strategy generation, performance monitoring, and concept formation, albeit in an
ecologically valid manner (Vordenberg, Barrett, Doninger, Contardo, & Ozoude, 2014; Nyhus &
Barceló, 2009). In the BSAT, participants are presented with stimulus pages containing one blue
circle in a location designated by changing rules; their task is to accurately predict where the
subsequent circle will be. The total number of errors (i.e., incorrect prediction of the circle) across
55 trials is used to classify performance. The format of the BSAT appears to suffer from similar
limitations as conventional PBT-EF (e.g., measurement of discrete constructs over a short period
of time). However, a relatively new but understudied PBT-EF appears to be a promising step
toward ecological validity. The Functional Assessment of Verbal Reasoning and Executive
Strategies (FAVRES) explicitly addressed several limitations of PBT-EF (MacDonald & Johnson,
2005). The FAVRES was specifically designed to improve validity and utility of assessment in
those with acquired brain injury (ABI) (MacDonald & Johnson, 2005). That is, the FAVRES was
intended to be sensitive enough to measure subtle verbal reasoning and executive impairments
associated with frontal lobe damage (MacDonald & Johnson, 2005).
The FAVRES test developers explicitly designed each embedded task to evaluate
performance at the level of ones’ activity and participation, as previous theorists have
recommended (MacDonald & Johnson, 2005; Chan, Shum, Toulopoulou, & Chen, 2008; Tate,
Godbee, & Sigmundsdottir, 2013). As Bilbao et al. (2003) outline, the assessment of activity and
10
environment. An assessment of EF relevant to the domains of activity and participation can only
be done through observation of complex, cognitively integrated, and contextually meaningful
tasks because EF is not active in isolation. Unlike conventional PBT-EF, the FAVRES tasks
present information within a socially-relevant context and asks the participant to “put themselves”
into the situation and engage with the material in a meaningful, goal-directed fashion.
Additionally, each task requires a complex interplay of cognitive processes. These tasks were not
designed to measure discrete EF constructs, but should theoretically invoke EF due to requirement
of integrating and managing relevant goals and task demands using several cognitive components.
That is, if an individuals’ “lower level” cognitive components (e.g., processing speed, memory)
are intact, as these processes are certainly subsumed within the FAVRES, then ones’ FAVRES
performance should represent their capacity to integrate, prioritize, attend to, and “orchestrate” the
components. Again, the content of the FAVRES logically leads one to conclude the tasks are
likely to be measuring EF processes in a contextual space relevant to activity and participation
(Hughes & Orange, 2007).
The largely unstructured and untimed nature of the FAVRES tasks were also thought to
logically lead toward improved ecological validity. Participants are given stimuli and are required
to independently read through task instructions that can be decomposed into a “global goal” and
“sub-goals”. That is, multiple task demands and parameters are given within an overall goal. For
example, the global goal for the Planning An Event task is to choose a birthday event suitable for a
child, while the sub-goals include ensuring the event can be held on a particular day the child is
free, that the event’s cost is within budget, and also suits preferences and availability. The format
of the FAVRES requires participants to find their own method of prioritizing and reasoning
11
Participants are not forced to solve a problem within a short timeframe, which potentially leads to
solutions and reasoning unlike those that would have been made in their own lives. Although
speeded response time indices allow us to make sense of an individual’s ability to use their EF and
other cognitive resources quickly, the creation of an artificial sense of urgency in testing may
reduce test validity. The FAVRES allows participants to apply their “typical” procedure to
problem solving.
Although there is limited research using the FAVRES, current literature suggested that
increased ecological validity of everyday EF would be found. In a pilot study investigating the
relationship between the FAVRES and employment in those with traumatic brain injury (TBI),
FAVRES scores were strongly correlated with successful employment outcome, r = 0.83
(Rietdijk, Simpson, Togher, Power, & Gillett, 2013). A study by Isaki & Turkstra (2000)
investigated the best possible set of cognitive variables within 10 tests that could be used to
discriminate between employed and unemployed TBI patients. The study only used 50% of the
FAVRES subtests, and of those tests, only included one third of the possible FAVRES scores in
their analysis. Despite the small representation of FAVRES measurement, the discriminant
analysis revealed that one of the FAVRES scores, in addition to two scores related to listening
skills, correctly classified 85% of participants. Further, the single FAVRES score (i.e., Scheduling
Accuracy) was determined to be the most powerful discriminator. Additional studies have also
found FAVRES scores to be useful in classifying employment status in neurologically impaired
populations (Meulenbroek & Turkstra, 2016). Further, a systematic review suggests that the
FAVRES is one of a very limited number of tests with consistent specificity and sensitivity in
12
2. The Current Study
Not only is research on the FAVRES scarce, but not a single independent study has
compared FAVRES performance to any EF-RI.The current study examined the concurrent
validity of the FAVRES by assessing its strength in predicting everyday EF as indexed by the
Behavior Rating Inventory of Executive Function, Adult (BRIEF-A; Roth & Gioia, 2005).
Clinicians use PBT to define areas of cognitive strength and weakness in patients, to infer their
levels of daily functioning, and to recommend beneficial treatment. Obviously, the validity of
testing is of paramount concern to the field of psychology (Manchester, Priestley, & Jackson,
2004). This study aimed to establish the validity of the FAVRES in EF assessment and to
determine to what extent criticisms of PBT-EF are important to improved ecological validity of
PBT-EF. The primary research questions included: 1) can FAVRES performance predict everyday
EF, and 2) does FAVRES performance account for unique variance in predicting functioning
beyond that of an indicator of general intelligence. It was hypothesized that FAVRES performance
would be predictive of everyday EF, and that FAVRES scores would account for unique variance
in the prediction model.
3. Methods
Measures
Behavior Rating Inventory of Executive Function – Adult Version (BRIEF-A). The
BRIEF-A is a self-report behavioural inventory used to assess the presence of EF difficulties
experienced by an individual over the last six months (Roth & Gioia, 2005). In regard to this
measure, EF is conceptualized as “a set of interrelated control processes involved in the
selection, initiation, execution, and monitoring of cognition, emotion and behavior, as well as
13
composed of 75 statements that describe various behaviours considered to reflect EF.
Individuals are asked to rate on a three-point scale how often they experience problems with the
behaviour: “Never = 0, Sometimes = 2, or Always = 3”. The BRIEF-A derives an overall score,
the Global Executive Composite (GEC), which is composed of two index scores, the
Metacognition Index (MCI) and the Behavioural Regulation Index (BRI). The GEC is
considered a useful summary of an individual’s EF performance (Roth & Gioia, 2005).
Therefore, the current study utilized GEC scores as the index of participants’ everyday EF. Five
subscales are used to derive the MCI (Initiate, Working Memory, Plan/Organize, Task Monitor,
Organization of Materials) and four subscales are used to derive the BRI (Emotional Control,
Inhibit, Shift, Self-Monitor). The MCI is understood to represent ones’ ability to systematically
solve problems through planning, organizing, sustaining effort, and working memory (Roth &
Gioia, 2005). EF components related to inhibition and regulatory control of behaviour and
emotion are captured by the BRI (Roth & Gioia, 2005). Raw scores of the normative group were
smoothed using linear or polynomial transformations to create a T distribution with a mean score
of 50, and standard deviation of 10 for the GEC, MCI and BRI (Roth & Gioia, 2005). Therefore,
a T score of 65 or greater on these indices suggests the problems reported are clinically relevant.
Three validity scales are also embedded; the Negativity Scale is used to determine unusually
negative responding; the Infrequently Scale is used to determine the extent to which atypical
items were endorsed, and response convergence is indexed with the Inconsistency Scale. These
scales are used to determine likelihood of invalid responding.
The normative sample of the BRIEF-A includes 1,050 healthy adults who participated in
an online survey. The sample approximates the 2002 U.S population in regard to gender,
14
with the census data (Roth & Gioia, 2005). The authors report group differences on some scales
based on race/ethnicity, education, and gender. African American respondents scored slightly
higher than Hispanic respondents on Organization of Material, but this finding is interpreted as
non-meaningful (only 1% of score variance was accounted for by race/ethnicity). Those with
more education scored somewhat lower on Emotional Control and Self-Monitor, although the
correlation was weak (r = -0.14 and r = -0.10, respectively). Women reported greater difficulty
with Emotional Control, but gender accounted for only 2% of score variance on the scale. Since
differences were found between ages on almost every scale, with younger participants reporting
more difficulties, the authors separated the sample into distinct age-bands (18 – 29, n =165; 30 –
39, n = 170; 40 – 49, n = 141; 50 – 59, n =123; 60 – 69, n = 120; 70 – 79, n = 162; 80 – 90, n =
124).
Cronbach’s alpha (i.e., a measure of consistency between items intended to measure the
same construct) ranged from 0.73 – 0.90 for subscales, and from 0.93 – 0.96 for indices and the
GEC. Test-retest reliability was based on a subsample of the normative group (n = 50, 56%
female, Mage = 39.43 years) after an average interval of 4.22 weeks. Subscale retest correlations
ranged from 0.82 – 0.93 (BRI and MCI, r = 0.93; GEC, r = 0.94), demonstrating strong
reliability. Validity of the BRIEF-A has been supported through comparisons to other RI
intending to measure similar or dissimilar constructs. Scores of individuals with mixed clinical
diagnoses have been found to covary on the BRIEF-A and Frontal Systems Behaviour Scale
(FrSBe) (Grace & Malloy, 2000), a measure designed to assess apathy, disinhibition, and
executive dysfunction (Roth & Gioia, 2005). Particularly strong correlations were found between
the GEC and Executive Dysfunction Scale (EDS) of the FrSBe (r = 0.67). Additionally, the EDS
15
scales were also found to correlate with the Dysexecutive Questionnaire total score (r from 0.73
– 0.84 for the index and global scores and 0.38 – 0.80 for subscale scores) (Roth & Gioia, 2005).
BRIEF-A scores were also compared to mental health symptom inventories. Relations
between the BRIEF-A GEC and the Clinical Assessment of Depression (CAD) were lower than
those generally found with other EF-RI (CAD Depressed Mood Index, r = 0.37; CAD
Anxiety/Worry Index, r = 0.51) and correlations with the Beck Depression Inventory were
similar (r = 0.49 – 0.59) (Roth & Gioia, 2005). However, there is clearly an important
relationship between BRIEF-A scales and mental health. This is in line with research finding the
BRIEF-A to correlate with emotional distress (Løvstad et al., 2016). This is also consistent with
literature suggesting that those with psychiatric disorders often exhibit EF impairments (Royal et
al., 2002). In both the normative sample and a mixed clinical/healthy sample, exploratory factor
analysis has supported the BRIEF-A’s two-factor model (Roth & Gioia, 2005). However,
additional research suggests that a three-factor solution would better discriminate between
clinical and non-clinical samples (Roth, Lance, Isquith, Fischer, & Giancola, 2013). Overall, the
BRIEF-A has documented at least adequate divergent and convergent validity, as well as strong
reliability. Further, research has demonstrated that populations suspected to have selective EF
impairment perform poorly on relevant BRIEF-A scales (Rabin et al., 2006; Reid, Karim,
McCrory, & Carpenter, 2010; Biederman et al., 2005).
Functional Assessment of Verbal Reasoning and Executive Strategies (FAVRES).
The FAVRES is a battery of PBT intended to measure subtle cognitive-communication skills in
the context of EF demands (MacDonald & Johnson, 2005; MacDonald, 2005). The FAVRES
was explicitly designed to measure subtle deficits in those with ABI and has been found to
16
(MacDonald & Johnson, 2005; MacDonald, 2005). The FAVRES describe EF as reflecting
“awareness, goal setting, planning, directing, initiating, inhibiting, monitoring,
self-evaluation, and flexibility in problem solving” (MacDonald, 2005, p. 4). Additionally, the
application and manipulation of novel information during decision-making is given emphasis in
the FAVRES conceptualization of EF. There are four tasks within the FAVRES and they need
not be administered in any particular order. Each task is embedded within a simulated social
context requiring a variety of cognitive skills; this structure was thought to help better parallel
complex everyday action.
The tasks include: 1) Planning An Event, 2) Scheduling, 3) Making A Decision, and 4)
Building A Case. For task one, the participant must search through mock entertainment pages to
find the most applicable birthday event for a child, while following task guidelines (e.g., they
cannot choose an event only available on a particular day of the week). Scheduling involves the
participant being given a to-do list to complete in a 9:00am – 4:30pm workday. Participants are
provided with an estimated timeframe for each item and must organize and designate specific
timeslots to complete as much as they can from their list. Making A Decision requires the
participant to read through the transcript of a family conversation and determine which gift, out
of a list of gifts, would be preferred by a particular family member. Building A Case presents the
written history of an individual’s relationship with a hired professional. The participant is asked
to formulate a complaint regarding the professional’s poor work performance. Each of these
tasks require the integration of multiple EF components, including planning, organization, task
monitoring, problem solving, cognitive flexibility, working memory, inhibition, attention, and
sustained effort (MacDonald, 2005). FAVRES performance is measured with four variables, 1)
17
each task, and are used to derive a total standard score of Time, Accuracy, Rationale and
Reasoning Subskills. Time is used to capture efficacy of performance; it is the length of time
required, in minutes and seconds, to complete each task. As there are no time limits and
participants do not necessarily know they are being timed, Time was thought to provide an
estimate of real-world activity efficiency using individuals’ complete set of resources (i.e., they
are not forced to provide an inaccurate solution because they are limited by time). However, due
to practical limitations of the current study, participants were given a maximum time limit of 15
minutes to complete the Planning An Event, Making A Decision, and Building A Case task, and
25 minutes to complete the Scheduling task. The Accuracy score is a measure of task solution
accuracy. For each task, points are awarded based on a gradient of solutions, ranging from 5
points (the answer accounts for most task demands) to 0 (the answer is entirely inaccurate or
inappropriate, or no answer was given). Accuracy allows an index of participants’ ability to solve
the task, regardless of how long it takes them to do so. On tasks one through three, participants
write out their reasons for choosing their solution; these reasons form their Rationale score.
Valid reasons are provided in the examiners response booklet and each reason is given one point.
Participants can be awarded up to 5 Rationale points, if they can provide at least three valid
reasons for their decision. The Rationale score is calculated differently for Building A Case. In
this task, the Rationale score is based on the total number of appropriate and inappropriate
solutions described in their argument. The greatest possible score of 5 points is only awarded if
the participant provides three reasonable solutions and no inappropriate solutions (MacDonald,
2005). Rationale assesses an individual’s ability to reason through task demands, as well as their
ability to communicate their reasoning through written expression. After each of the four tasks,
18
Facts, 2) Filter Out Irrelevant Information, 3) Weight The Relevant Choices, 4) Be Flexible, 5)
Generate Alternatives, and 6) Make Predictions. The total Reasoning Subskills score is the
culmination of all points accrued from the follow-up questions after each of the four tasks. Time,
Accuracy, Rationale, and Reasoning Subskills scores are then converted into standard scores (M
=100, SD = 15) and given a percentile rank for each of the tasks. These standard scores are
compared to the normative sample to assess performance. For the purposes of this study, the total
standard score for Time, Accuracy, Rationale and Reasoning Subskills were averaged (i.e.,
added together and then divided by four) to create a single standard score of each participant’s
FAVRES performance (FAVRES-C).
The normative sample includes 101 healthy individuals between the ages 18 – 79 (M =
38.59 years, SD = 14.41, Meducation= 15.62 years, SD = 2.59). To test whether FAVRES
performance was a function of age or education, correlations were conducted. Neither age or
education revealed performance differences for Rationale or Accuracy scores (MacDonald,
2005). Analyses were not reported for Time or Reasoning Subskills. A comparison sample of 52
individuals with ABI were recruited to assess FAVRES sensitivity and specificity (Mage = 34.56
years, SD = 13.33, Meducation= 13.86 years, SD = 2.48). It was found that a combination of total
Accuracy and Rationale scores correctly identified group membership for 83% of controls and
88% of ABI participants (MacDonald, 2005). Additional performance comparisons revealed that
the ABI group scored significantly lower than controls on Accuracy, Rationale, Time, and
Reasoning Subskills (MacDonald, 2005). Comparison of FAVRES performance in those with
ABI to the Scales of Cognitive Ability for Traumatic Brain Injury (SCATBI; Adamovich &
Henderson, 1992) revealed moderate correlations between Accuracy and the reasoning scale of
19
were relatively low (SCATBI Recall and FAVRES Accuracy, r = 0.20). Data on FAVRES
reliability is limited. Inter-rater reliability was computed by comparison of Accuracy and
Rationale scores from two speech-language pathologists with a sample of 10 ABI and 10 control
participants (MacDonald & Johnson, 2005). Kappa reliabilities were 0.81 and 0.85, respectively.
Reliabilities were also calculated between the first author of the paper and a research assistant on
one subtest of the FAVRES, κ = 0.86 (MacDonald & Johnson, 2005). Continued investigation is
needed to gain further knowledge of this test’s psychometric properties.
Wechsler Test of Adult Reading (WTAR). The WTAR is a commonly used measure of
premorbid intelligence appropriate for those aged 16 – 89 years (Wechsler, 2001; Strauss,
Sherman, & Spreen, 2006). The test examines a participant’s pronunciation accuracy of 50 words
which embody irregular and uncommon grapheme to phoneme characteristics. This procedure is
thought to require cognitive skills acquired before injury on-set and indeed, research has found
reading recognition to be relatively resistant to brain injury, disease, and age-related cognitive
decline (Franzen, Burgess, & Smith-Seemiller, 1997; Wechsler, 2001). Empirical research also
supports the suggestion that WTAR scores are resistant to Parkinson’s Disease, Huntington’s
Disease, Wernicke-Korsakoff Syndrome, neuropsychiatric illness, and traumatic brain injury
(Strauss, Sherman, & Spreen, 2006; Green, Melo, Christensen, Ngo, Monette, & Bradbury,
2008). However, WTAR scores are less resistant to severe TBI (Mathias, Bowden, Bigler, &
Rosenfeld, 2007) and advanced dementia (Donnell, Pliskin, Holdnack, Axelrod, & Randolph,
2007; Strauss, Sherman, & Spreen, 2006). Additionally, the WTAR has been found to
significantly under predict intelligence in those with reading disabilities, and it is recommended
that the WTAR not be used with this population (Wechsler, 2001; Strauss, Sherman, & Spreen,
20
The WTAR was co-normed with the Wechsler Adult Intelligence Test – III (WAIS-III),
therefore, the prediction of WAIS-III index scores and FSIQ is available (Wechsler, 2001). After
test completion, the participant’s raw score (i.e., total number of correctly pronounced words) is
converted to an age-corrected standard score and used to estimate an individual’s FSIQ.
Predicted intelligence scores are derived from normative data stratified by education, age,
gender, geographic region and race/ethnicity (Wechsler, 2001). Intelligence estimates can be
derived using demographic data alone (age, gender, ethnicity, and education), WTAR
performance alone, or a combination of performance and demographic data (Wechsler, 2001). In
the estimation of intelligence, it is recommended that consideration of demographic variables
and performance be used, as this combined methodology increases accuracy (Franzen, Burgess,
& Smith-Seemiller, 1997; Axelrod, Vanderploeg, & Schinka, 1999). However, the WTAR
combined prediction method only allows for normative comparison to ethnic groups considered
“White” or “African American”, although “Hispanic” normative data is also available for some
age bands (Wechsler, 2001). Therefore, the current study utilized the WTAR performance
prediction method; this method accounts for age and performance only (Weschler, 2001).This
prediction method was used to prevent inaccurate ethnic group comparison, as a large portion of
the study sample did not fit into the three ethnic categories available for comparison.
The WTAR normative sample includes 1,134 individuals stratified to reflect the 1999
U.S population with respect to age, gender, education, race-ethnicity, and geographic region
(Wechsler, 2001). The test developers divide the sample into 13 age bands. Test-retest reliability
is reportedly high across all age bands (Mr = 0.90, Mdays = 35) and minimal practice effects were
observed in the test-retest sample across the age bands (Mdifference = -0.80) (Strauss, Sherman, &
21
0.73; Verbal Intelligence, r = 0.75; Performance Intelligence, r = 0.59; Perceptual Organization,
r = 0.65; Processing Speed, r = 0.47; Working Memory, r = 0.62). Correlations were weaker in a
clinical sample (r = 0.34 – 0.66), which has been interpreted to suggest that WAIS-III scores are
likely more affected by clinical disease than WTAR scores (Strauss, Sherman, & Spreen, 2006).
Accuracy of WTAR prediction is strong; in 70.4% of cases, the WTAR score alone (i.e., without
inclusion of demographic characteristics) predicted scores within ±10 points of their actual FSIQ
score. Additionally, 38.7% of cases were accurately predicted within ±5 points of their FSIQ
(Strauss, Sherman, & Spreen, 2006). The WTAR has strong psychometric properties, although,
research has found classification accuracy to be affected by range restriction. That is, the WTAR
underestimates FSIQ at high-range values and overestimates at low-range values (Strauss,
Sherman, & Spreen, 2006; Mathias, Bowden, & Barrett-Woodbridge, 2007). Despite this
limitation, the WTAR is commonly used and has been utilized with populations that include
individuals with schizophrenia (Kern et al., 2009; Horan, Kring, Gur, Reise, & Blanchard, 2011;
Leeson, Sharma, Harrison, Ron, Barnes, & Joyce, 2011; Strauss et al., 2012; Sheffield, Williams,
Woodward, & Heckers, 2013), drug users (Bedi & Redman, 2006), acquired brain injury
(McDonald, Tate, Togher, Bornhofen, Long, Gertler, & Bowen, 2008; Bradbury, Christensen,
Lau, Ruttan, Arundine, & Green, 2008), and depressed older adults (Birch & Davidson, 2007).
Demographic questionnaire (DQ). The DQ was designed by the primary experimenter
and can be reviewed in Appendix A. The DQ asks participants to report any concerns regarding
their psychological health; their responses were considered to reflect either formal diagnoses or
mental health concerns, as follow-up clarification of participants’ answers were inconsistently
applied by examiners (i.e., not every participant was asked if their reported concerns were formal
22
were classified in one of two binary categories: With Psychopathology = 1 or Without
Psychopathology = 0. This binary coding reflects the variable “History of Psychopathology”.
Participants were also asked to report the degree of their home-life stress, response options were
coded as such: None = 0, Some = 1, or Alot = 2. Their response to this question reflects the
variable “Stress Levels”. Participants also described their state (i.e., occurring at the time of
testing) levels of energy, depression, anxiety, fatigue, and pain by drawing an X on a line
anchored at each end by opposites levels of the given state (e.g., from “not depressed at all”
anchoring one end of the line to “extremely depressed” anchoring the opposite side of the line).
The participants’ placement of the X on each line was measured in millimetres with a ruler, thus
giving each participant a unique score for each of the states (Erdodi, 2017). A composite index
titled “State Distress” was derived by summing the individual millimeter measurements for
depression, anxiety, fatigue, pain and state energy (which was reverse coded, therefore less
energy is reflected by higher scores). Overall, higher scores on “State Distress” reflect greater
levels of state depression, anxiety, fatigue and pain while also representing less energy. In
contrast, lower scores reflect less state depression, anxiety, fatigue and pain, while also
representing higher amounts of state energy.
Study Design and Procedures
Participants were recruited through the undergraduate psychology participant pool at the
University of Windsor, and given 0.5 credits per 30 minutes of their participation (n = 51).
Additional participants self-enrolled into the study by responding to advertisements posted
throughout Windsor, Ontario (n = 31). These participants were given a $10 Tim Horton’s gift
card for their time.Participants underwent study procedures in a private room located at the
23
were given a chance to discuss additional questions. All participants completed the DQ before
beginning further procedures. Participants then completed the FAVRES, the WTAR, and the
BRIEF-A. To reduce order effects, a computerized number randomizer determined
administration order for each participant. Procedures were completed in one session, which took
between 1 and 1.5 hours.
Participant Characteristics
Participants included in the final data analyses were: 1) self-reported to be fluent in the
English language, 2) between the ages of 18 to 25 years, 3) free of vision impairment, 4) found
to have a WTAR predicted FSIQ > 70, and 5) considered to pass the three BRIEF-A validity
indexes (i.e., ≤ 7 on the Inconsistency Scale and ≤ 2 on the Infrequency Scale and ≤ 5 on the
Negatively Scale). Eighty-two individuals were recruited for the study in total; of this sample,
four participants were excluded from final data analyses due to age exclusion (n = 2) or elevated
BRIEF-A validity indexes (n = 2). Therefore, the final sample included 78 individuals meeting
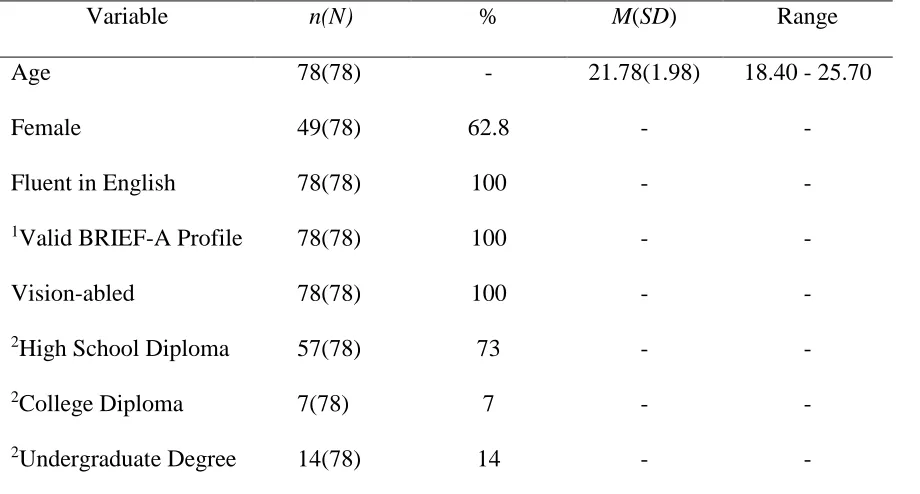
study criteria (63% female; Mage = 22 years). Table 1 displays basic demographic characteristics
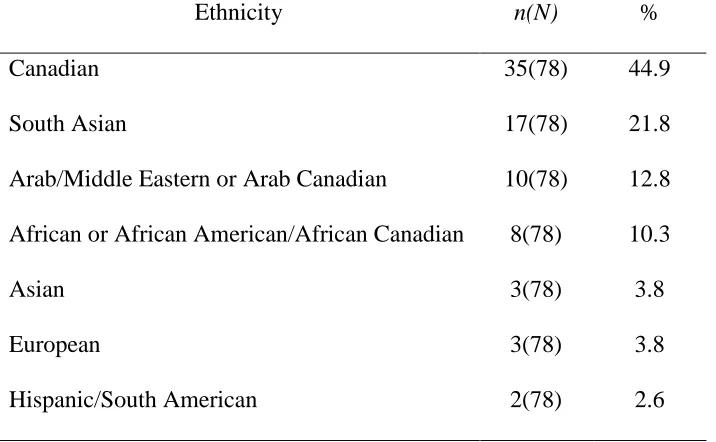
of the final sample. Table 2 highlights the ethnic composition of the sample. Finally, the
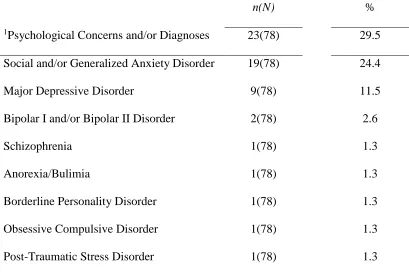
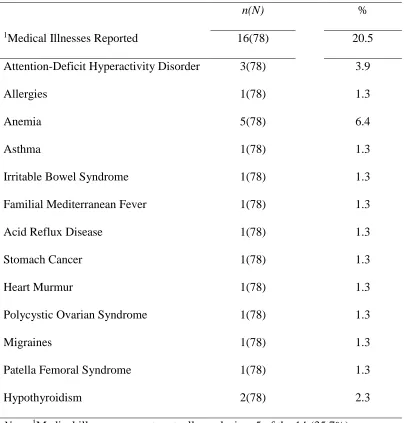
psychological and medical characteristics of the sample are described in Table 3 and 4,
24 Table 1
Basic Demographic Characteristics of Sample
Variable n(N) % M(SD) Range
Age 78(78) - 21.78(1.98) 18.40 - 25.70
Female 49(78) 62.8 - -
Fluent in English 78(78) 100 - -
1Valid BRIEF-A Profile 78(78) 100 - -
Vision-abled 78(78) 100 - -
2High School Diploma 57(78) 73 - -
2College Diploma 7(78) 7 - -
2Undergraduate Degree 14(78) 14 - -
Note. 1BRIEF-A = Behavior Rating Inventory of Executive Function, Adult version.
2Highest level of education already completed, as reported on the demographic
25 Table 2
Final Sample Ethnic Composition
Ethnicity n(N) %
Canadian 35(78) 44.9
South Asian 17(78) 21.8
Arab/Middle Eastern or Arab Canadian 10(78) 12.8
African or African American/African Canadian 8(78) 10.3
Asian 3(78) 3.8
European 3(78) 3.8
Hispanic/South American 2(78) 2.6
26 Table 3
Psychological Characteristics of Final Sample
n(N) %
1Psychological Concerns and/or Diagnoses 23(78) 29.5
Social and/or Generalized Anxiety Disorder 19(78) 24.4
Major Depressive Disorder 9(78) 11.5
Bipolar I and/or Bipolar II Disorder 2(78) 2.6
Schizophrenia 1(78) 1.3
Anorexia/Bulimia 1(78) 1.3
Borderline Personality Disorder 1(78) 1.3
Obsessive Compulsive Disorder 1(78) 1.3
Post-Traumatic Stress Disorder 1(78) 1.3
Note. 1Psychological concerns and/or diagnoses are not mutually exclusive: 11 of
the 23 (47.8%) individuals who reported a psychological concern and/or diagnosis
27 Table 4
Medical Characteristics of Final Sample
n(N) %
1Medical Illnesses Reported 16(78) 20.5
Attention-Deficit Hyperactivity Disorder 3(78) 3.9
Allergies 1(78) 1.3
Anemia 5(78) 6.4
Asthma 1(78) 1.3
Irritable Bowel Syndrome 1(78) 1.3
Familial Mediterranean Fever 1(78) 1.3
Acid Reflux Disease 1(78) 1.3
Stomach Cancer 1(78) 1.3
Heart Murmur 1(78) 1.3
Polycystic Ovarian Syndrome 1(78) 1.3
Migraines 1(78) 1.3
Patella Femoral Syndrome 1(78) 1.3
Hypothyroidism 2(78) 2.3
Note. 1Medical illnesses are not mutually exclusive: 5 of the 14 (35.7%)
individuals who reported a medical illness reported more than one medical
28 Data Analysis
All analyses were conducted using SPSS 22.0. To address the primary hypotheses, a
hierarchical multiple regression was used to predict GEC scores. This statistical technique
allows interpretation of the effect of each predictor variable on the outcome variable, controlling
for the effect of variables entered into previous blocks (Fields, 2013). Therefore, this analysis
allows for interpretation of the effect of estimated FSIQ scores on GEC score prediction
independently, as well as for interpretation of the effect of FAVRES-C scores in the prediction of
GEC scores, controlling for estimated FSIQ scores. In the prediction of GEC scores, participant
estimated FSIQ was entered into Block 1 of the model, followed by FAVRES-C scores in Block
2 of the model.
Given that the purpose of this study was to examine the concurrent validity of the
FAVRES by determining if FAVRES performance would predict BRIEF-A scores, investigation
into the correlations between study variables was extraneous to the hypotheses and therefore
conducted exploratorily. Considering that prior research has found indices of psychopathology to
relate to BRIEF scores (Roth & Gioia, 2005; Løvstad et al., 2016), the relation between the study
variables (i.e., FAVRES, WTAR, BRIEF-A) and indices of mental health (i.e., State Distress,
History of Psychopathology, Stress Levels) were of particular interest. Pearson’s product
moment correlation was conducted where appropriate, otherwise, Spearman’s Rho and
point-biserial correlations were used. Given the post-hoc correlations found between BRIEF-A scores
and all indices of mental health (i.e., Stress Levels, History of Psychopathology, State Distress),
a regression analysis was utilized in order to determine the relative importance of these variables
on everyday EF. Considering the absence of a-priori theory regarding the relation between these
29
a simultaneous forced entry method was used). A review of all assumptions for primary and
post-hoc analyses, as well as a description of the results, are presented below.
4. Results
Assumptions
All assumptions of multiple regression, bivariate and point biserial analyses were
assessed for primary and post-hoc analyses before data interpretation. The assumption of
normality of the outcome variable was checked by reviewing histograms and employing Shapiro
Wilk’s test of normality; GEC scores were found to be normally distributed. The assumption of
adequate sample size was met for the primary regression analysis; using G*Power 3.0.10
software, a R2 change model power analysis revealed a minimum sample size of 68 was required
for 80% power, given a 0.05 probability value of Type I error, and a small effect size (f2 = 0.15).
Therefore, the current sample of 78 is sufficient. Post-hoc regression analyses also met this
assumption; Pituch & Stevens (2015) recommend a minimum of 15 cases per predictor variable.
In predicting GEC scores, three predictor variables were used. This analysis included 78 cases,
therefore, this assumption was met. Linearity between the predictor variables and outcome
variable is assumed in multiple linear regression as well (Cohen, Cohen, West, & Aiken, 2003).
Visual inspection of normal Q-Q plots, bivariate scatterplots, and residual by predicted plots
revealed linearity between the predictors and outcome variable in primary and post-hoc
regression analyses (Cohen, Cohen, West, & Aiken, 2003). Normality of residuals was visually
inspected using residual normal Q-Q plots, histograms, and in addition, Shapiro Wilk’s test of
normality was conducted on both standardized and unstandardized residuals (Cohen, Cohen,
West, & Aiken, 2003). Residuals were found to be normally distributed for primary and post-hoc
30
the Variance Inflation Factor score (VIF) cut-off recommendation of 10 (Tabachnick & Fidell,
2001; Cohen, Cohen, West, & Aiken, 2013), the assumption of multicollinearity was met for
primary (VIF = 1.14; regression predicting BRIEF-A GEC scores) and post-hoc regression
analyses (VIF = 1.42; regression predicting BRIEF-A GEC scores). Residual by predicted
scatterplot inspections and employment of the Breusch–Pagan test (Zeileis, & Hothorn, 2002;
Cohen, Cohen, West, & Aiken, 2013) revealed no violations of homoscedasticity for primary or
post-hoc regression analyses. Outliers were reviewed by visual inspection of standardized
residual by standardized predicted score scatterplots; given a recommended cut-off score of 3 for
“unusual” cases (Field, 2013), few cases were of concern across the primary and post-hoc
regression analyses. However, these cases were evaluated further to determine their influence on
their respective regression equations. Cooks D values were reviewed and potential outliers across
the regression analyses were found to be well below the suggested Cooks D cut-off of 1 and
therefore, data removal was not warranted for these cases (Field, 2013).
The assumptions of bivariate correlations were also checked. Scatterplots were visually
inspected, and Shapiro Wilk’s test of normality was employed, to determine if variables were
normality distributed (Field, 2013). For those variables that were found to violate this
assumption (i.e., Stress Levels, History of Psychopathology, and State Distress), non-parametric
correlation analyses were conducted and interpreted (Field, 2013). The assumption of continuous
or ordinal measurement for bivariate and nonparametric correlation was also considered; for
those variables that were binary in nature (i.e., History of Psychopathology), point biserial
correlations (i.e., anchored with values of either “0” or “1”) were used (Field, 2013). All
31 Primary Analysis
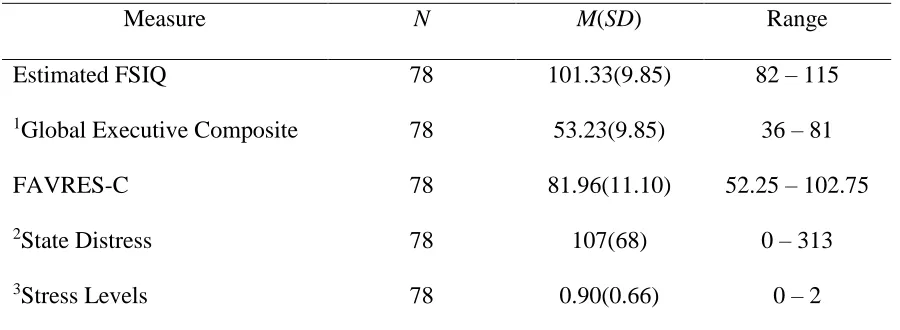
A description of participant scores on relevant study measures is provided in Table 5.
Table 5
Participant Performance on Study Measures
Measure N M(SD) Range
Estimated FSIQ 78 101.33(9.85) 82 – 115
1Global Executive Composite 78 53.23(9.85) 36 – 81
FAVRES-C 78 81.96(11.10) 52.25 – 102.75
2State Distress 78 107(68) 0 – 313
3Stress Levels 78 0.90(0.66) 0 – 2
Note. 1BRIEF-A T scores with a M = 50; higher scores represent greater impairment.
2Higher scores represent greater levels of state depression, anxiety, fatigue and pain but
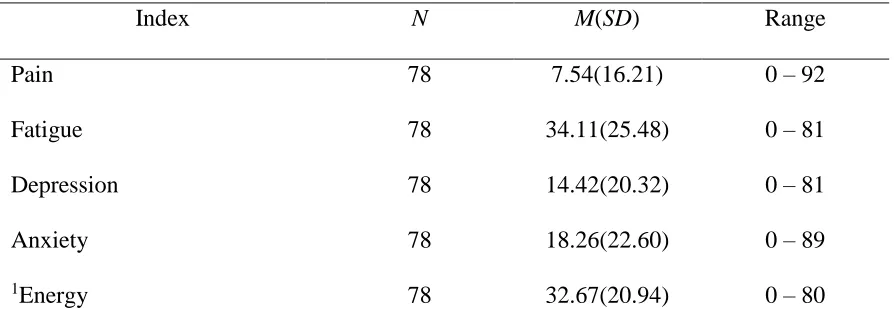
32 Table 6
Participant Levels of State Distress
Index N M(SD) Range
Pain 78 7.54(16.21) 0 – 92
Fatigue 78 34.11(25.48) 0 – 81
Depression 78 14.42(20.32) 0 – 81
Anxiety 78 18.26(22.60) 0 – 89
1Energy 78 32.67(20.94) 0 – 80
Note. As measured with the V5 on the demographic questionnaire. 1Reverse coded;
higher scores represent less state energy.
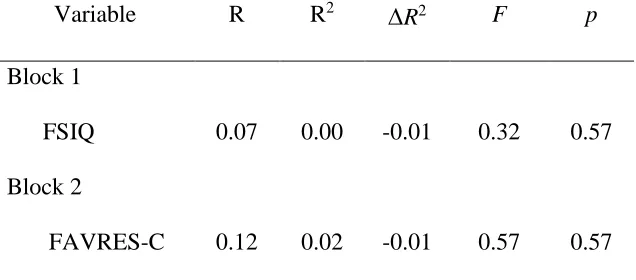
Hierarchical Multiple Regression Predicting GEC Scores. A two-block hierarchical
multiple regression was conducted in the prediction of GEC scores. Participants’ estimated FSIQ
was entered first, followed by FAVRES-C scores in Block 2. Neither FSIQ scores, F (1,76) =
0.32, p = 0.57, or FAVRES-C scores, F (1,75) = 0.82, p = 0.37, significantly contributed to the
prediction of GEC scores. Therefore, this model was not considered a good fit for the data, and
interpretation of regression coefficients was not conducted. A summary of the model statistics is
presented in Table 7. Additionally, correlations between FAVRES subtests and BRIEF-A
subscales are presented in Table 8. As displayed, few relations were found between the two
33 Table 7
Summary of Model Statistics in Regression Predicting GEC Scores
Variable R R2 R2 F p
Block 1
FSIQ 0.07 0.00 -0.01 0.32 0.57
Block 2
FAVRES-C 0.12 0.02 -0.01 0.57 0.57
34 Table 8
Correlations Between FAVRES Subscores and BRIEF-A Subscales
1Time 1Reasoning 1Rationale 1Accuracy Composite
2BRIEF-A Subscales
Inhibit 0.15 -0.04 0.11 -0.02 0.07
Shift -0.04 -0.08 -0.12 0.04 -0.04
Emotion Control 0.13 -0.07 -0.15 -0.06 -0.03
Self-Monitor 0.18 -0.01 -0.07 -0.00 -0.01
Initiate -0.03 -0.18 -0.17 -0.08 -0.15
Working Memory 0.01 -0.16 -0.20 -0.21 -0.20
Planning/Organization -0.19 -0.19 -0.20 -0.08 -0.22*
Task Monitoring 0.01 -0.18 -0.07 -0.16 -0.13
Organization of Materials 0.06 0.02 0.06 0.04 0.08
Note.N = 78; Spearman’s rank ordered correlations are reported.*p ≤ 0.05, two tailed.
1FAVRES standard scores reported. 2T scores reported. Composite = FAVRES- C.
Post-hoc Analysis
Bivariate, Rank Ordered, and Point Biserial Correlations. Relations between the
FAVRES-C, BRIEF-A GEC, estimated FSIQ and variables related to mental health (i.e., Stress
Levels, History of Psychopathology, State Distress) were conducted. As previously mentioned,
the latter analysis was considered appropriate as previous literature has found indices of mental
health to correlate with BRIEF scores (Roth & Gioia, 2005; Løvstad et al., 2016). Results of the
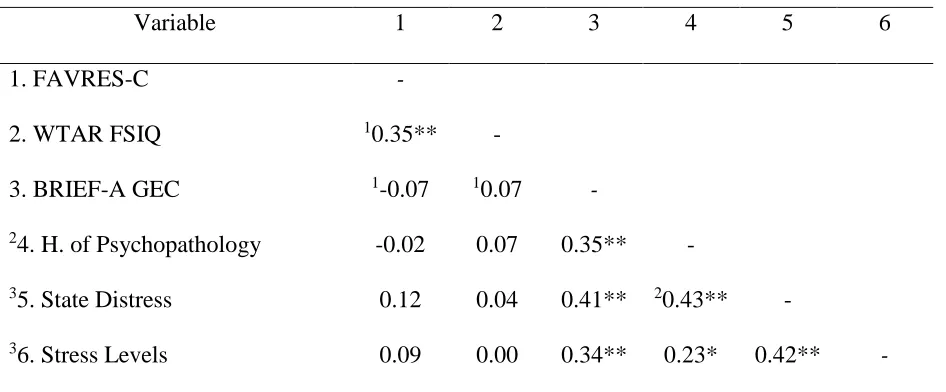
35
correlation was found between FAVRES-C and estimated FSIQ, r = 0.35, p = < 0.01. Neither the
FAVRES-C nor estimated FSIQ were significantly correlated with GEC scores, r = 0.07, p =
0.57, and r = -0.07, p = 0.52, respectively. However, relations between GEC scores and all
variables related to mental health were positively correlated (i.e., Stress Levels, History of
Psychopathology, and State Distress). These findings warranted an additional regression analysis
in order to determine the relative importance of each of these mental health variables on
everyday EF.
Table 9
Correlations Between Relevant Study Variables
Variable 1 2 3 4 5 6
1. FAVRES-C -
2. WTAR FSIQ 10.35** -
3. BRIEF-A GEC 1-0.07 10.07 -
24. H. of Psychopathology -0.02 0.07 0.35** -
35. State Distress 0.12 0.04 0.41** 20.43** -
36. Stress Levels 0.09 0.00 0.34** 0.23* 0.42** -
Note. N = 78. **p < 0.01, two tailed. *p < 0.05, two tailed. 1 Pearson product moment
correlation. 2Point biserial correlation: “Without Pathology = 0” and “With Pathology = 1”.
3Spearmen’s rank ordered correlation reported. H. of Psychopathology = History of
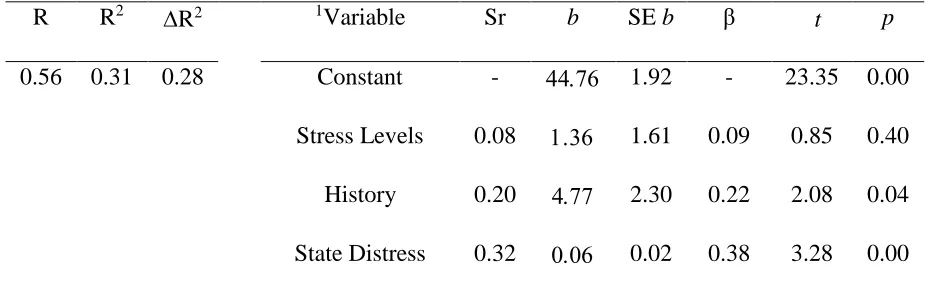
Psychopathology. ………...
Multiple Regression Predicting GEC Scores. A multiple regression using the