1
Development, Implementation and Implications of the Enhanced Fujita Scale
James R. McDonalda and Kishor C. Mehtab
a
Professor and Chair of Civil Engineering, Texas Tech University, Lubbock, Texas USA, retired, [email protected]
b
Horn Professor of Civil Engineering, Texas Tech University, Lubbock, Texas USA [email protected]
Keywords: Tornadoes, Fujita Scale, wind damage, tornado intensity, tornado records, tornado risks
1 ABSTRACT
The Enhanced Fujita Scale was developed to overcome some limitations of the Fujita scale. Personnel from the Wind Science and Engineering Research Center at Texas Tech University undertook the project with the goal to make major improvements while obtaining general consensus within the engineering and meteorological communities. This paper describes the approach, the methodology, results and implications of the studies that finally lead to
implementation of the EF Scale by the US National Weather Service in 2007.
2 INTRODUCTION
The Enhanced Fujita Scale (EF Scale) was implemented by the US National Weather Service in February 2007 as the official measure of tornado intensity. The EF Scale replaced the Fujita Scale (F Scale) that had been in use since 1971. The EF Scale is designed to overcome deficiencies and inconsistencies of the original, and this paper identifies the need and traces the development and implementation of the EF Scale.
Dr. T. T. Fujita (1971) invented the Fujita Scale as a means of distinguishing weak tornadoes from strong ones. In deriving the F-Scale equation, the Beaufort force 12 was connected with Mach number 1 by a smooth curve. Beaufort 12 corresponds to F1 and M1 with F12 so that a graduated scale 1 through 12 is obtained. F0, which is the threshold of no damage, is analogous to Beaufort 0, or a calm wind. The practical range of tornado wind speeds expected in tornadoes is from F0 to F5. The F-scale wind speed is defined as a fastest one-quarter mile wind speed at 10 m above ground in flat open terrain. In 1971, the frame of reference for wind speed in the US was fastest-mile wind speed. Fujita reasoned that only a fraction of a mile of wind is required to destroy structures and trees. Thus, he defined the fastest one-quarter mile wind speed.
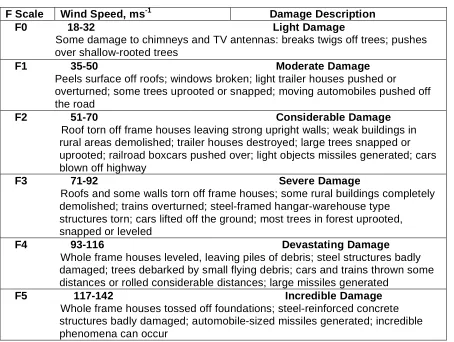
With a range of wind speed categories defined, Fujita then attempted to describe the type of damage one would expect in each wind speed range from F0 to F5. Table 1
summarizes the wind speed ranges and damage descriptions for each F-Scale category. He also provided a set of photos, which showed typical damage in each category.
While the Fujita Scale served a useful purpose over the years, various limitations and discrepancies have been documented. The primary limitations are a lack of damage
indicators, failure to account for construction quality and variability, and no definitive
2
(e.g. barns, houses, trees and various objects) are limited in number and are not well defined. The descriptors do not recognize different building types and the variation of construction systems that can be employed. The damage descriptions in each F-scale category are based on the considerable experience of Dr. Fujita. There has never been a systematic peer review of the damage/wind speed relationships; however, Minor, et al. (1977) performed analytical calculations of wind speed to cause certain postulated damage to typical residential
construction, and found that F-scale categories F3, F4 and F5 overestimate the wind speeds required to cause the damage. Phan and Simiu (1998) studied the effects of the Jarrell Tornado of May 27, 1997. Although the appearance of damage indicated F5 wind speeds, other indicators suggested the damage could occur at much lower wind speeds. A further limitation was the inconsistency of assigning the F-scale ratings to tornado events. One person might assign an F0 whereas someone else would assign F2 based on the same appearance of damage.
Among both the engineering and meteorological communities, there was a clear understanding that either a new scale was necessary or significant changes and improvements to the Fujita Scale needed to be added.
Table 1. Damage descriptions of Fujita-Scale Categories (Fujita 1971)
F Scale Wind Speed, ms-1 Damage Description F0 18-32 Light Damage
Some damage to chimneys and TV antennas: breaks twigs off trees; pushes over shallow-rooted trees
F1 35-50 Moderate Damage Peels surface off roofs; windows broken; light trailer houses pushed or
overturned; some trees uprooted or snapped; moving automobiles pushed off the road
F2 51-70 Considerable Damage Roof torn off frame houses leaving strong upright walls; weak buildings in
rural areas demolished; trailer houses destroyed; large trees snapped or uprooted; railroad boxcars pushed over; light objects missiles generated; cars blown off highway
F3 71-92 Severe Damage
Roofs and some walls torn off frame houses; some rural buildings completely demolished; trains overturned; steel-framed hangar-warehouse type
structures torn; cars lifted off the ground; most trees in forest uprooted, snapped or leveled
F4 93-116 Devastating Damage Whole frame houses leveled, leaving piles of debris; steel structures badly
damaged; trees debarked by small flying debris; cars and trains thrown some distances or rolled considerable distances; large missiles generated
F5 117-142 Incredible Damage Whole frame houses tossed off foundations; steel-reinforced concrete
3
3 APPROACH
Researchers at the Wind Science and Engineering (WISE) Research Center at Texas Tech University, who had more that 30 years experience in documenting and studying tornado damage, volunteered to address the problem. It was agreed that whatever was to be done, it would be done openly with all persons and organizations with an interest being involved in the consensus process.
A steering committee co-chaired by McDonald and Mehta was organized with the purpose of setting goals, objectives and an initial plan of action. The Steering committee confirmed the need for action and proceeded to organize a forum to define the problems and establish a strategy for improvement of the Fujita Scale. Twenty-six persons, who had
experience or interest in the use and application of the Fujita Scale were invited to the forum. Twenty-three attended the one and one-half day meeting. The forum participants agreed that the Fujita Scale should be modified (enhanced) rather than to develop a completely new concept. The forum participants agreed to the following strategies:
• Identify additional damage indicators
• Correlate appearance of damage and wind speed
• Preserve use of the historical tornado data base
• Seek input and consensus from users
The Wind Science and Engineering Research Center at Texas Tech University agreed to expedite the action plan.
4 ENHANCED FUJITA SCALE CONCEPT
The plan that emerged was for the EF Scale to have the same format as the Fujita Scale. The categories are EF0 to EF5 but the wind speeds are different. However, the approach in developing the EF Scale is different. Fujita defined the categories and then attempted to describe the damage caused by the winds, while with the EF Scale, damage is first defined and the wind speeds to cause the damage are estimated. The EF Scale wind speed ranges are correlated with the original F-scale ranges in order to preserve use of the historical tornado data base. This concept is explained in more detail below.
4.1 Damage indicators and degrees of damage
4
A new feature was introduced that significantly improves the EF Scale. For each DI, several degrees of damage (DODs) are defined. The DODs represent progressive steps of damage to the DIs with increasing wind speed. The degrees of damage range from the initiation of visible damage to total destruction. This feature, as mentioned above, changes the paradigm in assigning the intensity of a tornado. The EF Scale assesses wind speed based on defined degrees of damage while the F Scale fits damage to predetermined wind speed ranges.
An expected value of wind speed is assigned to each individual DOD under a set of “normal” conditions. For buildings, “normal” implies no glaring weak links in the load path, traditional construction quality, use of appropriate building materials, compliance with local building codes and normal maintenance of the facility. Deviations from these normal
conditions are taken into account by establishing upper and lower bound wind speeds for each DOD. Conditions worse than the norm imply damage at a wind speed less than the expected value. Conditions better than the norm mean the actual wind speed to cause damage could be greater than the expected value.
4.2 Correlation of wind speed and damage
Direct measurements of near ground tornado wind speeds have been the goal of researchers for many years. Doppler radar is now capable of identifying tornado signatures. Wind speeds can be measured, but because of the radar declination angle, the measurements are at
relatively high elevations. Portable Doppler radar units mounted on trucks and
self-contained- instrument packages have been successfully placed in paths of hurricanes. To do the same thing with tornadoes is much more challenging. Analytical methods of calculating wind speeds to produce postulated damage are possible (Mehta et al, 1976) but require tedious calculations with numerous assumptions required regarding material strengths and behavior. In view of these measurement difficulties, a different approach was required.
4.3 Expert elicitation
An alternate approach has been successfully used to estimate seismic parameters than cannot be measured directly. The concept involves expert elicitation. In the case of tornado wind speeds, a group of experts makes their best estimate of the expected, upper and lower bound wind speed to cause the damage associated with each DOD. Since all the experts will not predict the same wind speed values, the mean and standard deviation of the expected, upper and lower bound wind speeds are calculated. The means of the expert’s estimates become the expected, upper and lower bound wind speeds for a particular DOD.
The Senior Seismic Hazard Analysis Committee (SSHAC, 1997) established the protocol for conducting the elicitation process. The experts make their best estimates of the expected, upper and lower bound wind speeds to cause the damage described in the DODs of each DI. The estimates are averaged and the results are discussed. Several rounds of
5
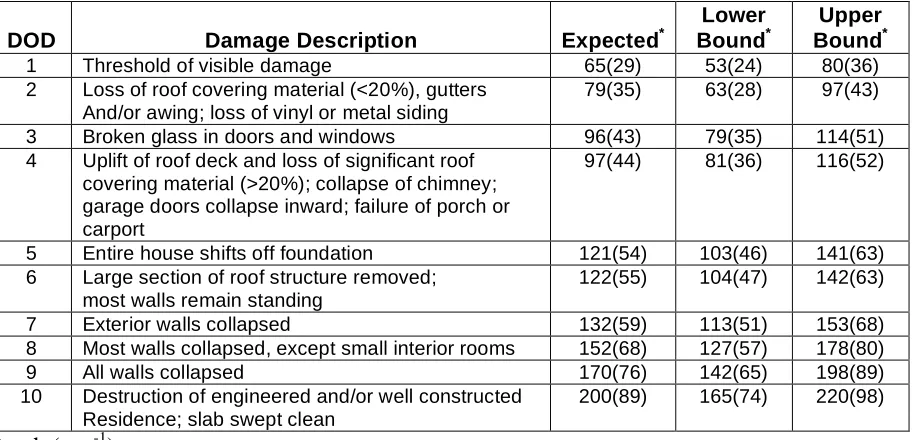
The DODs are arranged in ascending values of expected wind speeds to form a scenario of progressive damage to each DI. The results for a one-and two-family residence are presented here. As with each DI, a description of typical construction is included.
Typical Construction: One- and two-family residences
• Asphalt shingles, tile, slate or metal roof covering
• Flat, gable, hip, mansard or mono-sloped roof or combination thereof
• Plywood/OSB or wood plank roof deck
• Prefabricated wood trusses or wood joist and rafter construction
• Brick veneer, wood panels, stucco, EIFS, vinyl or metal siding
• Wood or metal stud walls, concrete blocks or insulating-concrete panels
• Attached single or double garage
Table 2 presents the expected, upper and lower bound wind speeds for each DOD. Wind speeds are three-second gusts at 10 m above ground in flat open terrain. Similar tabulations can be found in WISE (2006) for the 28 DIs that make up the current set. If one observes the worst damage as DOD4, the winds are stronger than the damage represented by DOD1 to DOD3. Conversely, the winds are less than those represented by DODs greater than DOD4. Similar information is available for the 27 other DIs. The details are documented in WISE (2006).
Table 2. Degrees of damage for one-and-two family residences with associated wind speeds
DOD Damage Description Expected*
Lower Bound*
Upper Bound*
1 Threshold of visible damage 65(29) 53(24) 80(36)
2 Loss of roof covering material (<20%), gutters And/or awing; loss of vinyl or metal siding
79(35) 63(28) 97(43)
3 Broken glass in doors and windows 96(43) 79(35) 114(51)
4 Uplift of roof deck and loss of significant roof covering material (>20%); collapse of chimney; garage doors collapse inward; failure of porch or carport
97(44) 81(36) 116(52)
5 Entire house shifts off foundation 121(54) 103(46) 141(63)
6 Large section of roof structure removed; most walls remain standing
122(55) 104(47) 142(63)
7 Exterior walls collapsed 132(59) 113(51) 153(68)
8 Most walls collapsed, except small interior rooms 152(68) 127(57) 178(80)
9 All walls collapsed 170(76) 142(65) 198(89)
10 Destruction of engineered and/or well constructed Residence; slab swept clean
200(89) 165(74) 220(98)
6
5 CORRELATION OF F SCALE AND EF SCALE
A historical tornado data base has been maintained in the United States going back to 1950. In recent years, the data base has been maintained by the National Climatic Data Center (NCDC) in Asheville, North Carolina. By referring to written descriptions of damage in official records, news media report and professional journals, F-Scale ratings were assigned to those tornadoes with sufficient data. Although the data was not perfect, it has been used to determine to tornado risks for both site specific locations and for regionalization.
Forum participants insisted that the historical data base be preserved. Thus, a
correlation between the F Scale and the EF Scale was required. To accomplish this, a second panel of experts consisting of NWS personnel, who had extensive tornado damage
investigation experience, was assembled. Their objective was to assign a Fujita Scale rating to each DOD. The ratings were averaged and then converted to an expected wind speed by Fujita’s F-Scale equation (Fujita,1971). The F-Scale wind speeds were converted from fastest one-quarter mile winds to three-second gust speeds to be compatible with the EF Scale wind speeds.
EF-scale wind speed versus F-scale wind speed for each DOD is plotted in Figure 1 (WISE, 2008). Linear regression analysis of the data gives a correlation equation with a correlation coefficient of 0.91. Using the regression equation, the wind speeds that define the F-scale ranges were converted to EF-scale ranges. The F Scale and the EF Scale wind speeds are compared in Table 3.
One mph = 0.447 m s-1
7
Comparing the wind speed ranges for the four highest categories, it is clear that the EF-scale ranges are lower than the F-scale ranges. This is consistent with the references cited above where Minor et al (1977) and Phan and Simiu (1998) suggested the wind speeds in the upper categories were too high.
Table 3. Correlation of F-scale and EF-scale wind speed ranges
Original Fujita Scale Enhanced Fujita Scale F Scale Wind Speed*
Range, mph
EF Scale Wind Speed* Range, mph
F0 45-78 EF0 65-85
F1 79-117 EF1 86-109
F2 118-161 EF2 110-137
F3 162-209 EF3 138-167
F4 210-261 EF4 168-199
F5 262-317 EF5 200-234
*3-second gust speed; one mph = 0.447 m s-1
5.1 Final Form of EF Scale
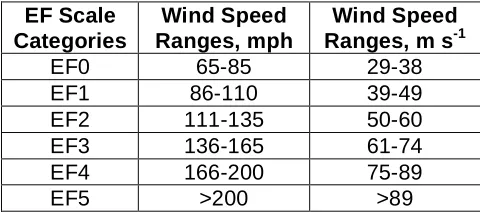
In order not to imply more accuracy than justified, the final EF-scale wind speed ranges have been rounded to the nearest 5 mph as shown in Table 4.
The primary application of the EF Scale is to rate the damage to individual building and to rate the intensity of a tornado event. The rating of an individual building in a damage path is first accomplished by identifying the DI that matches the building type and
construction. The observed damage is then matched to one of the DODs. The highest DOD is used to estimate the maximum winds. The final step is to determine if conditions suggest the wind speed is lower or higher than the expected value for the controlling DOD. The observer makes a judgment based on the deviation of conditions from the norm and
establishes the wind speed estimate for the observed damage. The assigned EF-scale rating of the damaged building is the one whose range of wind speeds contains the estimated value.
Table 4. Final EF-scale wind speed ranges
EF Scale Categories
Wind Speed Ranges, mph
Wind Speed Ranges, m s-1
EF0 65-85 29-38
EF1 86-110 39-49
EF2 111-135 50-60
EF3 136-165 61-74
EF4 166-200 75-89
EF5 >200 >89
8
Rating a tornado event follows the same general procedure except several different buildings or structures are considered in estimating wind speed to cause the most intense damage in the tornado path. NWS investigators usually conduct an aerial survey to identify potential DIs and to define the extent of the damage path. They identify two or more DIs that appear to indicate the highest wind speeds in the path. Their locations are pin-pointed in the path. The wind speeds to cause the observed damage are estimated following the procedures for individual buildings. The results are integrated to obtain an estimate of the maximum wind speed in the tornado path. The EF-scale rating for the storm is assigned to the category that contains the estimated maximum wind speed. Pertinent date for the tornado event are recorded and an oversight committee reviews the results of intense tornadoes (EF4 and EF5) before the EF-scale rating becomes official.
After a thorough review of the EF-scale proposal, the National Weather Service implemented use of the EF Scale in February 2007. Training materials were developed and NWS personnel obtained certification by completing the training courses. More details on the research and methodology used to develop the EF Scale can be found on the website of the Wind Science and Engineering Center (WISE 2006).
5.2 Implications
In March 2007, the U.S. Nuclear Regulatory Commission issued an updated version of the 1974 Regulatory Guide 1.76, Design-Basis Tornado and Tornado Missiles for Nuclear Power Plants. These regulatory guides provide licensees and applicants with guidance that the staff of the NRC considers acceptable for use in selecting the design-basis tornado and design-basis tornado-generated missiles. The design-basis tornado wind speeds presented in the new regulatory guide (2007) are based on Revision 2 of NUREG/CR4461 (Ramsdell 2007). The second revision relies on the EF Scale to relate the degree of damage from a tornado to the maximum wind speed. The design basis wind speeds for new reactors will still correspond to the exceedance frequency of 10-7 per year, which is the same as the original regulatory guide. Table 5 compares the design-basis tornado wind speeds in the original and new regulatory guides for the three geographic regions. The regions are not the same. In the original regulatory guide, region 1 extends from about longitude 107○ to the Atlantic coastline.
Region 1 in the new guide extends from longitude 102○ eastward but omits a large section
along the northeast coastline and parts of eastern Florida and Georgia. Wind speed values in the Table have not been adjusted for a consistent frame of reference. Fujita Scale wind speeds are fastest one-quarter mile winds and EF-scale wind speeds are three-second gust speeds.
Table 5. Comparison of wind speeds in old and new regulatory guides (1974 and 2007)
Maximum Wind Speed, mph(m s-1)
Region Regulatory Guide 1974 Regulatory Guide 2007
I 360(161) 230(103)
II 300(134) 200(89)
9
6 CONCLUSIONS
Continued use of the EF Scale by the NWS will lead to more consistent and more accurate estimates of tornado intensities. It corrects some of the deficiencies of the Fujita Scale, particularly the overestimation of wind speeds in the F3-F5 categories. More damage
indicators are available for making wind speed estimates, and there are provisions for adding additional ones as information becomes available. The correlation between the F Scale and EF Scale preserves the historical tornado records. As evidenced by the Ramdell study, the F- scale records can be converted to equivalent EF-scale records, allowing the prediction of tornado risks at site specific locations as well as regional studies. A steady improvement in the quality of the tornado records should be possible in the future.
ACKNOWLEDGEMENTS
Funding for this effort was provided through the Windstorm Mitigation Initiative, a
cooperative agreement between the National Institute of Standards and Technology and the Texas Tech University Wind Science and Engineering Research Center.
11 REFERENCES
Fujita, T.T. 1971. Proposed characterizations of tornadoes and hurricanes by area and intensity. SMRP 91, Department of Geophysical Sciences, University of Chicago, 42 pp. McDonald, J.R. and Mehta, K.C. 2001. Fujita Scale Forum Summary Report. Wind Science and Engineering, Texas Tech University, Lubbock, TX, 36 pp.
McDonald, J.R. 2002. Development of an enhanced Fujita scale for estimating tornado intensity. Preprints. 21st Conference on Severe Local Storms, AMS, San Antonio, TX, August 2002, pp 174-177.
Mehta, K.C., Minor, J.E. and McDonald, J.R. 1976. Wind speed analyses of April 3-4, 1974 tornadoes, Journal of the Structural Division, ASCE Vol. 201, No. ST9, Proc. Paper 12429, pp. 1709-1724.
Minor, J.E., McDonald, J.R. and Mehta, K.C. 1977. The tornado: An engineering oriented perspective. NOAA Technical Memorandum, ERL NSSL-82, National Severe Storms Laboratory, Norman, OK, p 103.
Phan, L.T. and Simiu, E. 1998. The Fujita tornado intensity scale: a critique based on
observations of the Jarrell tornado of May 27, 1997. NIST Tech Note 1426, U.S. Department of Commerce, Gaithersburg, MD 20 pp.
Ramsdell, J.V. 2007. Tornado climtology of the contiguous United States. NUREG/CR-4461 Revision 2. PNNL-15112, U.S. Nuclear Regulatory Commission, Washington, DC. 207pp. SSHAC. 1997. Recommendations for probabilistic seismic hazard analysis: guidelines on uncertainty and use of experts. NUREG/CR-6372, UCRL-ID-122160, Vol. 1, Lawrence Livermore National Laboratory, Livermore, CA 133 pp.
10
USNRC. 2007. Design-basis tornado and tornado missiles for nuclear power plants. Reg. Guide 1.76, Rev. 1, US Nuclear Regulatory Commission, Washington DC.
WISE. 2006. A recommendation for an Enhanced Fujita scale, Rev. 2. Wind Science and Engineering Research Center, October 2006; www.wind.ttu.edu/EFScale.pdf accessed May 30 2009.
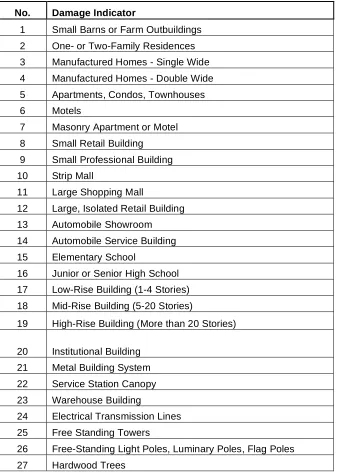
12 APPENDIX
Table A1. Damage Indicators for EF Scale
No. Damage Indicator
1 Small Barns or Farm Outbuildings
2 One- or Two-Family Residences
3 Manufactured Homes - Single Wide
4 Manufactured Homes - Double Wide
5 Apartments, Condos, Townhouses
6 Motels
7 Masonry Apartment or Motel
8 Small Retail Building
9 Small Professional Building
10 Strip Mall
11 Large Shopping Mall
12 Large, Isolated Retail Building
13 Automobile Showroom
14 Automobile Service Building
15 Elementary School
16 Junior or Senior High School
17 Low-Rise Building (1-4 Stories)
18 Mid-Rise Building (5-20 Stories)
19 High-Rise Building (More than 20 Stories)
20 Institutional Building
21 Metal Building System
22 Service Station Canopy
23 Warehouse Building
24 Electrical Transmission Lines
25 Free Standing Towers
26 Free-Standing Light Poles, Luminary Poles, Flag Poles
11