Article
1
Grating-coupled Surface Plasmon Resonance
2
(GC-SPR) Optimization for Phase-interrogation
3
Biosensing in a Microfluidic Circuit
4
Stefano Rossi1,2,3, Enrico Gazzola1, Pietro Capaldo4, Giulia Borile1,2,3,†,* and Filippo Romanato1,2,3,4,†
5
1Department of Physics and Astronomy “G. Galilei”, University of Padua, Via Marzolo 8, 35131, Padua, Italy
6
2 Laboratory for Nanofabrication of Nanodevices, Corso Stati Uniti 4, 35127, Padua, Italy
7
3 Fondazione Institute of Pediatric Research Città della Speranza, Corso Stati Uniti 4, 35127, Padua, Italy
8
4 CNR-INFM TASC IOM National Laboratory, Area Science Park S.S. 14 km 163.5, 34012, Trieste, Italy
9
† Contributed Equally
10
11
* Correspondence: [email protected]; Tel.: +39-049-821-8100
12
Abstract: Surface Plasmon Resonance (SPR) based sensors have the advantage of being label-free,
13
enzyme-free and real-time. However, their spreading in multidisciplinary research is still limited
14
and almost confined to prism-coupled devices. Plasmonic gratings, combined with a simple and
15
cost-effective instrumentation, have been poorly developed compared to prism-coupled system
16
mainly due to their lower sensitivity. Here we describe the optimization and signal enhancement of
17
a sensing platform based on phase-interrogation method, which entails the exploitation of a
18
nanostructured sensor. This technique is particularly suitable for integration of the plasmonic
19
sensor in a lab-on-a-chip platform and can be used in a microfluidic circuit to ease the sensing
20
procedures and limit the injected volume. The careful optimization of most suitable experimental
21
parameters by numerical simulations leads to a 30 to 50% enhancement of SPR response, opening
22
new possibilities for applications in the biomedical research field while maintaining the ease and
23
versatility of the configuration.
24
Keywords: Surface Plasmon Resonance; Biosensing; Nanofabrication; Lab-on-a-Chip; Microfluidic
25
26
1. Introduction
27
Biosensing, that is the detection of an analyte through the interaction between a biological
28
ligand and a physical transducer, is a primary scope of multidisciplinary scientific and technological
29
research [1–4]. With the advances in Photonics, a large variety of optical methods have been applied
30
to biosensing including spectroscopy, microscopy and plasmonic resonance. The development of
31
microscopic sensing platforms in combination with microfluidic technologies has opened the
32
possibility to integrate sensors and arrays in lab-on-a-chip devices [5–7].
33
A well-established approach to optical biosensing is the one based on surface plasmon
34
resonance (SPR), that is the resonant excitation of electromagnetic modes called Surface Plasmon
35
Polaritons (SPP), supported by metal-dielectric interfaces and consisting of electromagnetic waves
36
coupled to conduction electrons collective oscillations [8–11]. SPR-based sensors are widely
37
appreciated because they allow label-free real-time detection and they are a suitable approach to be
38
implemented in cost-effectively integrated devices [12–15].
39
The first approach to provide coupling between incident light and SPP for SPR biosensing is by
40
a prism; this is still the most widely used method in commercial SPR devices due to its high
41
sensitivity and ease of use [16–19]. However, the cumbersome and complicated optical system of
42
prism-based devices limits their versatility and integration capabilities in miniaturized arrays and
43
lab-on-a-chip platforms. The rival approach is the grating-based coupling (GC-SPR), in which the
44
resonance conditions are provided by diffraction of the incident light; this configuration is less
45
diffused for its lower sensitivity [20–22]. On the other hand, grating-based devices offer much higher
46
miniaturization and integration capabilities, resulting in a growing interest in this kind of sensors for
47
lab-on-a-chip applications [20, 23, 24].
48
It is thus essential to find strategies to enhance the sensitivity of these sensors. It was
49
demonstrated that a sensitivity enhancement can be achieved by working in “conical mounting”, a
50
configuration where the scattering plane is rotated of an azimuthal angle with respect to the grating
51
wavevector [25–28]. It was also observed that the symmetry breaking, due to the azimuthal rotation,
52
involves a fundamental role of the incident light polarization on SPP excitation [25, 29]. Therefore, in
53
addition to the usual angular and wavelength interrogation techniques, the unique role of
54
polarization in grating-coupled SPR devices can be exploited to perform a polarization scan. In this
55
configuration, the device reflectance is a function of the incident light polarization and variations of
56
the phase or amplitude of the resulting spectrum constitute the sensor response [30]. This method
57
allows a high resolution as well as a compact, simple and cost-effective detection setup, opening
58
remarkable possibilities for further integration in lab-on-a-chip devices, as already demonstrated
59
[31].
60
This microfluidic plasmonic chip is a starting point that requires SPR response enhancement
61
prior to biomedical applications. Here, we will investigate the grating coupler and working
62
conditions with the aim to optimize the SPR response in the case of polarization scan based
63
biosensing in aqueous environment.
64
2. Materials and Methods
65
2.1 Numerical Simulations
66
Numerical simulations were performed by Chandezon method (C-method), which is known as
67
one of the most efficient and stable algorithms developed to compute the optical response of
68
periodically patterned multilayer structures to an impinging monochromatic light beam [32, 33]. The
69
method has been extended and improved over the years and proved to be reliable in producing
70
realistic reflectance spectra in cases including conical mounting [34, 35], multilayer gratings of
71
arbitrary profile [36, 37] and also digital gratings [38]. The gratings were assumed to have a duty
72
cycle of 50% and the gold film was considered as bulk, since the transmitted component was found
73
to be negligible. The refraction index of the gold film was determined via Spectroscopic
74
Ellipsometry.
75
2.2 Grating and microfluidic system fabrication for GC-SPR
76
Grating fabrication was performed following a proven procedure already described by our
77
group, with minor adjustments [39]. In details, digital gold gratings were produced, with a period of
78
400nm and a duty cycle of 50%, on a 2.5x2.5 cm2 clean microscope slide by a Laser Interference
79
Lithography (LIL) process. The high-temperature cleaning procedure has been performed where a
80
sequential oxidative desorption and complexing with H2O2:NH4OH:H2O (1:1:3) has been
81
implemented. A 5 nm Ti adhesion layer was first deposited via electron beam evaporation, followed
82
by a 40nm Au film. A polymeric stencil, made of (Poly(methyl methacrylate), PMMA), with five
83
2x2mm2 areas was used during evaporation step to divide a single chip in different spots and to
84
allow the bonding of the Polydimethylsiloxane (PDMS) microfluidic system directly on glass. A
85
positive photoresist Microposit S1805 diluted into propylene glycol monomethyl ether acetate
86
(PGMEA, Microresist Technology) (2:3) was spun at 4000 rpm for 30 s on an adhesion promoter
87
(HDMS - Microchem) at 2000 rpm for 30 s. LIL in lab-made Lloyd’s configuration setup was used to
88
impress the grating’s grooves into the resist. The optimal dose for the required duty cycle was found
89
to be 65 mJ/cm2, corresponding to exposure times around 10min using a 325nm He:Cd laser
90
(Kimmon Koha Co.), spatially filtered with a 10μm diameter pinhole. The incidence angle was set to
91
obtain the desired period. The resist was developed in Microposit® MF 321 for 40s and then rinsed
92
for 60s in Milli-Q water. A second 40nm-thick gold was deposited onto the nanostructured pattern,
93
after an O2 plasma cleaning to remove any residual layer, aligning the stencils to the gold squares. A
94
allowed to obtain all-metal gratings. The gratings were then characterized by Scanning Electron
96
Microscopy (SEM) resulting in a period of 𝟑𝟗𝟔 ± 𝟒 𝒏𝒎 and a duty cycle of 𝟒𝟔 ± 𝟏 %.
97
Microfluidic chambers were realized in PDMS with soft lithography and covalently bonded on
98
the SPR chip with O2-plasma treatment and an Air-plasma pre-cleaning of the gold surface, as
99
previously described [39]. The master was pattern transferred in a silicon substrate using a negative
100
photoresist UV-lithographed mask via Bosh dry etching, obtaining a depth of 56μm. The silicon
101
master was then replicated to PDMS to obtain the desired positive master. The surface was then
102
silanized to avoid sticking of the PDMS during replica.
103
2.3 GC-SPR Detection Setup
104
For SPR generation and detection, we used a custom-made bench setup based on phase
105
interrogation, previously adopted for other applications [30, 31]. Briefly, an incident collimated laser
106
beam at 633 nm crosses a half-wave plate mounted on a motorized rotation system, before reaching
107
the grating. The sample is mounted on a rotation stage to select the azimuth, while both the camera
108
and laser were mounted in an articulated base to allow polar angle rotation. The reference azimuth
109
corresponds to the orientation that minimizes the intensity of reflected light, i.e. resonance. This
110
angle is selected rotating the grating until the minimization condition is reached and finely tuned
111
with polarization scan around the identified position for more precise selection of the orientation.
112
The reflected light is then collected by a CMOS camera, whose exposure time is regulated in
113
order to avoid signal saturation. Real-time measurements were performed monitoring averaged
114
reflected light intensity in a selected Region of Interest (ROI) of the sensing region as a function of
115
polarization angle. The ROI was selected in order to exclude margins were fabrication
116
misalignments could generate unwanted reflection. The entire system was controlled by a
117
custom-made software. Experiments were conducted acquiring at least 10 points around maximal
118
intensity sampling every 5°. For each angular position 30 frames were averaged (camera working at
119
30fps).
120
2.4 Sensing and Functionalization experiments.
121
The sensor performance was analyzed using a model sodium chloride (NaCl, SIGMA-Aldrich)
122
solution in Milli-Q water, as a previously adopted method to evaluate SPR response to bulk
123
refractive index variation [39]. The considered condition was 200mM NaCl similar to buffers used in
124
biosensing (e.g. PBS or HBSS).
125
A standard protein-protein interaction was used as a starting point for biosensing applications
126
[31]. A 2mM aqueous solution of Biotin-PEG2kDa-SH (NANOCS) was fluxed in the microfluidic
127
chamber and SPR signal was monitored in static (stop-flow) conditions at room temperature (22°).
128
Rapid and continuous acquisition of the SPR spectra was recorded for the first 2 hours of the
129
functionalization, then additional measurements were performed after at least 8-10 hours when the
130
functionalization resulted completed in our conditions. The presented experiments were performed
131
dissolving reagents in Milli-Q water (MilliPore) to ensure repeatability of the analysis. Avidin
132
(SIGMA-Aldrich) was dissolved in Milli-Q water at 4 µg/mL. Avidin biosensing was monitored for
133
at least 1 hour even though the steady state was observed after 20 minutes.
134
2.5 Data Acquisition and Analysis
135
The reflected light is acquired as a function of polarization angle and fitted by the harmonic
136
curve described below. The shift 𝚫𝜶𝟎is proportional to the refractive index change 𝚫𝒏 and hence
137
used as SPR response of our biosensing system. The sensitivity of the system is defined as the ratio
138
between the phase shift and the refraction index variation (𝑺 = 𝚫𝜶𝟎/𝚫𝒏 ). All reported data are
139
expressed as the mean obtained from different experimental replicas, with the corresponding
140
standard error of the mean (s.e.m.). Salts concentrations and SPR response were compared to
141
numerical simulations. The kinetics of binding is well approximated by the Hill function using the
142
Orthogonal Distance Regression with Origin®. Comparison between the experimental groups was
143
3. Results
145
3.1. Theory of phase-interrogation for GC-SPR in conical mounting
146
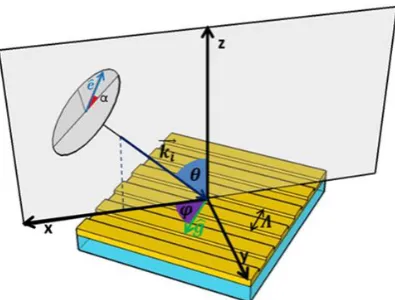
In conical mounting (fig. 1), the reflectance was found to exhibit a sinusoidal behaviour as a function
147
of light polarization [30] that can be fitted with the formula
148
𝑅 = 𝑓0− 𝑓1cos (2𝛼 + 𝛼0)
(1)
where α is the polarization, 𝛼0 the phase parameter and 𝑓0 and 𝑓1 control respectively the offset
149
and amplitude of the polarization spectrum. The reflectance is minimized for 𝛼𝑚𝑖𝑛= −𝛼0/2. The
150
phenomenon can be understood assuming that at resonance only the electric field component lying
151
on the grating’s symmetry plane is effective for SPP excitation [29], because the perpendicular
152
component is not diffracted and therefore no coupling is possible. That assumption brought to the
153
analytical determination of the polarization that minimizes the reflectance at resonance, which was
154
validated experimentally [25]. However, this model is valid only at resonance, because it assumes
155
that all the electric field component lying on the (G, n) plane is absorbed. When going out of
156
resonance due to a refractive index change, part of that field is reflected due to momentum mismatch
157
between the diffracted and plasmonic wavevectors.
158
Out of resonance, the global reflectance can be decomposed into the three reflected
159
components:
160
𝑅 = 𝜁|𝐸⊥|2+ 𝜇|𝐸∥| 2
+ 𝜉|𝐸𝑧|2 (2)
Where 𝐸⊥ is the component of the incident electric field that is perpendicular to the grating
161
wavevector and lays in the x,y plane of fig. 1; 𝐸∥ is the parallel component laying in the same plane,
162
while 𝐸𝑧 is the component perpendicular to the grating surface, laying in the z-axis of fig. 1. The
163
three coefficients (𝜁, 𝜇, 𝜉) give the fraction of the correspondent reflected incident field. Each
164
unreflected fraction go into plasmonic excitation and intrinsic losses in the metal. At resonance, the
165
reflectance is determined only by the non-coupled perpendicular component while a variation of the
166
refraction index determines the activation of the other two components. This causes a change of the
167
overall phase at the same azimuthal and polar angles. In general, all the three dampenings are
168
expected to have a refraction index dependence. The working principle of the phase-interrogation is
169
to monitor the fitted phase parameter change.
170
3.2 Simulation study for grating line depth contribution to SPR response in phase-interrogation
171
The line depth (indicated as A) of the grating is a parameter that controls the plasmonic efficiency
172
and has an effect on the global sensitivity. For prism couplers, the reflectance around resonance can
173
be approximated by a Lorentzian form [40, 41] solving the Fresnel equations for the dielectric-metal
174
interface and the expression has been proven valid also for grating [21]:
175
𝑅 = 1 − 4
𝛤
𝑖𝛤
𝑟 Δ𝑘𝑡2+ (𝛤
𝑖+ 𝛤
𝑟)
2
(3)
where 𝛥𝑘𝑡 is the momentum mismatch between the SPP and the diffracted light momentum, null at
176
resonance, while 𝛤𝑖 and 𝛤𝑟 are respectively the intrinsic and radiative loss. The first only depends
177
on the intrinsic dissipation of the metal, while the latter depends on the coupling efficiency of the
178
grating [42, 43]. The (3) is null when the radiative loss equals the intrinsic loss ( 𝛤𝑖= 𝛤𝑟),
179
corresponding to the optimal plasmonic coupling efficiency, when the energy stored in the SPP
180
mode is maximized. However, it was shown that the derivative of the reflectance over the refraction
181
index is maximized for 𝛤𝑟= 1/2𝛤𝑟 [41], therefore the maximum sensitivity is not expected at the
182
optimize the phase shift at given refaction index, whose dependence over R is not analytically
184
known. Thus, to study phase contribution in different condition, the use of numerical simulations is
185
fundamental.
186
The effect of the line depth was studied trough C-method simulations. The line depth affects the
187
radiative loss, determining a change in the plasmonic efficiency. As predicted by the Lorentzian
188
dependence (2), it controls the full width half maximum (FWHM) of the plasmonic dip, along with
189
the minimum reflectance at resonance. This can be seen in fig. 2a, where the azimuthal spectrum is
190
reported at a fixed polar angle for different grating line depths. It is apparent that also the resonant
191
azimuth has a slight dependence over the line depth. While the sensing measurements are carried
192
out changing the polarizarion, azimuthal spectra are still relevant, because they represents what it is
193
done experimentally to find the resonant azimuth for a given polar angle. For high line depth, hence
194
higher radiative losses, the azimuthal spectrum is broadened, causing low variations of the
195
reflectance around resonance. This makes harder and less precise to find the actual resonance
196
position, which is taken as a reference angle.
197
Because of the dependence of the resonant angles with the line depth, the phase shift was
198
simulated at a fixed polar angle (60°) but calculating the resonant azimuth for each value of A. The
199
refraction index shift was set at 0.002 from water. In that way, it can be seen how the sensitivity
200
varies slightly at resonance with the line depth of the grating (fig. 2b). Smaller depths than the
201
maximum plasmonic efficiency (𝐴 = 40𝑛𝑚) were found to increase the phase-shift. However, the
202
sensitivity enhancement comes with a reduction of the polarization spectrum amplitudes (fig. 2c). In
203
detail, the sensitivity enhancement at A=20nm is only 3.5% in respect to 40nm, while the amplitude
204
of the sinusoid in the polarizarion spectrum is reduced of 50% (fig. 2b,c). That is why we considered
205
a 40nm depth most suitable for biosensing experiments as a compromise between phase shift and
206
signal to noise ratio.
207
3.3. Polar angles optimization for sensitivity enhancement
208
Our SPR system performance depends on the fabrication parameters of the grating but also on
209
the working conditions of the sensing prototype. The effect of the choice of the polar angle on the
210
phase response was analyzed and tested experimentally. The simulations were performed by
211
C-method, considering a grating of 400nm period and 40nm line depth in water, with a wavelength
212
of 633nm, always calculating the resonant azimuth for the given polar angle. The polar angle is
213
relative to the air interface, so the real incidence angle is lowered according to Snell’s law.
214
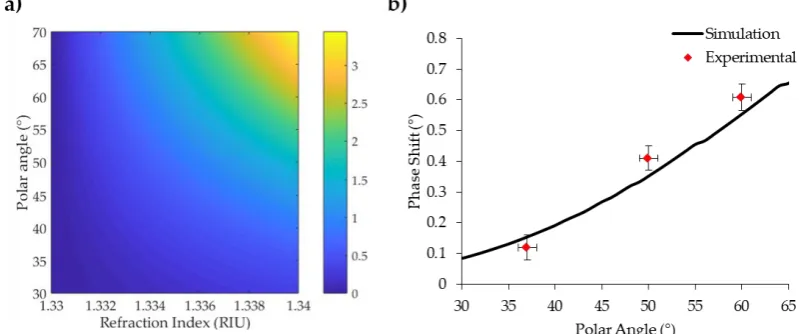
In fig. 3a the phase shift for different polar angles is reported as colour map varying the
215
refractive index. Moving towards grazing angles allows to obtain larger phase shifts, but technical
216
constraints of the detection prototype did not allow to explore angles over 60° from the normal.
217
Numerical predictions were tested experimentally measuring the SPR response to bulk
218
variations of refraction index from Milli-Q water to a 200mM solution of NaCl in Milli-Q water. This
219
is a standard procedure adopted to monitor SPR response, and we used a buffer similar to refraction
220
index shift to that expected in sensing application to biomedical research. We compared 3 different
221
polar angles (37°, 50° and 60°) and experimental results were overlapped to simulations. As shown
222
in figure 3b, experimental results are in good accordance with simulations. The modification of the
223
polar angle at 60° allowed us to obtain a system with an SPR response 30% larger than previous
224
reports [44].
225
3.4. Azimuthal angles optimization for sensitivity enhancement
226
After polar incidence optimization, we focused our attention on azimuthal rotation. Until now,
227
the azimuthal orientation was selected based on resonance angle. To this aim, we used numerical
228
simulations previously described to evaluate SPR response enhancement varying azimuthal
229
orientation around the resonance angle. The effect of the azimuth was studied by C-method
230
simulations at a fixed polar angle by varying the azimuth around resonance (fig.4a). The monitored
231
parameter is the fitted phase shift between 𝑛0=1.330 and 𝑛1=1.332. The results showed that the
232
larger SPR response is found before resonance. Thus, the resonance angle is not the best condition, in
233
reflected intensity also for prism-coupled devices the 𝜕𝑅 𝜕𝑛⁄ is not costant but has a maximum for a
235
specific refraction index variation [21], due to non linearity of R(n) function, which is also true for
236
gratings.
237
This observation was then confirmed experimentally by measuring SPR response to bulk
238
refraction index change given by 200mM NaCl from Milli-Q water, as done for polar angle
239
optimization. Few degrees rotation scan of the azimuth angle around resonance was performed and
240
overlapping simulation results with experimental data showed good agreement (fig.4b). Careful
241
azimuthal orientation around resonance is particularly relevant in an aqueous environment,
242
increasing up to 30% the phase response for this refraction index variation.
243
3.5. GC-SPR response enhancement: Biotin-PEG-thiol functionalization and biorecognition with Avidin
244
Since this GC-SPR sensitivity enhancement study was devoted to improving biorecognition
245
experimental results, the biotin-avidin reaction was used as a reference method to analyze SPR
246
performance in a biosensing scenario. A 2mM Biotin-PEG-thiol 2kDa solution was fluxed into the
247
microfluidic cell as described in the Methods section. Biotin functionalization was monitored and
248
compared in the “pre-optimization” and “post-optimization” conditions and traces and
249
corresponding fitting curves are shown in fig. 5a.
250
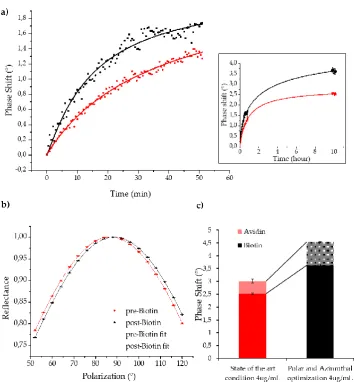
The functionalization kinetics was monitored to see the avidin-biotin binding. Larger responses
251
upon optimization were clearly visible even in the first hour of the experiment. Upon saturation
252
with biotin, we obtained a 40% increase in SPR response that was in line with the salt solution
253
calibration previously shown. For completeness, two representative polarization spectra are shown
254
in fig. 5b at the t=0 and t=10 hours of the Biotin functionalization protocol, from where the 𝛥𝛼0can be
255
extrapolated by fitting experimental data. Moreover, the phase shift caused by Avidin binding was
256
significantly larger, almost doubled, suggesting that lower concentrations (<4µg/mL) can be
257
detected in the optimized setup condition (fig. 5c).
258
4. Discussion
259
In this study, we took advantage of numerical methods to enhance the performance of a
260
custom-made on-bench system based on phase-interrogation for SPR sensing. From numerical
261
simulations, it was possible to optimize different parameters regarding both the grating fabrication
262
procedure and the sensing prototype. However, translation from numerical simulations to
263
experiments imposes some practical constraints: all parameters should be carefully selected to
264
ensure response enhancement without compromising signal-to-noise ratio or introducing beam
265
distortions. In GC-SPR, correspondence between grating parameters and incident laser wavelength
266
is crucial. The line depth of the grating is a parameter that influences the plasmonic efficiency and
267
sensitivity, but the two cannot be optimized simultaneously [41]. In the range of line depths
268
considered, the sensitivity does not change dramatically, making the method robust and tolerant to
269
mild variations on the fabrication procedure. The 40 nm depth, although predicted not to have the
270
best sensitivity, ensures an easier identification of the resonant azimuthal angle as well as
271
maximizing the signal-to-noise ratio of reflectance in polarization scan.
272
The major technical constraint imposed by mechanical parts of the set-up concerned polar
273
incidence. Although numerical simulations predict that higher angles than 60° would ensure a
274
further increase in sensitivity, a further grazing incidence was tested but, in addition to mechanical
275
limitations, it induced an enlargement of the laser spot, introducing unwanted aberrations,
276
compromising SPR detection. Eventually, the proper azimuthal orientation of the grating led us to
277
an increase from 30% to 50% in sensitivity. The optimal azimuthal orientation is not constant for all
278
refraction index variations since the response is not linear. Thus, upon resonance identification, the
279
most efficient orientation can be predicted by numerical simulations and adjusted prior to the
280
experiment.
281
The need for a more sensitive system, while maintaining the simplicity and cost-effectiveness of
282
the apparatus, is crucial for applications to clinically relevant biochemical interaction studies. The
283
phenomena more complex than avidin-biotin recognition. Among others, the system is currently
285
challenged for leukaemia cell counting and label-free leukaemia cell-drug interaction analysis [45],
286
this latter being a field of application poorly explored with GC-SPR. This application can open new
287
possibilities toward personalized medicine in all those clinical conditions where the number of
288
available cells from patients is scarce and a rapid, real-time monitoring is desirable, as pediatric
289
leukaemia. Moreover, a major advantage of gratings lays on the versatility and miniaturization
290
capabilities of the configurations that can be fabricated. Among others, the plasmonic chip can be
291
integrated into a system with surface acoustic waves (SAWs) to promote analyte mixing and binding
292
[31]. Furthermore, a chip with multiple sensing areas can be exploited for multiplexed analysis
293
without expensive microspotter systems to evaluate different analytes simultaneously [46].
294
5. Conclusion
295
The up-to-date limitation in the exploitation of GC-SPR systems is mainly attributable to lower
296
sensitivity of these apparatus, compared to prism-coupled systems. On the other hand, the use of
297
gratings enables extreme miniaturization and integration of the sensing areas within lab-on-a-chip
298
systems. Here, we investigated a GC-SPR detection setup based on phase interrogation with the
299
biosensing area integrated in a microfluidic chamber, which has been successfully optimized to
300
enhance global response to bulk refraction index variations and protein adhesion and recognition.
301
The most suitable working parameters to increase the SPR response were studied with a simulative
302
approach and then tested experimentally. This brought to an observed increase between 30 to 50% of
303
the global response, which makes the sensing performances of gratings couplers more competitive
304
and appealing for use. Further optimization may be obtained acting, for example, on the sensing
305
instrumentation with the use of a more accurate servomotor.
306
The SPR response enhancement in aqueous medium reported in this work is capable to
307
promote the integration of GC-SPR devices towards novel applications in biosensing in more
308
complex lab-on-a-chip platforms.
309
6. Figures and Legends
310
311
Figure 1. Conical mounting scheme
312
Schematic representation of the grating-coupled SPR system based on phase interrogation. The x
313
and z axes lay on the scattering plane. The grating wavevector versor 𝒈̂ forms an angle 𝝋 with the
314
x-axis, defined as azimuth, while the incident light wavevector 𝒌⃗⃗⃗ 𝒊 is incident at an angle 𝜽 from the
315
normal to the grating surface, defined as the polar angle. The polarization 𝜶 is defined as the angle
316
formed by the electric field versor 𝒆̂ from the scattering plane. 𝚲 indicates the period of the grating.
317
319
Figure 2. Grating line depth numerical analysis.
320
a) Azimuthal spectrum for 400 nm gratings at 633 nm wavelength at 60° incidence, for different
321
grating line depths: A=20nm, A=40nm and A=80nm (see figure colour legend). b) Phase shift
322
dependence on grating line depth at 60° polar angle, 633nm wavelength at the corresponding
323
resonance azimuth, for a refraction index of 0.002 from pure water. C) Simulated polarization
324
spectra in water for different grating line depth at resonance. The minimum reflectance is achieved
325
with gratings of 40nm depth.
326
Figure 3. Numerical simulations and experimental results of Polar contribution to phase shift
328
enhancement.
329
a) Phase shift colour-map of gold gratings with a 400nm period in water, varying the polar angle in
330
resonance condition. Incident wavelength 633nm. b) Experimental phase shift enhancement with
331
polar incidence angle. Red dots represent experimental data, the black line is the simulated value for
332
the corresponding refraction index shift extrapolated from the colour-map. S.e.m of the points are
333
shown
334
335
336
Figure 4. Numerical simulations and experimental results of Azimuthal contribution to phase
337
shift enhancement.
338
a) Simulated phase-variation colour map of a grating with a period of 400nm and 633nm incident
339
wavelength. The polar angle was fixed at 60°, while the azimuth was varied around resonance. The
340
phase variation was simulated for a set of refractive indexes starting from the water. The dotted red
341
line represents the resonant azimuth for water. b) Experimental phase shift for a 200 mM NaCl
342
solution from water (considered as reference), overlapped to the simulated longitudinal section
343
profile from the colour-map for different azimuths around resonance, at 60° polar angle. The dotted
344
346
Figure 5. GC-SPR biosensing enhancement upon Polar and Azimuthal angles optimization.
347
Biotin-SH functionalization shows higher phase shift for optimized polar incidence in the first hour
348
of the experiment (a) and after several hours when the functionalization is almost complete (inset).
349
Data were fitted with Hill curves obtaining values of the reduced R² > 0.999. b) Representative curves
350
of the polar spectrum at t=0 and t= 10 hours of Biotin functionalization. Avidin biorecognition over
351
biotin is reported in c), where different conditions are compared. Data are reported with s.e.m.
352
353
Acknowledgments: Authors S.R. and G.B. are supported by University of Padua, Department
354
of Physics and Astronomy “G. Galilei”. The authors are grateful to Dr. Gianluca Ruffato for
355
developing a preliminary version of the Chandezon Matlab code used in this work, Dr. Michele
356
Massari for technical help, and Fabio Suran for coding the acquisition software.
357
358
Author Contributions: S.R., G.B. and F.R. conceived the experiments and interpreted data; S.R.
359
and E.G. performed the numerical simulations; S.R. and G.B. performed the experiments and
360
analyzed data; P.C. and S.R. fabricated and characterized the gratings; S.R., G.B. and E.G. wrote the
361
Conflicts of Interest: The authors declare no conflict of interest. The founding sponsors had no role in the
363
design of the study; in the collection, analyses, or interpretation of data; in the writing of the manuscript, and in
364
the decision to publish the results.
365
References
366
1. Homola J (2008) Surface plasmon resonance sensors for detection of chemical and biological species.
367
Chem Rev 108:462–93 . doi: 10.1021/cr068107d
368
2. Elosua C, Matias IR, Bariain C, Arregui FJ (2006) Volatile organic compound optical fiber sensors: A
369
review. Sensors 6:1440–1465 . doi: 10.3390/s6111440
370
3. Zeng S, Yong K-T, Roy I, et al (2011) A Review on Functionalized Gold Nanoparticles for Biosensing
371
Applications. Plasmonics 6:491–506 . doi: 10.1007/s11468-011-9228-1
372
4. Holzinger M, Le Goff A, Cosnier S (2014) Nanomaterials for biosensing applications: a review. Front
373
Chem 2: . doi: 10.3389/fchem.2014.00063
374
5. Ligler FS (2009) Perspective on optical biosensors and integrated sensor systems. Anal Chem 81:519–526
375
. doi: 10.1021/ac8016289
376
6. Sackmann EK, Fulton AL, Beebe DJ (2014) The present and future role of microfluidics in biomedical
377
research. Nature 507:181–189
378
7. Chen P, Chung MT, McHugh W, et al (2015) Multiplex serum cytokine immunoassay using
379
nanoplasmonic biosensor microarrays. ACS Nano 9:4173–4181 . doi: 10.1021/acsnano.5b00396
380
8. Homola J, Yee SS, Gauglitz G (1999) Surface plasmon resonance sensors: review. Sensors Actuators B
381
Chem 54:3–15 . doi: 10.1016/S0925-4005(98)00321-9
382
9. Shankaran DR, Gobi KV, Miura N (2007) Recent advancements in surface plasmon resonance
383
immunosensors for detection of small molecules of biomedical, food and environmental interest.
384
Sensors Actuators, B Chem 121:158–177 . doi: 10.1016/j.snb.2006.09.014
385
10. Habauzit D, Chopineau J, Roig B (2007) SPR-based biosensors: A tool for biodetection of hormonal
386
compounds. In: Analytical and Bioanalytical Chemistry. pp 1215–1223
387
11. Abdulhalim I, Zourob M, Lakhtakia A (2008) Surface plasmon resonance for biosensing: A mini-review.
388
Electromagnetics 28:214–242 . doi: 10.1080/02726340801921650
389
12. Hoa XD, Kirk AG, Tabrizian M (2007) Towards integrated and sensitive surface plasmon resonance
390
biosensors: A review of recent progress. Biosens. Bioelectron. 23:151–160
391
13. Ouellet E, Lausted C, Lin T, et al (2010) Parallel microfluidic surface plasmon resonance imaging arrays.
392
Lab Chip 10:581 . doi: 10.1039/b920589f
393
14. Wang X, Zhan S, Huang Z, Hong X (2013) REVIEW: ADVANCES AND APPLICATIONS OF SURFACE
394
PLASMON RESONANCE BIOSENSING INSTRUMENTATION. Instrum Sci Technol 41:574–607 . doi:
395
10.1080/10739149.2013.807822
396
15. Ferhan AR, Jackman JA, Park JH, et al (2018) Nanoplasmonic sensors for detecting circulating cancer
397
biomarkers. Adv. Drug Deliv. Rev.
398
16. Matsubara K, Kawata S, Minami S (1988) Optical chemical sensor based on surface plasmon
399
measurement. Appl Opt 27:1160 . doi: 10.1364/AO.27.001160
400
17. Lofas S, Malmqvist M, Ronnberg I, et al (1991) Bioanalysis with surface plasmon resonance. Sensors
401
Actuators B 5:79–84 . doi: 10.1016/0925-4005(91)80224-8
402
18. Homola J (1997) On the sensitivity of surface plasmon resonance sensors with spectral interrogation.
403
Sensors Actuators B Chem 41:207–211 . doi: 10.1016/S0925-4005(97)80297-3
404
plasmon resonance modes. In: Biosensors and Bioelectronics. pp 633–642
406
20. Dostálek J, Homola J, Miler M (2005) Rich information format surface plasmon resonance biosensor
407
based on array of diffraction gratings. In: Sensors and Actuators, B: Chemical. pp 154–161
408
21. Piliarik M, Homola J (2009) Surface plasmon resonance (SPR) sensors: approaching their limits? Opt
409
Express 17:16505 . doi: 10.1364/OE.17.016505
410
22. Shalabney A, Abdulhalim I (2011) Sensitivity-enhancement methods for surface plasmon sensors. Laser
411
Photonics Rev. 5:571–606
412
23. Piliarik M, Vala M, Tichý I, Homola J (2009) Compact and low-cost biosensor based on novel approach
413
to spectroscopy of surface plasmons. Biosens Bioelectron 24:3430–5 . doi: 10.1016/j.bios.2008.11.003
414
24. Yoon KH, Shuler ML, Kim SJ (2006) Design optimization of nano-grating surface plasmon resonance
415
sensors. Opt Express 14:4842–4849 . doi: 10.1364/OE.14.004842
416
25. Romanato F, Lee KH, Ruffato G, Wong CC (2010) The role of polarization on surface plasmon polariton
417
excitation on metallic gratings in the conical mounting. Appl Phys Lett 96: . doi: 10.1063/1.3361653
418
26. Sonato A, Ruffato G, Zacco G, et al (2013) Enhanced sensitivity azimuthally controlled grating-coupled
419
surface plasmon resonance applied to the calibration of thiol-poly(ethylene oxide) grafting. Sensors
420
Actuators, B Chem 181:559–566 . doi: 10.1016/j.snb.2013.02.022
421
27. Brigo L, Gazzola E, Cittadini M, et al (2013) Short and long range surface plasmon polariton
422
waveguides for xylene sensing. Nanotechnology 24: . doi: 10.1088/0957-4484/24/15/155502
423
28. Perino M, Pasqualotto E, Scaramuzza M, et al (2015) Enhancement and control of surface plasmon
424
resonance sensitivity using grating in conical mounting configuration. Opt Lett 40:221–224 . doi:
425
10.1364/OL.40.000221
426
29. Ruffato G, Romanato F (2012) Grating-coupled surface plasmon resonance in conical mounting with
427
polarization modulation. Opt Lett 37:2718–20 . doi: 10.1364/OL.37.002718
428
30. Ruffato G, Pasqualotto E, Sonato a., et al (2013) Implementation and testing of a compact and
429
high-resolution sensing device based on grating-coupled surface plasmon resonance with polarization
430
modulation. Sensors Actuators, B Chem 185:179–187 . doi: 10.1016/j.snb.2013.04.113
431
31. Sonato a., Agostini M, Ruffato G, et al (2016) A surface acoustic wave (SAW)-enhanced
432
grating-coupling phase-interrogation surface plasmon resonance (SPR) microfluidic biosensor. Lab
433
Chip 16:1224–1233 . doi: 10.1039/C6LC00057F
434
32. Li L (1996) Multilayer-coated diffraction gratings: differential method of Chandezon et al. revisited:
435
errata. J Opt Soc Am A 13:543 . doi: 10.1364/JOSAA.13.000543
436
33. Li L (2007) Using symmetries of grating groove profiles to reduce computation cost of the C method. J
437
Opt Soc Am A 24:1085–1096 . doi: 10.1364/JOSAA.24.001085
438
34. Elston SJ, Bryan-Brown GP, Sambles JR (1991) Polarization conversion from diffraction gratings. Phys
439
Rev B 44:6393–6400 . doi: 10.1103/PhysRevB.44.6393
440
35. Ruffato G, Romanato F (2013) Near-field numerical analysis of surface plasmon polariton propagation
441
on metallic gratings. COMPEL Int J Comput Math Electr Electron Eng 32: . doi:
442
10.1108/COMPEL-10-2012-0269
443
36. Li L, Granet G, Plumey JP, Chandezon J (1996) Some topics in extending the C method to multilayer
444
gratings of different profiles. Pure Appl Opt (Print Ed (United Kingdom) 5:141–156 . doi:
445
10.1088/0963-9659/5/2/002
446
37. Preist TW, Cotter NPK, Sambles JR (1995) Periodic multilayer gratings of arbitrary shape. J Opt Soc Am
447
38. Pascal B, Ce L, Plumey JP, et al (1997) Coordinate transformation method as applied to asymmetric
449
gratings with vertical facets. J Opt Soc Am A 14:610 . doi: 10.1364/JOSAA.14.000610
450
39. Gazzola E, Pozzato a., Ruffato G, et al (2016) High-throughput fabrication and calibration of compact
451
high-sensitivity plasmonic lab-on-chip for biosensing. Optofluidics, Microfluid Nanofluidics 3:13–21 .
452
doi: 10.1515/optof-2016-0002
453
40. Neviere M, Vincent P, Petit R, Cadilhac M (1973) Systematic study of resonances of holographic thin
454
film couplers. Opt Commun 9:48–53 . doi: 10.1016/0030-4018(73)90333-7
455
41. Yeatman EM (1996) Resolution and sensitivity in surface plasmon microscopy and sensing. In:
456
Biosensors and Bioelectronics. pp 635–649
457
42. Herminghaus S, Klopfleisch M, Schmidt HJ (1994) Attenuated total reflectance as a quantum
458
interference phenomenon. Opt Lett 19:293–295 . doi: 10.1364/OL.19.000293
459
43. Gallinet B, Siegfried T, Sigg H, et al (2013) Plasmonic radiance: Probing structure at the Ångström scale
460
with visible light. Nano Lett 13:497–503 . doi: 10.1021/nl303896d
461
44. Gazzola E, Pozzato A, Ruffato G, et al (2016) High-throughput fabrication and calibration of compact
462
high-sensitivity plasmonic lab-on-chip for biosensing. Optofluidics, Microfluid Nanofluidics 3: . doi:
463
10.1515/optof-2016-0002
464
45. Borile G, Rossi S, Filippi A, et al (2018) Label-free, real-time on-chip sensing of living leukemia cells via
465
grating-coupled surface plasmon resonance
466
46. Agnese S, Alessandro P, Fabio S, et al (2016) Multiplexing nanostructured plasmonic device for high
467
throughput biosensing. 500 . doi: 10.1039/C6LC00057F