R E S E A R C H
Open Access
Hepatitis B virus induces G1 phase arrest by
regulating cell cycle genes in HepG2.2.15 cells
Tianzhen Wang
1†, Ran Zhao
1†, Yiqi Wu
1, Dan Kong
2, Lei Zhang
1, Di Wu
3, Chao Li
1, Chong Zhang
1, Zuxi Yu
4and
Xiaoming Jin
1*Abstract
Background:To investigate the effect of HBV on the proliferative ability of host cells and explore the potential mechanism.
Methods:MTT, colony formation assay and tumourigenicity in nude mice were performed to investigate the effect of HBV on the proliferative capability of host cells. In order to explore the potential mechanism, cell cycle and apoptosis were analysed. The cell cycle genes controlling the G1/S phase transition were detected by
immunohistochemistry, westernblot and RT-PCR.
Results:HepG2.2.15 cells showed decreased proliferation ability compared to HepG2 cells. G1 phase arrest was the main cause but was not associated with apoptosis. p53, p21 and total retinoblastoma (Rb) were determined to be up-regulated, whereas cyclinE was down-regulated at both the protein and mRNA levels in HepG2.2.15 cells. The phosphorylated Rb in HepG2.2.15 cells was decreased.
Conclusions:Our results suggested that HBV inhibited the capability of proliferation of HepG2.2.15 cells by regulating cell cycle genes expression and inducing G1 arrest.
Keywords:HepG2.2.15 HepG2, HBV, proliferation, cell cycle
Background
Epidemiological and virological investigations have shown that hepatitis B virus (HBV) infection is the main cause of hepatocellular carcinoma (HCC) and is present in approximately 80% of HCC patients [1-4]. Although considerable studies have been done, the precise mechanism remains unclear.
By now, HBV genome integration, gene mutation, gene deletion and diverse viral factors have been proved to be implicated in HBV-related HCC [5-8]. However, little is known about the impacts of the complete HBV genome or HBV replication on host cells.
The HepG2.2.15 cell line was established by transfect-ing the HBV genome into HepG2 cells [9]. It supports stable HBV replication and protein expression, as well as the production of virus particles. HepG2.2.15 is a
widely used cell line in the study of the life cycle of HBV and antiviral research [10-12]. It is also an ideal model for investigating host-virus interaction [13,14]. Our previous study has found that HepG2.2.15 cell line demonstrated distinct biological features compared with parental HepG2. The comparative analysis between HepG2.2.15 and HepG2 can help us to understand host-virus interaction.
This study focused on the cell cycle control and further investigated how HBV influenced the ability of proliferation in HepG2.2.15 cells.
Materials and methods Cell culture
The HepG2.2.15 cell line is a HepG2 cell line trans-fected with a plasmid containing two head-to-tail dimers of the HBV genome (GenBank accession: U95551.1). Cells were cultured in Dulbecco’s modified Eagle med-ium (DMEM, Hyclone, Logan, UT, USA) supplemented with 10% FBS (Invitrogen, Carlsbad, CA, USA), 100 μg ml-1streptomycin and 100 IU ml-1penicillin at 37°C in
* Correspondence: [email protected]
†Contributed equally
1
Department of Pathology, Basic Medical Science College, Harbin Medical University, 157 Baojian Road, Nangang District, Harbin 150081, China Full list of author information is available at the end of the article
a 5% CO2incubator. 380 μg ml-1 G418 (Invitrogen) was
needed in HepG2.2.15 cells.
Identification of HBV replication in HepG2.2.15 cells After 48 hours of seeding, the culture medium of HepG2.2.15 cells was collected and assayed for extracel-lular HBV DNA quantity by fluorescence quantitative polymerase chain reaction (Q-PCR, PG BIOTECH, Shenzhen, China). Hepatitis B surface antigen (HBsAg) and Hepatitis B e antigen (HBeAg) in culture medium were measured by ELISA (3V, Weifang, China) accord-ing to the manufacturer’s instructions.
Electron microscopy
HepG2.2.15 and HepG2 cells were collected and washed twice with PBS. After centrifugation, the cell pellet was fixed with 2.5% glutaraldehyde for 12 h, post-fixed with 1% osmium tetroxide for 1 h, dehydrated in a graded series of acetone and embedded in Epon 812. Sections of 70-80 nm were cut, stained with uranyl acetate and lead citrate, and viewed on a JEM 1220 transmission electron microscope (JEOL, Tokyo, Japan).
MTT assay
Cells were seeded in 96-well plates at a density of 4 × 10³ cells per well and incubated in 200μl DMEM with serum for 1 to 5 days. MTT (5 mg ml-1) was added to each well. After incubation at 37°C for 4 h, the superna-tant containing MTT was removed and DMSO was added to wells to suspend MTT-formazan crystals, and viable cells were detected by measuring absorbance at 490 nm.
Colony formation assay
The cells were plated in 6-well plates at a density of 100 cells per well and cultured in regular culture medium. After 2 weeks, cells were washed with PBS, fixed in 10% methanol for 15 min, and stained with Giemsa. Colonies which consisted of >50 cells were scored. The colony formation rate was calculated as a percentage of total seeded cells.
Tumourigenicity testing in vivo
In vivo experiments used 16 four-week-old female nude mice (BALB/cASlac-nu) obtained from Shanghai Laboratory Animal Center of Chinese Academy Sciences. Mice were randomly divided into HepG2.2.15 and HepG2 group. 1 × 10⁷ tumour cells in 0.3 ml PBS were subcutaneously injected into the flank region of nude mice. All nude mice were sacrificed on day 28. Animal care and experimental procedures were approved by the Committee for Ethics in Animal Experimentation of Harbin Medical University, and were conducted in accordance with the Guidelines for
Animal Experiments of the National Cancer Center of China.
Cell cycle analysis
Cell cycle profiles were analysed using FACS. Briefly, 1 × 10⁶ cells were trypsinized, rinsed twice with PBS and fixed with 70% cold ethanol at 4°C overnight. Fixed cells were washed with PBS and stained with 200μl of propi-dium iodide (PI) for 30 min without light. The cell cycle was analysed by a flow cytometry (BD, San Jose, CA, USA).
Apoptosis assay by TUNEL
Apoptotic cells were detected by the terminal deoxynu-cleotidyl transferase (TDT)- mediated deoxyuridine tri-phosphate nick-end labelling (TUNEL) technique. The cells seeded on coverslips were fixed by formaldehyde at room temperature for 30 min and permeabilised with 0.1% Triton X-100 for 5 min. Apoptotic cells were labelled using anin situapoptosis detection kit (Roche, Penzberg, Germany) and observed by fluorescence microscopy.
Western blot analysis
The total protein extracted from cells were separated by 12% SDS-PAGE and transferred onto PVDF membranes. The membranes were blocked by 5% dried non-fat milk overnight, incubated with anti-p27 (Boster, Wuhan, China), p16, p53, cyclinD1 and cyclinE (Santa Cruz, CA, USA), GAPDH and anti-p21 (Calbiochem, Gibbstown, NJ, USA), anti-Rb and anti-pRb (ser795) (SAB, Pearland, TX, USA) antibodies in 1:500 dilution for 2 h at 37°C, washed and further incubated with alkaline phosphatase (AP)-conjugated secondary antibodies (Santa Cruz) for 1 h at room tem-perature. Immunoreactive bands were detected using western blue (Promega, Madison, WI, USA). GAPDH was used as internal control.
Immunohistochemical staining
HepG2.2.15 and HepG2 cells were collected and centri-fuged. The pellet of tumour cells were embedded in par-affin and sections of 5 um were cut. The sections were deparaffinised, blocked and incubated with anti-p53, anti-p21, anti-p27, anti-p16, anti-cyclinD1, anti- cyclinE, anti-Rb and anti-pRb (ser795) antibodies in 1:50 dilution at 4°C overnight. Immunohistological staining was visua-lized using the streptavidin-peroxidase kit (ZSGB Bio, Beijing, China).
RT-PCR analysis
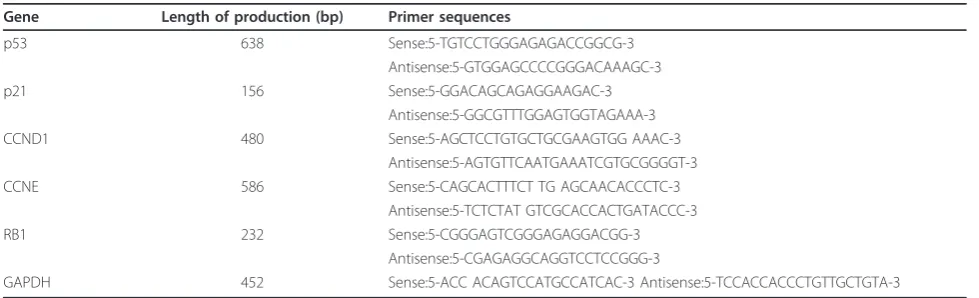
reverse transcriptase (TaKaRa, Tokyo, Japan). PCR reac-tions were performed using the primer pairs listed in Table 1, and the GAPDH gene was used as an internal control. Amplification products were resolved by 1.5% agarose gel electrophoresis.
Statistical analysis
All data were presented as mean ± SD. The two groups were compared with Student’sttest and Fisher’s exact. AP< 0.05 was considered statistically significant.
Results
Identification of HBV replication in HepG2.2.15 cells Q-PCR results showed that the average amount of HBV DNA released from HepG2.2.15 cells at 48 h was (2.49 ± 0.36) ×106 copies ml-1. HBsAg and HBeAg were strongly positive by ELISA. Taken together, these results confirmed HBV expression in HepG2.2.15 cells.
Morphological features of HepG2.2.15 cells
HepG2.2.15 cells grew in multiple adherent layers in in vitroculture (Figure 1A) and adhered to the wall of the culture vessel within 24 h and by passage 1 to 2 on days 4-5. HepG2 cells grew in an adherent monolayer with polygonal morphology (Figure 1A) and grew faster than HepG2.2.15 cells where they adhered to the wall of the culture vessel after 2 h and by passage 1 to 2 after 2 days.
Ultrastructural analysis of cells revealed that, com-pared to HepG2 cell, the HepG2.2.15 cell body was rela-tively larger, karyoplasmic ratio was decreased, cellular surface projections became shortened or disappeared, cellular organelles were porous and mitochondria were enlarged (Figure 1Bi). Virus inclusions containing virus particles were visible in the cytoplasm of HepG2.2.15 cells (ii). The body of HepG2 cells was relatively smaller. Compact cytoplasm, cellular organs and many surface projections were observed in HepG2 cells (iii).
Lower proliferation ability of HepG2.2.15 cells in vitro and in vivo
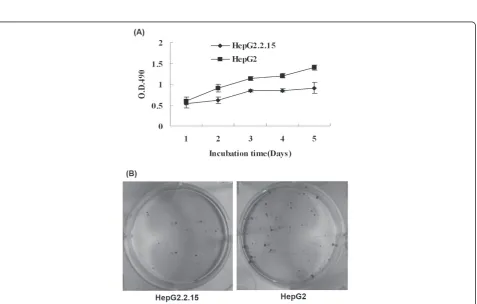
The MTT assay proved that the growth rate of HepG2.2.15 cells was significantly slower than that in HepG2 cells on days 2-5 after seeding (P< 0.05) (Figure 2A). The colony formation rate was significantly lower in HepG2.2.15 cells than in HepG2 cells (P< 0.01) (Fig-ure 2B).
HepG2.2.15 cells formed tumours in 2 of 8 mice, whereas HepG2 cells formed tumours in all eight mice. The tumours caused by HepG2.2.15 cells could be observed after 22 days, whereas the tumours from HepG2 cells could be observed after 2 days. The tumour formation rate of HepG2.2.15 cells was lower compared with HepG2 cells (P< 0.05).
HBV induces cell cycle arrest in HepG2.2.15 cells
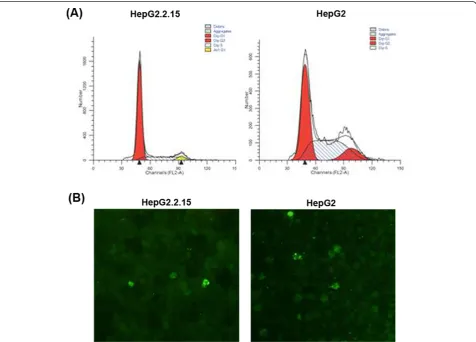
The percentage of cells in each phase of the cell cycle was determined for HepG2.2.15 and HepG2 cells grown in vitro(Table 2). The proportion of cells in G1 phase increased, whereas cells in S phase decreased in HepG2.2.15 compared to HepG2 cells (Figure 3A). HepG2.2.15 cell cycle was arrested at the G1 phase. Apoptosis was determined by TUNEL assay (Figure 3B). The apoptotic rates were low and there was no signifi-cant difference observed for HepG2.2.15 and HepG2 cell line.
HBV regulates the expression of cell cycle genes in HepG2.2.15 cells
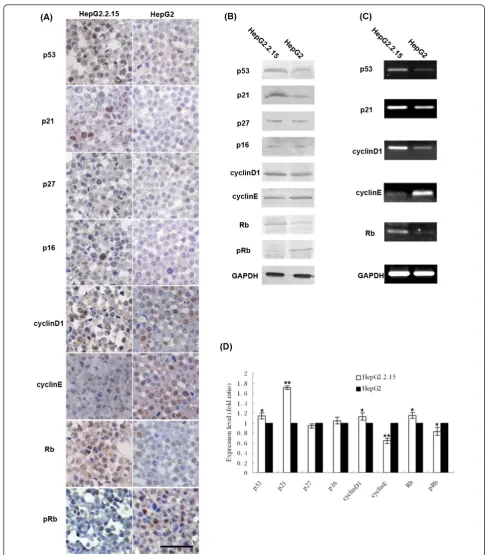
To explore the mechanism of G1 phase arrest, the levels of cell cycle regulator proteins controlling the G1/S phase transition were analyzed by western blot (Figure 4B). We determined that p53, p21 and total Rb were increased, while cyclinE and phosphorylated Rb were decreased in HepG2.2.15 cells compared to those in HepG2 cells. The levels of p16 and p27 showed no sig-nificant difference between the two cell lines.
Table 1 Primer sequences for the genes used in RT-PCR analyses.
Gene Length of production (bp) Primer sequences
p53 638 Sense:5-TGTCCTGGGAGAGACCGGCG-3 CCNE 586 Sense:5-CAGCACTTTCT TG AGCAACACCCTC-3
Antisense:5-TCTCTAT GTCGCACCACTGATACCC-3 RB1 232 Sense:5-CGGGAGTCGGGAGAGGACGG-3
Antisense:5-CGAGAGGCAGGTCCTCCGGG-3
Figure 1Morphological features. (A) Morphological feature under inverted microscope. The magnification is 400×. HepG2.2.15 cell line grew in multilayer and adherence. HepG2 cell line grew in monolayer and adherence. (B) Ultrastructural characteristic. Bar, 500 nm. (i) HepG2.2.15 cell (×3000). (ii) Virus inclusion in HepG2.2.15 cell (×15 k). Bottom left is further magnification (×30 k). (iii) HepG2 cell (×6000).
Immunohistochemical data confirmed that of the wes-tern blot (Figure 4A). CyclinD1 was increased in HepG2.2.15 by western blot, but there was no significant
difference between the two cell lines by
immunohistochemistry.
To determine the point of regulation, the mRNA levels of the altered proteins, including p53, p21, cyclinD1, cyclinE and Rb, were detected by RT-PCR (Figure 4C). We found that in HepG2.2.15 cells, expres-sion of p53, p21, cyclinD1 and Rb was up-regulated and expression of cyclinE was down-regulated. Taken together, HBV affected host gene expression at both the mRNA and protein levels.
Discussion
In this study, ultrastructural features suggested that HepG2.2.15 cells showed decreased ability of prolifera-tion compared to HepG2 cells, which was consistent within vivoand in vitroinvestigations. The result was supported by other investigators[15,16].
We explored the possible mechanism of decreased proliferation of HepG2.2.15 cells by investigating the cell cycle and apoptosis. Our data indicated that approximately 80% of HepG2.2.15 cells were arrested in the G1 phase of replication but few apoptotic cells were observed in in vitro culture. So the reason for slower proliferation of HepG2.2.15 cells was cell cycle arrest and not due to an increase in apoptosis.
HBV DNA was determined to be present at (2.49 ± 0.36) ×106 copies ml-1 in the culture medium of HepG2.2.15 cells and such a high load of HBV replica-tion may be the cause of cell cycle arrest [17] reported that HBV replication was cell-cycle dependent and there was a negative correlation between cell proliferation and the presence of episomal HBV DNA in hepatocytes.
Table 2 Cell cycle distribution of HepG2.2.15 and HepG2 cells.
Cell line Percentage of each cell cycle phase (%)
G1 S G2/M
HepG2.2.15 79.869 ± 6.408* 17.483 ± 5.176* 2.647 ± 2.659 HepG2 57.256 ± 10.880 34.251 ± 7.563 8.494 ± 3.420
Compared with HepG2, *P< 0.05
HBV replication was active in quiescent hepatocytes but slowed when hepatocytes started to divide [18]. The expression of the complete HBV genome could signifi-cantly decrease the proliferation rate by affecting cell cycle control [19]. HBV can affect gene expression in host cells [10] detected differentially expressed genes in HepG2.2.15 and HepG2 cells by the use of a Human Whole Genome Bioarray and found that 2978 genes, including 53 cell- cycle related genes were up- or down-regulated by at least two-fold. Some investigators detected the proteome changes between HepG2.2.15 and HepG2 cell line, and determined that HBV induced protein alterations in diverse cellular functional cate-gories in host cell [14,20].
Did HBV induce G1 phase arrest by regulating the expression of related genes? We examined the genes controlling the G1/S phase transition. In HepG2.2.15 cells, the p21, which can negatively regulate the cell cycle, was up-regulated markedly, whereas the cyclinE, which typically positively regulate the cycle, was
down-regulated. Though cyclinD1 was increased in
HepG2.2.15 cells, phosphorylated Rb was reduced and the cell cycle was arrested at G1 phase at last. The change in p21 level was most significant among the detected factors and can protect cells against apoptosis by arresting cell cycle progression in the G1 phase to repair [21]. Thus, the upregulation of p21 may be important for the inhibition of HepG2.2.15 cell prolif-eration. p53 was also increased in HepG2.2.15 cells, which can induce the expression of p21 down-stream [22]. It has been reported that p21 and p53 protein were up-regulated in HepG2.2.15 cells, which was partly consistent with our result [16]. The upregulation of p21 may also be relevant to HBx. HBx increases the expres-sion of p21 in the presence of p53 and represses p21 when p53 is absent [23].
Additionally, increasing evidence has indicated that the severity, clinical outcome, response to treatment and prognosis of liver diseases are correlated with viral geno-types but not all HBV genogeno-types are associated with HCC [24-26]. For example, genotype C of HBV is more likely to cause serious liver diseases [27,28]. China has a large population of chronic HBV infection and the majority are of genotype C. Moreover, 55% of liver can-cer cases occur in China [29] and India also has many chronic HBV infectious patients, but most are genotype A and D viruses. However, the incidence of HCC is much lower in India than China [30]. The HBV geno-type in HepG2.2.15 cells belongs to the D3 subgenogeno-type. At present, there is no report about the effects of HBV D3 on host cells but epidemiological data suggest that HBV subgenotype D3 may not be associated with HCC [31]. Therefore, the alteration of proliferation ability in HepG2.2.15 might be genotype D3 specific.
Conclusions
In conclusion, HepG2.2.15 cells showed decreased pro-liferation ability compared to its parental HepG2 cells. The possible mechanism was that HBV induced cell cycle arrest by regulating the expression of the genes related to G1/S transition. These results shed new light on the interaction between HBV and host cell. Addi-tionally, the results were good for understanding the characteristics of HepG2.2.15 cells and selecting appro-priate cell lines for research.
Acknowledgements
We are grateful to Professor Yumei Wen for providing us the cell line. This work was supported by Graduate Innovation Foundation of Harbin Medical University (HCXB2010010).
Author details
1Department of Pathology, Basic Medical Science College, Harbin Medical
University, 157 Baojian Road, Nangang District, Harbin 150081, China.
2Cancer Research Institute of Kanazawa University Kakuma-machi, Kanazawa
920-1192, Japan.3Department of Obstetrics and Gynecology, First Affiliated
Hospital of Harbin Medical University, Harbin 150001, China.4National Heart, Lung and Blood Institute of National Institutes of Health, 9000 Rockville Pike, Bethesda, Maryland 20892, USA.
Authors’contributions
TW and RZ contributed equally to this work. XJ, TW, RZ and DK conducted the experiments, ZY supplied critical reagents, YW, LZ and DW maintained animals, CL and CZ analyzed the data, XJ and TW wrote the manuscript. All authors read and approved the final manuscript.
Competing interests
The authors declare that they have no competing interests.
Received: 21 January 2011 Accepted: 15 May 2011 Published: 15 May 2011
References
1. Beasley RP, Hwang LY, Lin CC, Chien CS:Hepatocellular carcinoma and hepatitis B virus. A prospective study of 22 707 men in Taiwan.Lancet
1981,2:1129-1133.
2. Dalgleish AG, Woods RL, Levi JA, Raghavan D, McCaughan GW, Tattersall MH:The role of hepatitis B virus in the etiology of hepatocellular carcinoma in Australia.Aust N Z J Med1983,13:605-607. 3. Perz JF, Armstrong GL, Farrington LA, Hutin YJ, Bell BP:The contributions
of hepatitis B virus and hepatitis C virus infections to cirrhosis and primary liver cancer worldwide.J Hepatol2006,45:529-538. 4. Wang Y, Wu MC, Sham JS, Tai LS, Fang Y, Wu WQ, Xie D, Guan XY:
Different expression of hepatitis B surface antigen between
hepatocellular carcinoma and its surrounding liver tissue, studied using a tissue microarray.J Pathol2002,197:610-616.
5. Chen BF, Liu CJ, Jow GM, Chen PJ, Kao JH, Chen DS:High prevalence and mapping of pre-S deletion in hepatitis B virus carriers with progressive liver diseases.Gastroenterology2006,130:1153-1168.
6. Liu CJ, Chen BF, Chen PJ, Lai MY, Huang WL, Kao JH, Chen DS:Role of hepatitis B virus precore/core promoter mutations and serum viral load on noncirrhotic hepatocellular carcinoma: a case-control study.J Infect Dis2006,194:594-599.
7. Luan F, Liu H, Gao L, Liu J, Sun Z, Ju Y, Hou N, Guo C, Liang X, Zhang L,
et al:Hepatitis B virus protein preS2 potentially promotes HCC development via its transcriptional activation of hTERT.Gut2009,
58:1528-1537.
9. Sells MA, Chen ML, Acs G:Production of hepatitis B virus particles in Hep G2 cells transfected with cloned hepatitis B virus DNA.Proc Natl Acad Sci USA1987,84:1005-1009.
10. Ding XR, Yang J, Sun DC, Lou SK, Wang SQ:Whole genome expression profiling of hepatitis B virus-transfected cell line reveals the potential targets of anti-HBV drugs.Pharmacogenomics J2008,8:61-70. 11. Li GQ, Xu WZ, Wang JX, Deng WW, Li D, Gu HX:Combination of small
interfering RNA and lamivudine on inhibition of human B virus replication in HepG2.2.15 cells.World J Gastroenterol2007,13:2324-2327. 12. Xin XM, Li GQ, Guan XR, Li D, Xu WZ, Jin YY, Gu HX:Combination therapy
of siRNAs mediates greater suppression on hepatitis B virus cccDNA in HepG2.2.15 cell.Hepatogastroenterology2008,55:2178-2183.
13. Otsuka M, Aizaki H, Kato N, Suzuki T, Miyamura T, Omata M, Seki N:
Differential cellular gene expression induced by hepatitis B and C viruses.Biochem Biophys Res Commun2003,300:443-447.
14. Wang J, Jiang D, Zhang H, Lv S, Rao H, Fei R, Wei L:Proteome responses to stable hepatitis B virus transfection and following interferon alpha treatment in human liver cell line HepG2.Proteomics2009,9:1672-1682. 15. Liu X, Liang J, Li G:Lipopolysaccharide promotes adhesion and invasion
of hepatoma cell lines HepG2 and HepG2.2.15.Mol Biol Rep2009,
37:2235-2239.
16. Livezey KW, Negorev D, Simon D:Hepatitis B virus-transfected Hep G2 cells demonstrate genetic alterations and de novo viral integration in cells replicating HBV.Mutat Res2000,452:163-178.
17. Ozer A, Khaoustov VI, Mearns M, Lewis DE, Genta RM, Darlington GJ, Yoffe B:Effect of hepatocyte proliferation and cellular DNA synthesis on hepatitis B virus replication.Gastroenterology1996,110:1519-1528. 18. Huang YQ, Wang LW, Yan SN, Gong ZJ:Effects of cell cycle on telomerase
activity and on hepatitis B virus replication in HepG2 2.2.15 cells.
Hepatobiliary Pancreat Dis Int2004,3:543-547.
19. Friedrich B, Wollersheim M, Brandenburg B, Foerste R, Will H, Hildt E:
Induction of anti-proliferative mechanisms in hepatitis B virus producing cells.J Hepatol2005,43:696-703.
20. Tong A, Wu L, Lin Q, Lau QC, Zhao X, Li J, Chen P, Chen L, Tang H, Huang C, Wei YQ:Proteomic analysis of cellular protein alterations using a hepatitis B virus-producing cellular model.Proteomics2008,
8:2012-2023.
21. el-Deiry WS, Harper JW, O’Connor PM, Velculescu VE, Canman CE, Jackman J, Pietenpol JA, Burrell M, Hill DE, Wang Y,et al:WAF1/CIP1 is induced in p53-mediated G1 arrest and apoptosis.Cancer Res1994,
54:1169-1174.
22. el-Deiry WS:p21/p53, cellular growth control and genomic integrity.Curr Top Microbiol Immunol1998,227:121-137.
23. Ahn JY, Jung EY, Kwun HJ, Lee CW, Sung YC, Jang KL:Dual effects of hepatitis B virus X protein on the regulation of cell-cycle control depending on the status of cellular p53.J Gen Virol2002,83:2765-2772. 24. Masaadeh HA, Hayajneh WA, Alqudah EA:Hepatitis B virus genotypes and
lamivudine resistance mutations in Jordan.World J Gastroenterol2008,
14:7231-7234.
25. Tonetto PA, Goncales NS, Fais VC, Vigani AG, Goncales ES, Feltrin A, Goncales FL Jr:Hepatitis B virus: molecular genotypes and HBeAg serological status among HBV-infected patients in the southeast of Brazil.BMC Infect Dis2009,9:149.
26. Zumbika E, Ruan B, Xu CH, Ni Q, Hou W, Chen Z, Liu KZ:HBV genotype characterization and distribution in patients with HBV-related liver diseases in Zhejiang Province, P.R. China: possible association of co-infection with disease prevalence and severity.Hepatobiliary Pancreat Dis Int2005,4:535-543.
27. Chan HL, Wong GL, Tse CH, Chim AM, Yiu KK, Chan HY, Sung JJ, Wong VW:
Hepatitis B virus genotype C is associated with more severe liver fibrosis than genotype B.Clin Gastroenterol Hepatol2009,7:1361-1366.
28. You J, Sriplung H, Chongsuvivatwong V, Geater A, Zhuang L, Huang JH, Chen HY, Yu L, Tang BZ:Profile, spectrum and significance of hepatitis B virus genotypes in chronic HBV-infected patients in Yunnan, China.
Hepatobiliary Pancreat Dis Int2008,7:271-279.
29. Parkin DM, Bray F, Ferlay J, Pisani P:Global cancer statistics, 2002.CA Cancer J Clin2005,55:74-108.
30. Datta S:An overview of molecular epidemiology of hepatitis B virus (HBV) in India.Virol J2008,5:156.
31. Chandra PK, Biswas A, Datta S, Banerjee A, Panigrahi R, Chakrabarti S, De BK, Chakravarty R:Subgenotypes of hepatitis B virus genotype D (D1, D2, D3
and D5) in India: differential pattern of mutations, liver injury and occult HBV infection.J Viral Hepat2009,16:749-756.
doi:10.1186/1743-422X-8-231
Cite this article as:Wanget al.:Hepatitis B virus induces G1 phase arrest by regulating cell cycle genes in HepG2.2.15 cells.Virology Journal
20118:231.
Submit your next manuscript to BioMed Central and take full advantage of:
• Convenient online submission
• Thorough peer review
• No space constraints or color figure charges
• Immediate publication on acceptance
• Inclusion in PubMed, CAS, Scopus and Google Scholar
• Research which is freely available for redistribution