THE
RELATION OF MITOTIC RECOMBINATION TO DNA REPLICATION I N YEAST PEDIGREES'JJUDITH WILDENBERG
Department of Biology, Brooklyn College of the City University of New York Brooklyn, New York 132103
Received April 6, 1970
A L L E L I C recombinants occur among mitotically dividing diploid yeast cells at frequencies significantly lower than those commonly observed subsequent to meiosis (ROMAN 1956a). Consequently, information about such events derives mainly from studies employing selective techniques (reviewed by PRITCHARD 1963). Typically, prototrophic revertants among heteroallelic diploid cells are detected as clones on minimal medium, some 20 to 25 cell generations after the initial recombinational event. Since any auxotrophic segregants of the proto- trophic cell are not recovered with this procedure, each genetic strand present at the time of reversion is not necessarily available for analysis. Thus the data obtained from diploid prototrophs are considerably less detailed than from meiotic tetrads.
The present experiment represents part of a study designed to elucidate the genetic characteristics of mitotic intragenic recombination. This paper is con- cerned with the relationship of DNA replication to X-ray induced prototroph formation and outside marker recombination in synchronous, prereplicative cul- tures of Saccharomyces cerevisiae. The recovery of all of the viable cell products of each prototrophic cell is operationally analogous to tetrad isolation. It is found that both reciprocal and nonreciprocal products of recombination can originate at a two-strand stage in mitotic cells. Further, evidence is presented for the occur- rence of events that are formally similar to those reported for phage heterozygotes (HERSHEY and CHASE 1951) and the postmeiotic segregants observed in yeast ( FOGEL and
HURST,
in preparation) and other fungi (KITANI, OLIVE and EL-ANI 1962; LISSOUBA, MOUSSEAU, RIZET and ROSSIGNOL 1962).MATERIALS A N D METHODS
Strains: The diploid strain 22367 utilized in this experiment was previously described by FOGEL and HURST (1967) and has the following genotype:
a
+
hisl-315+
arg6 trp2 l e d+
0
-thr3
+
hisl-1+
+
+
ade60- ____
+
o
a ura3
adei
gal2 0- adel
+
0-Adapted from a thesis submitted in partial fulfillment of the requirement for the degree of Doctor of Philosophy, * Aided by a Predoctoral Fellowship from the Department of Health, Education and Welfare and by Public Health The City University of New York.
Service Grant RG-06979 to Dr. S . FOGEI. and Dr. D. D. HURST.
The ura3 (uracil), thr3 (threonine and methionine), hisf (histidine), arg6 (arginine) and
trp2 (tryptophan) markers are located on linkage V in this order, as determined by MORTIMER and HAWTHORNE (1966). The meiotic map distances are: ura3-5.0-centromere-34.&thr3-2.4-
hisf-lO.krg6-20.8-trp2 (HAWTHORNE and MORTIMER 1960; FOGEL and HURST 1967). Aside from the loci leuf (leucine) and ade6 (adenine), which are both located in linkage group VII, the remaining markers segregate independently of each other ( MORTIMER and HAWTHORNE
1966).
M e d i c For details of the solid media used in these experiments see ROMAN (1956b), FOGEL and HURST ( 1 963), and HURST and FOGEL (1964).
Isolation of synchronous cells: Synchronously dividing cultures were obtained by isolating a uniformly sized cell fraction. Such cells possess the advantage of dividing synchronously upon inoculation into fresh medium without prior cycles of feeding and starvation. One clone from a synthetic complete streak plate was inoculated into 10 ml of double strength yeast extract- peptone-dextrose (YEPD, ROMAN 1956b) contained in a 50 ml Erlenmeyer flask a t a concentra- tion of about 100 cells per ml. The culture was incubated 48 h r a t 30°C with shaking. After three washings, the cells were resuspended in 5 ml of sterile distilled water at a concentration of about 6 8 x 10⁸ cells per ml. The suspension was then slowly centrifuged for approximately 2 min leaving only the smallest cells in the supernatant. A swinging-bucket centrifuge was used
(International Model CL). Since the exact speed and time of centrifugation vary with the con- centration of cells and the proportion of small cells in the population, these parameters must be determined individually for each culture. The supernatant was decanted and observed micro- scopically. Any sample displaying discernible heterogeneity in size or more than 0.5% budded cells was discarded. The original pellet was resuspended in 5 ml of distilled water and the centri- fugation repeated until the requisite cell number was isolated.
The synchronous division of the isolated fraction was established as follows. Cells were inoculated into single-strength YEPD at a concentration of 4 x 10⁷ cells per ml and incubated at room temperature. At 15 min intervals, samples were removed and diluted with sterile distilled water containing 2 drops per ml of a 37.5% solution of formalin (FSPOSITO 1968). These were then scored for the percentage of budded cells and cell number. The increase in the number of visibly budded cells with time was observed with an oil immersion objective. A Coulter Counter (Model B) was used to measure the increase in the number of cells. Since separation of the bud from the mother cell does not usually occur until one or both cells begins to bud again (WILLIAMSON 1964), the latter values will remain constant until the beginning of the second budding cycle. To obtain uniform separation of the mother and daughter cells a t the second budding cycle, all measurements on samples observed to contain pairs of budded cells were preceded by a 10 sec exposure to ultrasonication (WILLIAMSON 1964). A Branson Ultrasonicator set at a power setting of one was used.
DNA measurements: DNA was extracted from approximately 1-2 x 10s cells according to the method described by OGUR et al. (1952) except that the ether extraction was omitted (SCHNEIDER 1945). The amount of DNA in each sample was assayed colorimetrically with the diphenylamine reagent (BURTON 1956). Epual volumes of diphenylamine reagent and sample were used. Calbiochem Grade A highly polymerized DNA served as the standard.
D N A REPLICATION A N D RECOMBINATION IN YEAST 293
the mother cell and its bud. The slabs were transferred to YEPD plates and incubated 4 8 hr. The subsequent clones were replica-plated to an appropriate series of synthetic complete plates lacking single nutrients and scored for all parentally heterozygous markers. In addition, each series contained a potassium acetate plate to induce sporulation (MCCIARY, NUL= and MILLER 1959). All phenotypically different clones, or the clones derived from the mother cell and first bud, were selected for microdissection and tetrad analysis. Asci with four viable ascospores were chosen from each clone and scored for all parentally heterozygous markers. The parental his2
allele in auxotrophic spores was identified by allele testing (HURST and FOGEL 1964.). This recombinational test is dependent on the difference in prototroph frequency between homoallelic and heteroallelic diploids (ROMAN 1956a). Each ascosporal clone was crossed to tester strains of
hid-315 and of hid-1 and the resulting diploids scored for mitotic reversion to prototrophy. Spores homoallelic to the tester strain or double mutant spores, operationally homoallelic to both tester strains, will produce few or no prototrophic papillations in the resultant diploid cells. The results were confirmed by crossing each ascospore clone to a third tester strain, hid-270, which complements his1-315 but yields a typical heteroallelic papillation pattern when combined with
hisi-1.
X irradiatiom Cultures were irradiated on the surface of agar slabs with soft X rays delivered from a Machlett OEG-60 unfiltered beryllium window X-ray tube operated at 50kV and "A.
The dose rate was 22r per sec at the agar surface as measured by an air extrapolation chamber
( MORTIMER 1953).
RESULTS A N D DISCUSSION
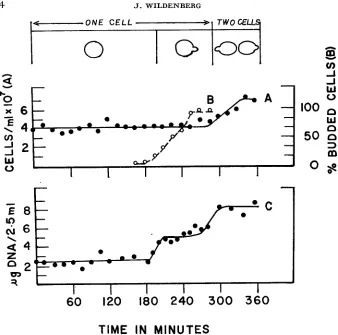
Mitotic synchrony: Synchronously dividing cultures of 22367 in YEPD were sampled at 15 min intervals for a period of 6 hr. The increase in the percentage of budded cells in the culture is shown in Figure IB. Budded cells first appear after 195 min of growth and within a subsequent 60 min period they represent 90 to 95% of the culture. The second budding cycle, measured as a n increase in the number of cells, begins at approximately 285 min and is completed within 45 to 60 min.
The increase in the amount of DNA per sample with time is also shown in Figure IC. Each point on the curve represents the average DNA value in dupli- cate samples from one culture. DNA synthesis is initiated at the time budded cells are first apparent and it is completed within 30 min. Thus it is likely that the initial cells are mainly at a two-strand stage and have not yet replicated their
DNA for the first division.
The mean value of DNA per diploid nucleus is calculated to be 2.45 -+0.42 X g. This estimate is based on the average determination at each of 12 points prior to the initiation of DNA synthesis. While these values are lower than those available from heterogeneous diploid populations (4.9 f 0.60 X g; OGUR
et al. 1952), the discrepancy is undoubtedly contributed to by the difficulty in estimating the number of replicated cells in asynchronous cultures.
X-ray induced prototroph-containing pedigrees: The system used in the present studies can clarify the relation of intra- and intergenic recombination to DNA
n
a
TIME IN MINUTES
FIGURE 1.-Cell growth and DNA synthesis in diploid 22367 in YEPD. 4 x 10: unbudded cells per ml were inoculated in YEPD at zero time. DNA was extracted and assayed from 2.5 m l samples removed at the indicated times (Curve C). The number of cells per ml and the per- centage of budded cells were measured in the same culture (Curves A, B)
.
The definition of cell number is according to WILLIAMSON (1964).type of each diploid clone was inferred from the meiotic segregations and the results of the allele identification tests. Tables 1, 2 and 3 show the derived geno- types. The cell order is arbitrarily chosen since the prototrophic unit was fre- quently detected after the bud had attained the size of the mother cell. The absence of polyploidy among the pedigrees is suggested from the regular 2+:2-
segregations for the various heterozygous nutritional markers and the mating- type locus. Unlinked suppressors were not detected.
The 129 pedigrees could be distributed into 68 types, probably reflecting both the unrelatedness and the highly heterogeneous nature of the primary events. These were further grouped into three general categories possessing the following characteristics. Class I: pedigrees consisting entirely of prototrophic segregants.
*
+
and - signify wild-type and mutant alleles, respectively, as determined by tetrad analysis+
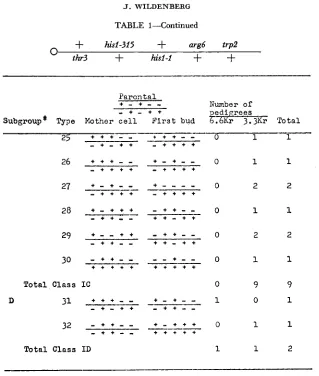
Class I designates pedigrees containing only HIS prototrophic segregants. and allele identification tests.TABLE 1
Genotypes+ of X-ray induced HIS prototrophs Class I+ pedigrees from diploid 22367
+
hid-315+
arg6 trp20
thr3
+
h i d - 1+
+
P a r e n t a l
Number of - + - + + Dedi rees
+ - + - -
Subgroup2 Type Mother c e l l F i r s t bud
e
T o t a l 1A * + + - - 7
- + - + + 2 3 4 5 6 7
a
9 1 0 11 1 2 13 14T o t a l Class IA
B 15 + + + - -
+ + - + +
16 + + + - -
- + - + +
+ - + + + - + + + +
T o t a l Class I B
TABLE 1-Continued
+
hisf-315+
argd trp2O thr3
+
hisf-1+
+
P a r c n t a l
+ - + - - Number o f
- + - + + Dedi r e e s
Subgroup* Type Isother c e l l F i r s t bud
g
m
T o t a l-
+ + + - - + + + - - 0 1 1
25
--
- + - + + - + + + +26 + + + - - + - + - - 0 1 1
27 + - + - - - + - - - 0 2 2
- + + + + - + + + +
- + + + + - + + + +
2 2
30 - + + - - - - + - - 0 1 1
+ + + + + + + + + +
T o t a l C l a s s I C 0 9 9
32 - + + - - + - + + + o 1 1
T o t a l Class I D 1 1 2
-__-
, + + - - + + + + +
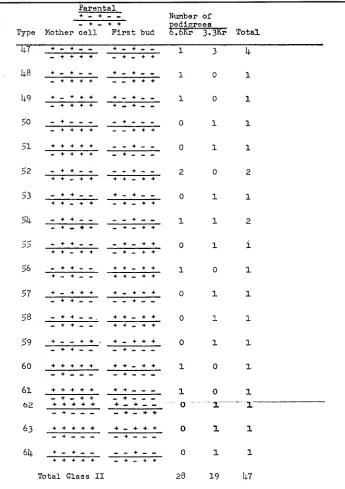
Class 11: pedigrees containing his auxotrophic as well as prototrophic cells. Class
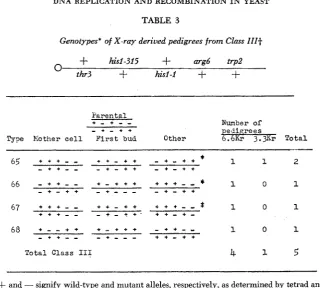
111: pedigrees containing three o r more cells genetically distinct at the hisl locus or for the marker arrays flanking the hisl locus.
Among the pedigrees comprising the first class, the predominant types are those in which the mother and all daughter cells are genotypically identical. That is, they possess the same parental hisl allele and the same outside marker arrays. These represent subgroup A of Class I. The remainder were distributable into three additional subgroups. Class IB includes pedigrees where the same
hisl allele accompanies the prototrophic strand but different flanking marker arrangements characterize the mother and daughter cells. Class IC consists of
DNA REPLICATION A N D RECOMBINATION IN YEAST
TABLE 2
Genotypes' of X-ray derived pedigrees from Class II+
+-
hid-315+-
argd trp2thr3
+
hisl-I+
+
0
297
P a r e n t a l
+ - + - , Number o f e d i r e e s
- + - + +
Type PIoIotner c e l l F i r s t bud T o t a l 33 + + + - - + - + - -
- + , + + - + - + + 34 35 36 37 38 39 40
41
42
43 4445
46 + + + - , + - + - , + + - + + - + - + + + + + - , + - + - - + + - + + + + - + + + + + - - + + - + + - - + - - + + - + ++ + + - - + , + + e
+ + + - - + - + + +
+ + + - - + + - + +
- + + - - e + - + +
+ + + - , - + - + + - + + - - - + - + + -. + + + - , + + - - - - + + + + - + - + * 9 1 1 0 0 1 1 1 0 1 1 1 1 1 2 0 0 1 1 0 0 0 1 0 0 0 0 0 11 1 1 1 1 1 1 1 1 1 1 1 1 1
Formal genetic criteria may be applied in evaluating the timing of prototroph formation and coincident outside marker recombination. About 92% of the prototrophic revertants of Tables 1-3 lack the doubly mutant strand (his1-315,1)
TABLE 2- (Continued)
P a r e n t a l
Number of
- + - + + e d i - r e e s + - + - -
Type Nother c e l l F i r s t bud T o t a l
0 1 1
53 - + + - - + , + , -
+ + - + + - + - + +
1 1 2
54
- + + - , - - + e-;; - + + - - - + - + +
- + , + + - + - + +
0 1
i
+ + - + + - + - + +
0 1
56 - + + - - + + - + + 1
+ - + - - + + - + +
0 1 I
57 + - + + + + - + + +
- + + - - - - + - -
0 1 1
59 + - - + + . + - + + +
60 + + + + + + + - + + 1 0 1
- + + - - - + - - -
- + - - - - + - - -
*
+
and-
signify wild-type and mutant alleles, respectively, as determined by tetrad analysisD N A R E P L I C A T I O N A N D R E C O M B I N A T I O N I N YEAST 299
TABLE 3
Genotypes' of X-ray derived pedigrees from Class I I I t
hisl-315
+
arg6 frp2~ h r 3
+
his14+
+
P a r e n t a l
+ - + - - Number of
- + - + +
!Pyp Xother cell. F i r s t bud Other
65 + + + - - + + - + + - + - + + * 1 1 2
- + + - - - + - + + - + - + +
67 + + + - - + + - + + + + + - - * 1 0 1
+ + + - - - + - + + . + + - + -
68 + - - + + + - + + + - + + - - 1 0 I
- + + - - - + . . - - + + e + +
Total. Class 111
4
I.5
*
+
and - signify wild-type and mutant alleles, respectively, as determined by tetrad analysis$ Class 111 designates pedigrees with three or more cells genetically distinct a t the his1 cistron
$ Isolated from first bud. and allele identification tests.
or for the marker arrays flanking the his1 cistron.
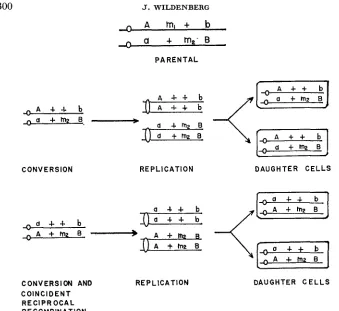
two auxotrophic chromosomes with the same parental alleles will be present at the ensuing first mitotic metaphase. In the absence of additional exchanges, normal mitotic centromere distribution will yield two prototrophic cells. When reciprocal products of recombination arise at the two-strand stage, DNA replica- tion will result in two pairs of recombinant chromosomes. Each cell will receive a recombinant strand and its reciprocally related complement if the centromeres disjoin as in a normal mitosis. Thus recombination at a two-strand stage will yield two genetically identical cells. These relationships are illustrated in Figure 2. Different results will be obtained if conversion occurs subsequent to DNA dupli- cation or if duplication is required to resolve events initiated at a two-strand stage. The expected products are shown in Figure 3. In this case three auxotrophic strands and a prototrophic strand will be present at the first metaphase following the conversional event. Mitotic centromere d i s j ~ c t i f f ~ will result in a hetero- allelic auxotrophic segregant and a prototrophic cell. Alternatively, two parental and two recombinant arrays are expected if reciprocal recombination occurs at a
A A
m , +
b a+
m
;
B-
-
P A R E N T A L
A + + b
, n A
-
+ - L b-
n a + m 2 E ___*
a + m 2 E "
CONVERSION R E P L I C A T I O N DAUGHTER C E L L S
, a + + b
"
,,A " + m z E
CONVERSION AND R E P L I C A T I O N C OlNCl D E N T
R E CI P R OCA L RECOMBINATION
A + m 2 E
DAUGHTER C E L L S
FIGURE 2.-Four strands expected at the first mitotic metaphase when gene conversion (top) or conversion and coincident reciprocal recombination (bottom) occur at the two-strand stage. In the absence of additional exchanges with the centromere, normal mitotic disjunction will yield two genetically identical cells.
present at the first mitotic metaphase were inferred from the genotypes of the mother cell and first bud.
It is apparent from Tables 1-3 that one-half to two-thirds of the pedigrees con- tain only HIS prototrophic progeny (Class I ) . With the exception of two types (15, 17, Class IB), this absence of a
his
auxotrophic cell is associated with the absence of two parentally marked strands (+ arg and thr -t) in pedigrees dis- playing reciprocally recombined thr, arg configurations (++ with thr arg).
I n contrast, two parental types occur in approximately one-half of those Class I1 and Class I11 pedigrees containing two reciprocally related nonparental chromo- somes.D N A REPLICATION A N D RECOMBINATION IN YEAST 301
P A R E N T A L R E P L I C A T I O N , CONVERSION
D A U G H T E R C E L L S
P A R E N T A L R E P L I C A T I ON, CONVERSION AND C O I N C I D E N T R E C I P R O C A L R E C O M B I N A T I O N
OR
[3-Tz-9
[
T
I
D A U G H T E R C E L L S
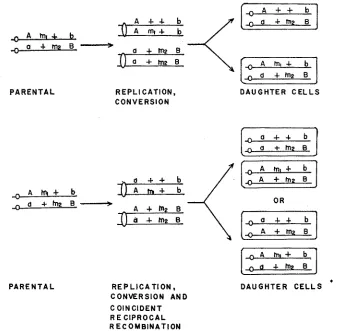
FIGURE 3.-Four strands expected at the first mitotic metaphase when gene conversion (top) or conversion and reciprocal recombination (bottom) occur at the four-strand stage. The same distribution as the one shown in the top part of the diagram might be expected from conversional events that are initiated at a two-strand stage but which are resolved via DNA duplication.
a nonviable cell among the first four division products, the propo~ion is com- parable to the value observed in the remainder of the population (15% or 8/52) and in unselected pedigrees from asynchronous cultures of 22367 treated with 7.7Kr X rays (25%; C. BEAM, personal communication).
four-strand stage but the reciprocal product was not recovered ( x 2 = 5.12 with Yates’ correction, P = 0.05-0.02).
The relationship of recombination to DNA replication cannot be unequivocally established for the remaining Class
I
pedigrees. However in Table 1 the Class IC types and type 32 (Class ID) may be analogous to the postmeiotic segregants observed in other fungi (KITANI, OLIVE and EL-ANI 1962; LISSOUBA et al. 1962). On the assumption that conversion involves the repair of improperly paired bases in hybrid DNA segments (HOLLIDAY 1964; WHITEHOUSE 1963), such events probably reflect the resolution, at replication, of uncorrected heterozygous sites (WHITEHOUSE 1963; MESELSON 1967). The relevant mitotic pedigrees display two identical prototroph strands accompanied by two sister strands with differenthisl alleles. These distributions are consistent with the formation of hybrid regions in both homologous chromosomes at the two-strand stage. If correction of improperly paired bases occurred in only one of the two homologs, DNA
duplication would yield two identical chromosomes, namely the two prototroph strands, and two sister chromosomes genotypically similar except at the hetero- zygous sites included in the biparental region. The high frequency of nonparental flanking marker combinations in these pedigrees (50%) is consistent with the view that pairs of hybrid regions are often formed during the events resulting in breakage and reunion.
In the absence of correction in prereplicatively formed hybrid regions, dupli- cation might also be expected to result in a prototrophic chromosome and three auxotrophic chromosomes. Such conversional events would be indistinguishable from those arising at a four-strand stage. Thus some component of the Class I1 pedigrees may likewise originate prior to replication. This fraction is unidenti- fiable where a single parentally marked prototrophic chromosome is observed or where a reciprocal flanking marker array is not recovered. Among the remaining Class I1 pedigrees, a prereplicative origin can probably be assigned where two identical prototrophic chromosomes and a homoallelic auxotrophic segregant are observed (types 42, 43, 44, 45, 58; total 5). This timing is indicated as well for 50% of those Class I1 pedigrees with flanking markers reciprocally recombined. Here, two parentally marked chromosomes do not accompany the reciprocally related pair. Instead, two pairs of recombinant chromosomes are recovered (types 52, 57, 59, 60, 63). Conceivably, such convertants originate in a two-stranded stage but require major DNA synthesis for resolution of the prototrophic geno- type. These latter types would likewise be formally similar to postmeiotic segregants. Segregation of hybrid segments as a result of DNA doubling finds additional support in those Class I11 pedigrees characterized by three uniquely
different hisl arrangements.
DNA REPLICATION AND RECOMBINATION I N YEAST 303
I thank Dr. S. FOGEL and Dr. D. D. HURST for valuable suggestions and stimulating discus- sions during the course of this work and for helpful criticism during the preparation of this manu- script.
S U M M A R Y
Histidine prototrophic cells were selected from X-ray treated synchronous yeast cultures. The isolation of the first few division products of each diploid cell ensured the recovery of all genetic strands present at the time of recombi- nation. The genotypes of the mother cell, first bud, and any other phenotypically unique segregant were resolved by tetrad analysis and allele identification tests. The data indicate that both reciprocal and nonreciprocal products of recombi- nation originated at the two-strand stage in a large fraction of the analyzed pedi- grees. Events that are probably similar to phage heterozygosis and postmeiotic segregation were observed as well.
LITERATURE CITED
BURTON, K., 1956
ESPOSITO, R., 1968
FOGEL, S. and D. D. HURST, 1963
A study of the conditions and mechanism of the diphenylamine reaction for the colorimetric determination of deoxyribonucleic acid. Biochem. J. 62 : 315-322.
Genetic recombination in synchronized cultures of Saccharomyces cerevisiae. Genetics 59: 191-210.
Coincidence relations between gene conversion and mitotic recombination in Saccharomyces. Genetics 48: 321-328.
-
,
1967 Meiotic gene con- version in yeast tetrads and the theory of recombination. Genetics 57: 455-481.Chromosome mapping in Saccharomyces: Cen- tromere-linked genes. Genetics 45: 1085-1 110.
Genetic recombination and heterozygosis in bacteriophage. Cold Spring Harbor Synip. Quant. Biol. 16: 471-479.
HAWTHORNE, D. C. and R. K. MORTIMER, 1960
HERSHEY, A. D. and M. CHASE, 1951
HOLLIDAY, R., 1964
HURST, D. D. and S. FOGEL, 1964
myces cerevisiae. Genetics 50: 435-458. KITANI, Y., L. S. OLIVE and A. S. EL-ANI, 1962
segregation at the g locus. Am. J. Botany 49: 697-706. LISSOUBA, P., J. MOUSEAU, G. RIZET and J. L. ROSSIGNOL, 1962
ascomycete Ascobolus immersus. Advan. Genet. 11 : 343-380. MCCLARY, D. O., W. L. NULTY and G. K. MILLER, 1959
the sporulation of Saccharomyces. J. Bacteriol. 7 8 : 362-368. MESELSON, M., 1967
Mendel. Edited by R. ALEXANDER BRINK. University of Wisconsin Press, Madison. MORTIMER, R. K., 1953
MORTIMER, R. K. and D. C. HAWTHORNE, 1966
53: 165-173.
A mechanism for gene conversion in fungi. Genet. Res. 5 : 282-304. Mitotic recombination and heteroallelic repair in Saccharo-
Genetics of Sordaria fimicola. V. Aberrant
Fine structure of genes in the
Effect of potassium versus sodium in
The molecular basis of recombination. pp. 81-104. In: Heritage From
Ph.D. thesis, University of California, Berkeley.
Genetic mapping in Saccharomyces. Genetics
OGUR, M., S. MINCKLER, G. LINDEGHEN and C. C. LINDEGREN, 1952 The nucleic acids in a polyploid series of Saccharomyces. Arch. Biochem. Biophys. 40: 175-1 84.
Genetics. Edited by WALTER J. BURDETTE. Holden-Day, San Francisco.
ROMAN, H., 1956a Studies on gene mutation in Saccharomyces. Cold Spring Harbor Symp.
-, 1956b A system selective for mutations affecting syn-
Extraction and estimation of deoxypentose nucleic acid and of pentose
A theory of crossing over by means of hybrid deoxyribonucleic
Division synchrony in yeast. pp. 351-380. In: Synchrony In Ce2Z Quant. Biol. 21: 175-183.
thesis of adenine in yeast. Compt. Rend. Trav. Lab. Carlsberg. Ser. Physiol. 26: 299-314.
nucleic acid. J. Biol. Chem. 161 : 293-303.
acid. Nature 199: 1034-104.0.
Division And Growth. Edited by E. ZEUTHEN. Wiley, New York. SCHNEIDER, W. C., 1945
WHITEHOUSE, H. L. K., 1963