AN APPROXIMATION
OF THE
MINIMUM-VARIANCE ESTIMATORO F HERITABILITY BASED ON VARIANCE COMPONENT ANALYSIS
M. GROSSMAN A N D H. W. NORTON
Departments of Dairy Science and Animal Science, University of Illinois at Urbana-Champaign, Urbana, Illinois 61801
ABSTRACT
An approximate minimum-variance estimate of heritability (h2) is pro-
poserl, using the sire and dam components of variance from a hierarchical anal- ysis of variance. The minimum sampling variance is derived for unbalanced data. Optimum structures for the estimation of h2 are given for the balanced case. The degree to which
k
is more precise than the equally weighted estimate is a function of the size and structure of the sample used. However, computer simulation reveals that R z has less desirable behavior than " + D . An iterative procedure improved the estimation of hz, especially in small populations, when those values of hLt or hi outside the range of the parameter were constrained to zero or unity.* A
ERITABILITY can be estimated in several ways from data in a hierarchical design with a random sample of progeny from each dam and a random sample of dams mated to each sire also chosen at random (each dam being mated to only one sire). The model is
Pijk = E".
+
Si Dij E i j k,
(1)where Pijk is the measurement on the kth progeny of the jth dam mated to the
ith sire, p is the population mean, Si is the effect of the ith sire, Dij is the effect of the jth dam mated to the ith sire and Eijk is the residual effect. Here, there are
i
= 1,..
. ,
s sires, j = 1,.. . ,
di
dams/sirei,
and k = 1,. .
.
,
ni3 progeny/dam ij. Furthermore, ,E nij ,= ni. =number of progeny of sirei,
and Zz
n i j =N c
total number of progeny. Assuming all effects have mean zero and are mutually uncorrelated, we can put
E[S4] = U:,
E I D i j l
= U;, E [ E : j k ] = u2 and E[P:,,]-
p z I= U; =+
U;+ uZ. Three measures of heritability can be obtained(FALCONER
1960, p.175):
that from the sire component,hi=
4 w ~ / u ~ , that from the dam component, A;= 4u;/(r2,, and that from the sire-plus-dam components,hi
+ = 2(U;
+
u;)/u~,.Approximate sampling variance for these variance-component estimators have
d% (I d ,
3=1 i=1 j=1
been given by OSBORNE and PATERSON ( 1 952) and DICKERSON ( 1 9 6 9 ) . The three heritability ratios are equal when U:= U; and can be estimated with various functions of the three mean squares in the analysis of variance model ( 1 ) .
An important assumption in the use of the full-sib family model for estimating heritability is that only additive genetic variance contributes to the covariance between family members
(HILL
andNICHOLAS
1974). If the covariances of non- additive genetic and common environmental effects are nonzero, the estimated heritability will be biased. If the assumption can not be defended, caution i n the use of these estimates should be observed.T H E O R Y
A
W e propose another heritability estimator, h2, which is a n average of the sire- and dam-component estimates weighted toh have minimum sampling varianfe. The weighted estimate of the heritability (h') and its sampling variance V ( P )
is derived for unbalanced data from a population under random selection with 110 inbreeding or assortative mating.
Suppose that two estimates of $eritability,)i and
ti,
have the same expecta- tion, h2; different variances, V ( h i , ) and V ( h i ) ; and covarianceC(?zi,hg).
W e choose weights, ws and wu7 so that the estimatej 2 2 .= Ws@.
4-
w,A;
( 2 )will be unbiased and have minimum variance. For
h2
to be unbiased, its expected value,E&) =
w,E(Ai)
+
WUE(i2i) = (ws+
w,)h?
must equal h', so t$t wS.+ W D = 1, or W D ,= 1
-
wS.The variance of h2, which we wish to minimize, is
(3)
A A V(R2) = w;v(R;,
+
( 1-
ws)'V(2;) +2w,(l-
ws)C(hi,h;).= W i [ V ( i i )
+
v(j2;)
-
Zc(i;,i;,l
-
2 w s [ v ( i ; ) -
c&,h;,1
+
V(Rz,).
(4)The value of ws that minimizes this variance is
and equation (4) reduces to its minimum
In the special case that V ( h i ) ,= V ( h ; ) , it follows that ws :=
l/e
and theWEIGHTED ESTIMATION O F HERITABILITY 419 ESTIMATION
DICKERSON
(1969) obtained estimators for the approximate variances and covariance of two heritability estimates for unbalanced data. They are:and
where ns = s
+
1, n D=.z(&
-
1 )+
2, n E ="(nij - 1)+
2,k,
is the coeffi-cient of the dam component i n the dam mean square, .and k , is the coefficient of the sire component in the sire mean square:
2.
Substituting (8)
-
(10) into ( 5 ) - (7), one obtains a n estimate ofAthe approxi- mate weight,GS,
and estimators of the approximate variances of h2 andh i + D ,
V ( h ' ) and V(&+,,). Having obtained the estimate of the approximate weight, it can be substituted into
. A A A A
to yield a n approximate estimate of the weighted heritability,
RB
=+
OPTIMUM DESIGNS
Suppose that in any one generation, the number of progeny that can be tested is
N .
One question is how to apportion N observations so as to minimize t h e variance of the heritability estimate(h")
ROBERTSON (1959) examined the prob- lem of optimum evaluation of sire and dam intraclass correlations separately, I n this section, we show optimum.structures using both the half-sib [ t=
u:/u;,]and full-sib [T = (U:
+
u:)/ai,] intraclass correlations. The analysis of variance is:Source d.E. M.S. E [M.S.]
Sires (S) s-I MS u;[l--T+n(T-t) + n d t ]
Substituting the expectations of the mean squares into (8)
-
(IO), using degrees of freedom instead of degrees of freedom plus two, one obtains the approximate variance ofh2
and h:+,in terms of s, d,n,
t andT .
These variances were calcu- lated f o r several sizes of sire families, by varying the number of dams (d = 2,3,. . .
, 6 ) and the progeny per dam ( n = 2,3,. . .
, 3 0 or 150 or 300), depending on the individuals tested( N
= 120,600 or 1200)with
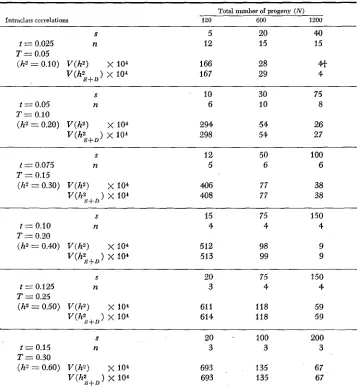
s = N / n d , to ascertain the structure yielding minimum-variance estimators for h2 for each of nine sets of intraclass correlations ( t and T ) corresponding to heritabilities ranging from0.10 to 0.90 (Table 1).
TABLE 1
The optimum structure of sires ( s ) , dams per sire (d := 2 ) and progeny per dam (n) to obtain minima of V(hs) for various number of progeny (N) and intraclass correlations (t and T)
Total number of progeny ( N )
Intraclass correlations 120 600 1200
S 5 20 40
t = 0.025 n 12 15 15
T = 0.05
(hZ = 0.10) V ( h 2 )
x
104 166 2841
v ( h ; + D ) x IO4 167 29 4
S
t = 0.05 n
T = 0.10
(hz = 0.20) v(h2) x 104
V ( h ; + , ) x IO4
10 30 75
6 10 8
294 54 26
298 54 27
12 5
406 408
50 100
6 6
77 38
77 38
S
t = 0.10 n
T = 0.20
(hz = 0.40) v(h2)
x
104V ( h : + D ) X lo4
15 75 150
4 4 4
512 98 9
513 99 9
S
t = 0.125 n
T = 0.25
(h* = 0.50) V ( h 2 )
x
104v(h;+,)
x
10420 75 150
3 4 4
61 1 118 59
614 118 59
~~
20 .
3
693 693
~
100
3
135 135
~~
200 3
WEIGHTED ESTIMATION O F HERITABILITY 421
TABLE 1-Continued
Total number of progeny ( N )
Intraclass correlations 120 600 1200
S 20 100 200
t = 0 1 7 5 n 3 3 3
(h2=0.70) V ( h 2 ) x 104 777 151 75
T = 0.35
"(h;+J
x
104 779 151 75S 30 150 300
t = 0.20 n 2 2 2
T = 0.40
(h2 = 0.80) v ( h 2 )
x
104 844 166 83~ ( h ; + ~ )
x
104 846 166 83S 30 150 300
t = 0.225 n 2 2 2
T = 0.45
(hz = 0.90) v ( h 2 )
x
104 890 175 87v(h"sD)
x
104 890 175 87t
The variances appear equal due to rounding, but in all cases V(h2) is less than V(h2 ).S4-D
The sampling variance of
hz
is a minimum as a function of sire family size( n d ) in all cases when two dams are mated to each side
( d
= 2). This may be unexpected unless one remembers that the objective of this study is to minimize the variance of a heritability estimate simultaneously based on sire and dam components within the constraints of the model (i.e., obtaining separate esti- mates of heritability from sire and dam components) so that 2 is the minimum admissible value for d . [Without this constraint, the most efficient (minimum variance) design for estimating the heritability based on the full-sib component can be shown to be pair matings ( d = l), which requires a different model.]The question then becomes one of determining the optimum number of prog- eny per dam ( n ) and of sires (s)
.
By inspection, the integer values of n and s that gave smallest approximate variance ofh'
define the optimum design. For a given number of individuals tested, e.g., 600, the necessary number of progeny per dam is greater for lower heritabilities ( n = 15 for h2 = 0.10) and decreases t o the minimum number for higher heritabilities ( n = 2 before h' 0.80),
as expected. Consequently, for traits with low heritability, emphasis should be on the size ( n ) of within-sire families, but for traits with high heritability, emphasis should be on the number of sire families (s).
The results were examined in more detail for two sets of intraclass correlations
With as few as 120 progeny, the square root of the variance (standard error)
of the heritability estimate is at least 57% and as much as 86
%
of the magni- tude of the heritability itself f o r these two sets of intraclass correlations. Prog- enies of 600 or 1200, structured to achieve near-minimum variance: are large enough that the expected value of the heritability estimate exceeds twice its standard error. If facilities can accommodate 1200 progeny, there might be some advalztage i n constructing two replicates (e.g., breeds) each of size 600,because little precision is gained by constructing a single replicate of size 1200. Although V ( h ' ) is less than V(h;,+, ), as expected, the difference i n these cases is small and may be unimportant. However, the information required to calculate the variances is the same: and i t appears that something is gained in estimating
h
'
and its variance.S I M U L A T I O N O F E S T I M A T O R S
In plant and animal breeding applications, interest lies in estimating herit- ability from the data themselves, usually by estimating the variance components
(U:
,
U;), a2 and e;, ) and using the ratios of t h p e variance component estimatesas estimators of heritability: h: = ~U;/U;, and h' 1) = 4;'
$-
j',. These are consistent, biased estimators and little is known about the properties ofi their distribution(HENDERSON 1978). The same can be said of the estimator h:+R= 2(2:,+
$tJ)/
$;, =?h
(fii
+
8;
) and the proposed estimator,.h2
=
+
GDhfJ,
both being linear functions of consistent, biased estimators. Thus, to understand better the behavior of these heritability estimators, a simulation study was conducted.Simulated data were computer-generated according to the model i n equation
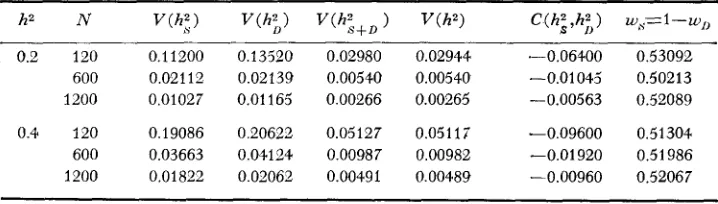
(1) f o r sample sizes 120, 600 and 1200, and heritabilities 0.20 and 0.40 by draw- ing pseudo-random deviates from normal, independent distributions with means zero and variances determined by the heritability parameter. Six parameter sets were generated, each based o n the optimum population structure determined in the previous section (see Table 1). The approximate variances, covariance and weights corresponding to the optimum designs are given f o r each parameter set
(Table 2).
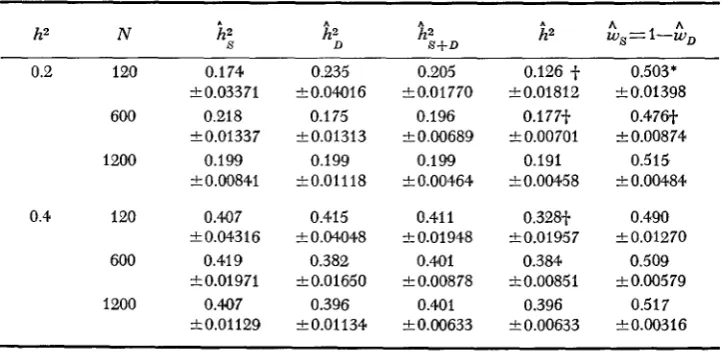
The means of 100 replicates for the sample estimates of the heritabilities and weights, and of the variances and covariance are presented in Tables 3 and 4,
A A
TABLE 2
Parametric values for the heritabilify, the uariances, covariance and the weights
h2 N C ( h i , h;) ) w,S= 1 - w,,
0.2 120 0,11200 0.13520 0.02980 0.02944 .-0.06400 0.53092 600 0,02112 0.02139 0.00540 0.00540 -0.01043' 0.50213 1200 0.01027 0.01165 0.00266 0.00265 -0.00563 0.52089
WEIGHTED ESTIMATION O F HERITABILITY 423
respectively. None of the mean estimates of
h i ,
hi
orhi+,
was significantly (all tests assumed normality) different from expectation. The mean estimates ofh', however, were significantly less than expectation at the lowest level of popu- lation size for both heritabilities and at
h'
=
0.20, N = 600.The sample estimates of the heritabilities are biased downwards. They are consistent, however, asymptotically approaching their parametric values as the sample size increased (GROSSMAN and NORTON 1980). The importance of the bias should be considered, especially with respect to the weighted heritability estimates, and k. If bias is important in causing the differences from ex- pectation seen in the estimate
hz,
nevertheless it did not affectIs.,,,
which was calculated from the same biased values andhi.
Thus, the differences of&
from expectation probably arise from another source, namely the weights. [Inthe THEORY section, the weights were treated as parameters and, hence, as if the
error in the weight is uncorrelated with the error in the heritability. However, the weights are random variables estimated from the data and the errors are correlated. Consequently,
hz
will be biased and its variance will only approxi- mate the minimum.]The mean weight was significantly less than expectation (Table 3) for two parameter sets,
hz
=
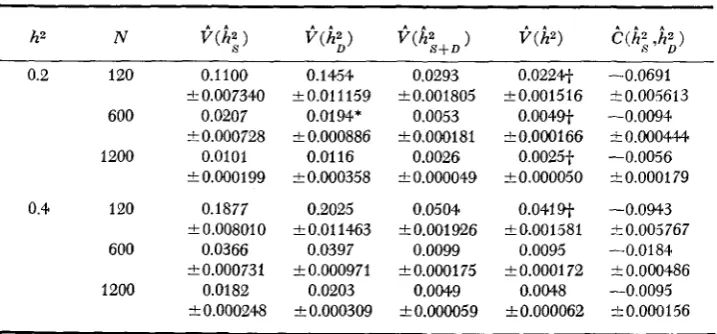
0.20, N = 120 and 600. The means of the sample estimates for the variances and covariance agreed reasonably with expectation (Table4).
However, for
V ( k ) ,
the means were different from expectation for all but two parameter sets.To study further the distributions of the heritability estimators, some prop- erties other than the means were considered. The maxima and minima of the sample estimates of the heritabilities demonstrated a lack of symmetry in their
TABLE 3
Means and standard errors for sample estimates of heritabilities and weights for each parameter set (df. = 99)
h2 N
R;
A %+D&,==I-h,
0.2 120 0.174
600 0.218
1200 0.199 k0.03371
-1-0.01337
k0.00841 0.4 120 0.40 7
600 0.41 9
1200 0.407 k 0.04316
t 0.01971
f0.01129
0.235 k0.04016
0.1 75
k 0.0 13 13 0.199 t0.01118
0.415
f 0.04048 0.382 a0.01660 0.396 0.01134 0.205 +0.01770 0.196
f 0.00689 0.199
f 0.00464 0.41 1
f 0.01948 0.401 k 0.00878
0.401 k0.00633
0.126 -f- k0.01812 0.177-f-
f 0.00701 0.191 t0.00458
0.328-f-
f 0.01957 0.384 f0.00851
0.396
+- 0.00633
0.503*
f 0.01398 0.476-t
a
0.00874 0.515 k 0.004840.490
t 0.01270 0.509
f 0.00579 0.517 k0.00316
* Significantly different from expectation at 5% level of probability.
TABLE 4
Means and standard errors for sample estimates of variances and covariance
for each parameter set (d.f.=99)
h2 N )
0.2 120 0.1100
600 0.0207
1200 0.0101
2 0.007340
F 0.000728
to.000199
0.4 120 0.1877
600 0.0366
1200 0.0182
i 0.008010
2 0.000731
tO.000248
0.1454 i0.011159
0.0194*
2 0.000886 0.01 16 20.000358
0.2025
2 0.01 1463 0.0397 iO.000971
0.0203
2 0.000309
0.0293 i0.001805
0.0053 i0.000181
0.0026
2 0.000049 0.0504
2 0.001 9-26 0.0099
& 0.0001 75 0.0049 20.000059
o.o224+ 20.001516
0.0049+ t0.000166
0.0025f
& 0.000050 0.041 sf
2 0.001581 0.0095
2 0.0001 72 0.004.8
*0.000062
-0.0691 rt0.005613
I0.000444 -0.0056
10.000179
-0.0943 -0.0094
kO.005767
50.000486
-t0.000156 -0.0184
-0.0095
* Significantly different from expectation at 5% level of probability.
+
Significantly different from expectation at 1 % level of probability.distribution. In addition, for
I$
and&
the actual proportions of negative herit- ability estimates were compared to their expected values for each parameterset
(GILL
and JENSEN 1968). No significant difference from expectation wasfound.
Finally, to gain a better understanding of the relationships among the herit- abilities and the weights, for each parameter set the correlation between the heritability estimates and and the correlations between the heritability estimates and their weights, i.e., between
hi
and fis, and between2;
and G D ,were calculated (Table
5 ) .
All correlations were negative and significantly dif- ferent from zero ( P<
0.0001). In each parameter set, the correlation betweenhi
and Gs was significantly(P
<
0.001) more negative than the correlation be- tweenhz,
and GD.TABLE 5
Correlations among sample estimates of heritabilities and weights for each parameter set (d.f. = 98)
A A A h A h
h2 N r ( h ; , h ; ) r(h;,w ,) r ( h z 9wD)
0.2 120 -0.55 -0.92 -0.63
600 -0.46 -0.95 -0.63
1200 -0.58 -0.97 -0.72
0.4 120 -0.57 -0.97 -0.60
600 -0.54 -0.99 -0.60
WEIGHTED ESTIMATION O F HERITABILITY
425
ITERATIVE ESTIMATIONIn practice, we estimate
V ( h i ) ,
V ( h i ) ,
andC
(&,hi
),
which are dependent on the heritability through the intraclass correlations, from data and use them to estimate ws, h2, andV
( h2).
Thus, an iterative procedure can be used to obtain estimates of h2. A starting value forw s
is used to calculate h2 from ( 2 ) for the zero round of iteration. This estimate is substituted into ( 8 ) - ( I O ) , which are then used to estimate ws from ( 5 ) , from (2), andV
(A2)
from (6). The processis repeated using the new value of ws. In this study, two starting values of W E
were tested, W S
=
i/z
andw s
CS, calculated from the data initially. I n addition,the heritability estimates &and
h i
used in (2) were as calculated from the data or, in cases where one or both initial estimates were outside the parameter range, constrained to zero or unity. Iteration was terminated when the absolute differ- ence in+
(A2)
between consecutive rounds was as little as 1%
of the3
(i2)
of the earlier round.In each parameter set, the average number of rounds of iteration required for convergence (Table 6) was less starting with
w s
=
i/z
than when starting withw s
=
GS, irrespective of whether the heritability estimates were constrained (C)or not constrained (NC) in each of the 100 replicates. However, the average number of rounds of iteration was similar for C and NC estimates, except when population size was small. The number
(NUM)
of replicates for a parameter set that required constraint forhi,
&
or both decreased as the heritability and popu- lation size increased. The iterative procedure starting with w s =i/z
was pre- ferred and chosen for further study of the heritabilities.TABLE 6
Means and standard errors for the number of rounds of iteration for ench starting value, with ( C ) or without ( N C ) constraints for each parameter set (d.f. = 99)
Number of rounds of iteration
Starting w,=% Starting w,=$,
hZ N NC C NC C NUM+
0.2 1
eo
600 1200
0.4 120
600 1200
2.7 kO.11
1.6
k 0.06
1.5
k0.05
2.0 1.4
.t 0.05 1.2
f 0.04
0.09
2.0
20.05
1.5
k 0.05
1.5 k0.05
1.7
rfr 0.04
1.4
k 0.05 1.2
3- 0.04
3.3 20.15
2.1
k0.09
1.8
k 0.06 2.5 50.12
1.6
& 0.07 1.3
2 0.05
2.7 73
2.1 16
1.8 2
2 0.09
f 0.08 e0.06
2.3 57
1.6 3
1.3 0
f0.10
f 0.07
k 0.05
+NUM is the number of replicates of a parameter set for which constraints were used on
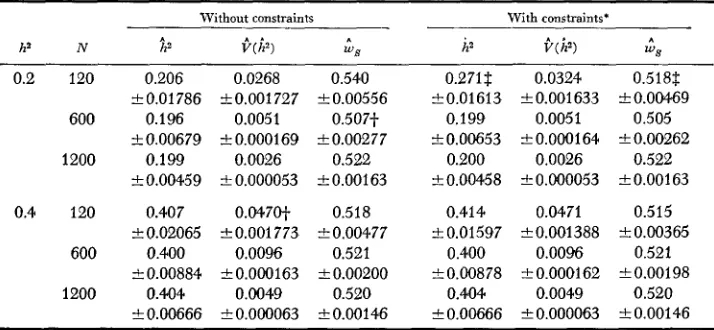
TABLE 7
Means and standard errors for iterative estimates of heritabilities, w i a n c e s and weights for starting ws,= for each parameter set (d.f. = 99)
ha N
0.2 120
600
1200
0.4 120
600
1200
Without constraints
ha
W )
W S0.206 0.0268 0.540 a0.01786 -t0.001727 k0.00556
0.196 0.0051 0.507-f +0.00679 -+ 0.000169 a0.00277
0.199 0.0026 0.522 k0.00459 10.000053 a0.00163
0.407 0.047O-f 0.518
-+ 0.02065 f 0.001 773 10.00477 0.400 0.0096 0.521 k0.00884 f O.OoO163 f 0.00200
0.404 0.0049 0.520
k 0.00666 I O.OoO063
a
0.00146With constraints.
h a i.(i9
0.271$ 0.0324 10.01613 k0.001633
0.199 0.0051
f 0.00653 f O.OOO164 0.200 0.0026
rt 0.00458 IZ! O.oO0053
0.414 0.0471 10.01597 a0.001388
0.400 0.00% L0.00878 +0.000162
0.404 0.0049
f 0.00666 -+ 0.000063
W S
0.518$
a
0.00469 0.505k 0.00262 0.522 a0.00163
0.515 k0.00365
0.521 t0.00198
0.520 k0.00146
* No constraint required for parameter set h2 = 0.4, N = 1200.
j. Significantly different from parametric value (Table 2) at 5% level of probability. 5: Significantly different from parametric value (Table 2) a t 1% level of probability.
Iterative estimates of
h2, V ( h 2 )
and w s starting withw s
= were calculated with and without constraints for each parameter set (Table 7 ) . I n only one casewas the estimate of heritability significantly different from expectation for the parameter set with lowest heritability and population size. Constraining the estimates of heritability is preferred when population size is small.
W e thank MARY ELLEN BOCK for her valuable suggestions i n the preparation of this paper, and SUWAT RATTANARONCHART for his assistance in computer programming.
L I T E R A T U R E C I T E D
DICKERSON, G. E., 1969 Techniques f o r research in quantitative animal genetics. pp. 36-79. In:
Techniques awl Procedures in Animal Science Research. American Society of Animal Sci- ence. Albany, N.Y. 12210.
FALCONER, D. S., 1960
GILL, 1. L. and E. L. JENSEN, 1968 Probability of obtaining negative estimates of heritability. Biometrics 24: 517-526.
GROSSMAN, M. and H. W. NORTON, 1980 Approximate intrinsic bias in estimates of heritability based on variance component analysis. J. Heredity 71 : 295-297.
HENDERSON, C. R., 1978 Simulation to examine distributions of estimators of variances and ratios of variances. J. Dairy Sci. 61 : 267-273.
HILL, W. G. and F. W. NICHOLAS, 1974 Estimation of heritability by both regression of offspring on parent and intra-class correlation of sibs in one experiment. Biometrics 30: 447-468.
OSBORNE, R. and W. S . B. PATERSON, 1952 On the sampling variance of heritability estimates derived from variance analyses. Proc. Roy. Soc. Edin. 64: 456-461.
ROBERTSON, A, 1959 Experimental design in the evaluation of genetic parameters. Biometrics 1 5 : 219-226.