Transactions of the 17th International Conference on Structural Mechanics in Reactor Technology (SMiRT 17) Prague, Czech Republic, August 17 –22, 2003
Paper # K15-1
BNL Nonlinear Pre-Test Seismic Analysis for the NUPEC Ultimate Strength
Piping Test Program
G. DeGrassi1), C. Hofmayer1), A. Murphy2), K. Suzuki3), Y. Namita3)
1) Brookhaven National Laboratory, Upton, New York 11973-5000, USA 2) U.S. Nuclear Regulatory Commission, Washington, D.C. 20555-0001, USA 3) Nuclear Power Engineering Corporation, Tokyo, Japan
ABSTRACT
The Nuclear Power Engineering Corporation (NUPEC) of Japan has been conducting a multi-year research program to investigate the behavior of nuclear power plant piping systems under large seismic loads. The program has involved a series of material, piping component and piping system tests. As part of collaborative efforts between the United States and Japan on seismic issues, the US Nuclear Regulatory Commission (USNRC) and its contractor, the Brookhaven National Laboratory (BNL), are participating in this research program by performing pre-test and post-test analyses, and by evaluating the significance of the program results with regard to safety margins. This paper describes BNL’s pre-test analysis to predict the elasto-plastic response for one of NUPEC’s simplified piping system seismic tests. The capability to simulate the anticipated ratcheting response of the system was of particular interest. Analyses were performed using classical bilinear and multilinear kinematic hardening models as well as a nonlinear kinematic hardening model. Comparisons of analysis results for each plasticity model against test results for a static cycling elbow component test and for a simplified piping system seismic test are presented in the paper.
KEY WORDS: piping analysis, strain ratcheting, cyclic plasticity, elasto-plastic analysis, kinematic hardening, seismic analysis, seismic testing.
INTRODUCTION
Under the Ultimate Strength Piping Test Program [1,2], NUPEC has conducted a series of material, piping component, and piping system tests to investigate the behavior of nuclear power plant piping systems under large seismic loads. A major goal of the program is to provide a better understanding of the elasto-plastic response and ultimate strength of piping systems under dynamic loads in order to assess the design margins provided by current and proposed piping design code rules. As part of a cooperative program between NUPEC and the USNRC, BNL has been participating as a collaborator. BNL’s contributions to this program include performance of pre-test and post-test analyses on selected tests, and evaluation of program results. This paper discusses the BNL pre-test analysis to predict the elasto-plastic seismic test response of a two-dimensional simplified piping system. The original BNL pre-test analysis was performed as a blind prediction analysis which used the anticipated table input acceleration time histories provided by NUPEC. However, upon initiation of the test program, NUPEC determined that the specimen damping was lower than anticipated and revised the input motion. Therefore the original pretest analysis results were never compared to test. The revised input for the simplified piping tests were subsequently provided to BNL along with the test results. Utilizing a similar methodology, BNL repeated the pretest analysis using the revised input and damping values. This paper presents the results of the revised pretest analysis and compares them to the final test results.
NUPEC TEST PROGRAM
A major objective of the NUPEC Ultimate Strength Piping Test Program [1,2] is the performance of a seismic proving test of a representative large-scale piping system. The proving test is to include (1) a design confirmation test to demonstrate the structural integrity of the piping system under design level and beyond design level seismic loads; and (2) an ultimate strength test which will subject a modified piping system to failure under higher level seismic loads. In order to gain a better understanding of the piping behavior prior to performing the proving test, NUPEC conducted a series of material, piping component and two- and three-dimensional simplified piping system tests. The tests were designed with the expectation that prior to failure, a piping system subjected to large seismic loads will experience significant strain ratcheting and fail as a result of accumulated fatigue damage.
static cycling test of an elbow specimen. The piping components were typically pressurized to their design pressures, and were instrumented to provide data on load-deflection and strain ratcheting behavior.
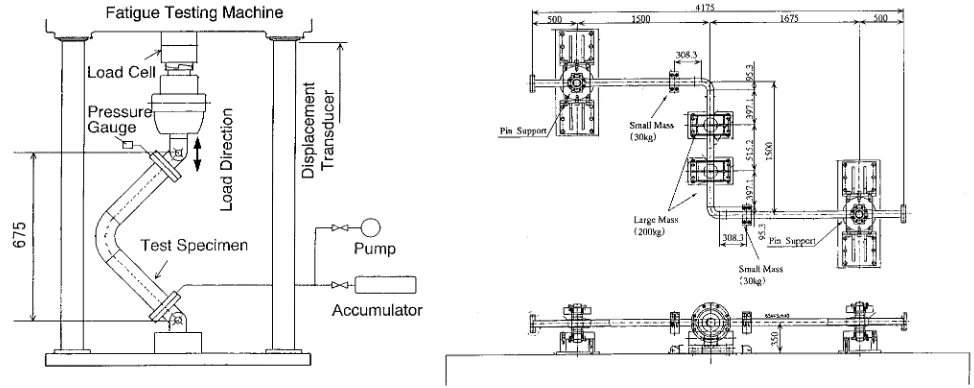
Figure 1 Static Elbow Cycling Test Setup Figure 2 Model A Simplified Piping System Test Setup
NUPEC also conducted a series of “simplified piping system” shaking table tests. These tests involved two-dimensional test specimens (Model A) subjected to single direction seismic loading and three-two-dimensional specimens (Model B) subjected to two-directional seismic loading. The Model A test specimen consisted of three straight pipe runs connected by two long radius elbows in the configuration shown in Figure 2. The pipe was 65A (2-½ inch) Schedule 40 carbon steel grade JIS STS410. The system was supported at two locations by specially designed ball bearing pinned supports. The piping system was pressurized to 19.8 MPa to induce a pressure stress equal to Sm. Two 200 kg weights
and two 30 kg weights were clamped to the pipe to provide the desired dynamic characteristics for the system. Rollers provided vertical support for the larger weights. The system was instrumented with accelerometers, strain gages, and displacement sensors at critical locations. Model B was a three-dimensional version of this system which included the same horizontal piping plus a tee, a vertical riser, an elbow and another horizontal straight run terminating at a nozzle. Spring hangers supported the weight of the pipe and the roller supports were removed. For each specimen type, a series of tests were conducted to investigate variations in seismic response considering different load levels, frequency input, boundary conditions, and materials. In nearly all tests, the seismic input excitation was of sufficient magnitude to induce elasto-plastic response in the components.
ANALYSIS MODEL AND METHODOLOGY
BNL performed analyses to simulate the seismic response of the NUPEC simplified piping tests. This paper describes the pre-test analysis for the two-dimensional (Model A) simplified piping system. The ANSYS finite element analysis program [3] was selected for this study. An important consideration behind the selection of this program was its recently incorporated capability to apply a nonlinear kinematic hardening model for cyclic plasticity based on the work of Chaboche [4]. This methodology, which is described below, was expected to provide a more accurate representation of strain-ratcheting behavior than is possible using classical linear kinematic hardening models.
Time history analyses were performed for two test runs of this two-dimensional configuration identified as tests A-1 and A-2. In both tests, the test specimen was subjected to seismic excitation in the horizontal x-direction. Peak acceleration levels were 0.7 g for test A-1 and 1.5 g for test A-2. Both load levels were designed to induce plasticity in the piping elbows. The frequency contents of the seismic excitation waves were tuned to be close to the piping system fundamental frequency, which was approximately 2 Hz. The analyses were conducted using the ANSYS nonlinear full transient analysis option which utilizes the Newton-Raphson iteration procedure and the Newmark time integration method to solve the nonlinear equations of motion. An internal pressure of 19.8 MPa was applied to the system. System damping was defined in terms of Rayleigh damping coefficients corresponding to 1.8% modal damping determined from low-level tests.
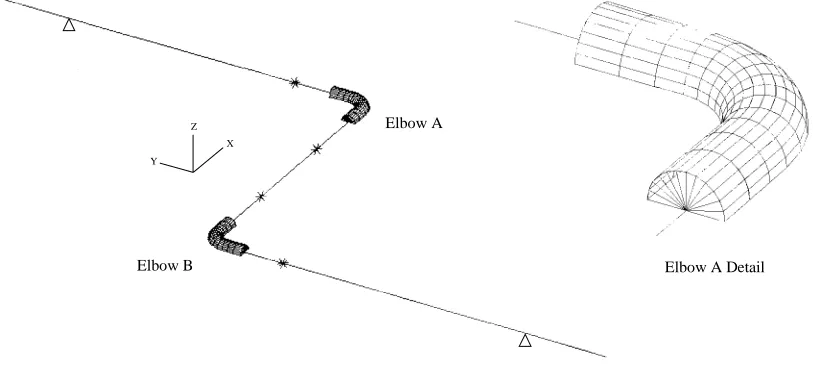
Elbow A
Elbow B Elbow A Detail
Figure 3 ANSYS Model of Two-Dimensional Simplified Piping System Test Specimen (Model A)
Y Z
X
Parametric studies were conducted to investigate and validate the adequacy of the finite element mesh size, the integration time step and the convergence criteria. Studies were also performed to investigate the significance of large deformation effects. These studies showed that the changes in geometric configuration due to elbow ovalization would have a small effect on the elbow stiffness and strain distribution. However, in the anticipated range of this application, this effect was judged to be insignificant. Additional studies to further investigate the range of applicability of this assumption may be conducted under the post-test analysis program. The selection of a cyclic plastic hardening model to simulate the anticipated ratcheting response of the system was a primary focus of this analysis. Using test data from the NUPEC material and component tests, a series of analytical studies were performed to investigate and compare three different models.
PLASTICITY MODELS
A plastic hardening rule describes the relationship between the subsequent yield stress of a material and the plastic deformation accumulated during prior plastic loadings. The kinematic hardening rule assumes that the
difference between yield stresses under tension and compression loadings remains constant. Under plastic deformation, the elastic domain will retain a constant size but will move about in the stress space by translation. This translation can be characterized in terms of the location of the center of its elastic domain or yield surface, which is also referred to as a backstress. The linear kinematic hardening rule, which was introduced by Prager [5], assumes that the center of the yield surface moves linearly with plastic strain. For the simple case of uniaxial loading, this rule is expressed by the following incremental equation:
(1)
p 0
x C dε
dα =
where αx is the center of the yield surface (axial backstress), εp is the plastic axial strain, and C0 is a material constant
equal to the plastic modulus. The total stress during plastic flow is expressed as follows:
0 x
x α σ
σ = ± (2)
where σx is the total axial stress and σ0 is the yield stress, and the sign is dependent on the direction of plastic flow. The
stress-strain curve is represented by a bilinear curve. The first slope represents the elastic modulus up to the yield stress, and the second slope represents a linear plastic modulus. When a material is loaded into the plastic range and subsequently unloaded, the reverse path follows the elastic slope back to a range of twice the yield stress and then follows the plastic slope. The ANSYS program also provides a multilinear kinematic hardening (MKIN) option based on the Besseling multilayer model [6]. When this rule is applied, the stress-strain curve is represented by several linear segments. This allows for a more accurate representation of a stress-strain curve. Under reversed loading, the load path again follows the elastic slope back to twice the yield stress and then follows the path of the multiple plastic slopes. However, using either rule, the plastic modulus is always the same for loading and unloading and is unaffected by the presence of a mean stress. As a result, for a prescribed uniaxial stress cycle with a mean stress, the loading and reversed loading hyteresis curves will always produce a closed loop with no ratcheting.
Armstrong and Frederick [7] introduced a nonlinear kinematic hardening rule with a “recall” term which introduced a fading memory effect of the strain path. For the case of uniaxial tension-compression loading, the translation of the yield surface is expressed by the following incremental equation:
p x p
x Cd d
dα = ε −γα ε (3)
where C and γ are material dependent constants. In applying this rule, the plastic modulus, H, is expressed by the following equation:
x
C
H = mγα (4)
In this equation, the negative sign is used for the forward loading curve and the positive sign is used for the reverse loading curve. This rule provides an exponential plastic modulus. For a uniaxial stress cycle with mean stress, this rule produces changes in shape between forward and reverse loading paths. Therefore the loop does not close and ratcheting occurs. A disadvantage of this model, however, is that an experimental stress-strain curve is not necessarily exponential in nature and an attempt to simulate it by a single exponential equation does not yield a good fit. In addition, for a high strain range, the model does not produce a constant plastic modulus as exhibited in experiments, but will instead always stabilize to a zero plastic modulus.
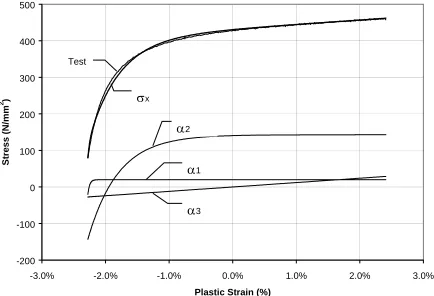
The nonlinear kinematic hardening model proposed by Chaboche [4] is a superposition of several “decomposed” Armstrong-Frederick hardening rules. In order to improve the simulation of the hysteresis loop, Chaboche suggested the superposition of three hardening rules. The first rule (α1) should simulate the initial high plastic modulus at the onset of
yielding; the second rule (α2) should simulate the transient nonlinear portion of the curve; and the third rule (α3) should
be a linear hardening rule (γ3 = 0) to represent the subsequent linear part of the hysteresis curve at a high strain range.
As is the case for the single Armstrong-Frederick rule, for a uniaxial stress cycle with mean stress, the rule will also produce a change in shape between the forward and reverse loading paths which results in ratcheting. However, because of the incorporation of the linear kinematic hardening rule (α3), this model will eventually approach the
complete shakedown of ratcheting which is not in agreement with experimental results. The ratcheting simulation can be improved by assigning a small value to γ3, which introduces a slight nonlinearity which will improve the ratcheting
simulation without producing a noticeable change in the hysteresis loop. The Chaboche nonlinear kinematic hardening model is included as an option (CHAB) in the ANSYS program. The procedure for defining the parameters is
explained below.
DETERMINATION OF MATERIAL PARAMETERS
The pre-test analyses investigated the seismic responses for the two-dimensional (Model A) simplified piping system test using the three different plastic hardening models described above. The NUPEC material tests provided the basic material parameters needed for each model as described below.
Bilinear Kinematic Hardening Model
The stress-strain curve from a monotonic uniaxial tensile test of an STS410 carbon steel test specimen was used to define the parameters for the bilinear kinematic hardening (BKIN) model. The parameters included modulus of elasticity, yield stress, and plastic modulus. Consistent with the theory, the plastic modulus was assumed to be constant and was approximated from the slope of the stress-strain curve from the yield strain to 3 percent strain as shown in Figure 4. The values used for this model were 203000 MPa for the elastic modulus, 1220 MPa for the plastic modulus, and 270 MPa for the yield stress.
Multilinear Kinematic Hardening Model
Chaboche Nonlinear Hardening Model
The Chaboche (CHAB) model required the definition of elastic modulus, yield stress, and the Ci and γi constants
for each of the three Armstrong-Frederick hardening rules. A procedure for determination of the C and γ parameters was described by Bari and Hassan [8]. All parameters, except for γ3, were determined from the stress-strain hysteresis
Figure 4 BKIN and MKIN Model Stress-Strain Curves Figure 5 Uniaxial Cycling Test Hysteresis Curves
0 50 100 150 200 250 300 350 400 450 500
0.00 0.50 1.00 1.50 2.00 2.50 3.00
Strain (%)
S
tress (N/
m
m
2)
Monotonic Test BKIN Model Cyclic Test MKIN Model
-600 -400 -200 0 200 400 600
-3.00 -2.00 -1.00 0.00 1.00 2.00 3.00
Strain (%)
S
tress (N/
m
m
2)
curves generated from a strain-controlled uniaxial strain cycling test of an STS410 carbon steel test specimen shown in Figure 5. The procedure specifies that the decomposed backstress terms (α1 or α2) should start from –Ci/γi at the starting
plastic strain –εpl and reach a value of Ci/γi at the final plastic strain εpl. The third linear backstress term should go
through the origin. The equations used for the loading part of the hysteresis curve are as follows:
∑ (5)
=
+
= 3
1
i i
0
x σ α
σ
[
{
i(
p(
pl)
)
}
]
i i
i 1 2exp
C
ε ε γ γ
α = − − − − , for i = 1 and 2 (6)
α3 =C3εp (7)
where εpl is the strain limit of the stable hysteresis loop. The procedure first required the selection of a hysteresis loading
curve with a reasonably large strain range. The yield stress and yield strain were then estimated from the curve and the curve was adjusted for elastic strain to produce a stress versus plastic strain plot. Using the above equations, the Ci and
γi parameters were selected to match this test curve. A spreadsheet program was used to compare the loading part of the
hysteresis test curve to the σx curve from Eq. (5). The C3 parameter was first selected to match the slope of the linear
segment of the hysteresis curve at a high strain range. The C1 parameter was next selected as a large value such that the
slope of α1 nearly matched the plastic modulus at initial yielding, and the corresponding γ1 value was also a large value
to stabilize the hardening of α1 immediately. The C2 and γ2 parameters were selected by trial and error to match the
Figure 7 ANSYS Model of Static Elbow Test Specimen Figure 6 CHAB Model Stress-Strain Curve
-200 -100 0 100 200 300 400 500
-3.0% -2.0% -1.0% 0.0% 1.0% 2.0% 3.0%
Plastic Strain (%)
S
tress (N/
m
m
2) σx
Test
α2
α1
overall shape of the curve. Additional adjustments to C1 and γ1 were then made to match the initial slope of the test
curve as well as the stress at both the start and end points. Figure 6 illustrates the contribution of each rule to the simulation of the stress-strain curve. As suggested in [8], the final parameter, γ3, may be determined from a uniaxial
ratcheting test to provide a best fit. However, for this analysis effort, this parameter was determined from the results of an elbow component test strain cycling test as described below. The parameters determined for the pre-test simulation analyses using the Chaboche nonlinear hardening model were as follows: σ0 = 270 MPa, E =203000 MPa, C1 = 70000
MPa, C2 = 30000 MPa, C3 = 1200 MPa, γ1 = 3500, γ2 = 210, γ3 =1.
ELBOW STATIC CYCLING TEST ANALYSES
As a preliminary test of the ANSYS shell element elbow model and to define the γ3 parameter needed for the
Chaboche model, a shell element model of the elbow used in the NUPEC static elbow component cycling load test was developed. The elbow test specimen shown in Figure 1 was modeled in a similar manner as the elbows of the Model A simplified piping system (Figure 3). The model, which is shown in Figure 7, includes SHELL181 elements and rigid beam elements. Due to symmetry about two planes, a ¼ model with appropriate symmetry boundary conditions was used. An internal pressure of 19.8 MPa was applied and equivalent cyclic test end displacements of ±15.5 mm were imposed statically for 185 cycles. The analysis was repeated for each of the three plastic hardening rules.
0 2 4 6 8 10 12 14 16 18
0 20 40 60 80 100 120 140 160 180 200
Cycle (N)
Hoop S
trai
n
(
%
)
γ3 = 0
γ3 = 1
γ3 = 2
0 2 4 6 8 10 12 14 16 18
0 20 40 60 80 100 120 140 160 180 200
Cycle (N)
Hoop S
trai
n
(
%
)
0 2 4 6 8 10 12 14 16 18
0 20 40 60 80 100 120 140 160 180 200
Cycle (N)
Hoop S
trai
n
(
%
)
0 2 4 6 8 10 12 14 16 18
0 20 40 60 80 100 120 140 160 180 200
Cycle (N)
Hoop S
trai
n
(
%
)
(a) Test (b) BKIN Model
(c) MKIN Model (d) CHAB Model
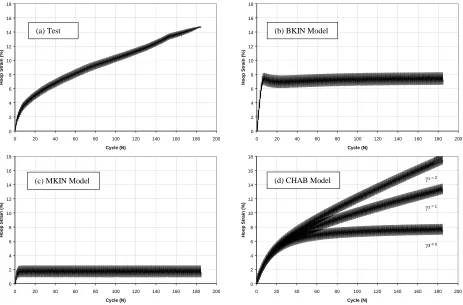
Figure 8 Elbow Static Cycling Test Hoop Strain vs. Cycle at Elbow Flank
In the test, the elbow was cycled until crack penetration occurred at the flank at 185 cycles. The strain versus cycle history measured at the elbow flank outer surface is shown in Figure 8a. As indicated, the rate of strain ratcheting was highest during the initial cycling but then leveled off and continued at a nearly constant rate. The fatigue crack developed at an accumulated hoop strain of about 15 percent. The corresponding strain histories predicted by analysis using the three plastic hardening models are shown in Figures 8b, 8c,and 8d. The BKIN model overpredicted initial strain ratcheting and achieved shakedown in the first ten cycles with 8 percent accumulated strain. The MKIN model predicted shakedown in the first 5 cycles with a strain accumulation of only 2 percent. The CHAB model with γ3 = 0
exhibited closer initial strain ratcheting behavior compared to test. However, it also approached shakedown, although at a slower rate than predicted by the linear hardening models. Two additional analyses were performed using the CHAB model with γ3 values equal to 1 and 2. As shown in Figure 8d, a value of γ3 = 1 provided the best match to test and was
MODEL A SIMPLIFIED PIPING SYSTEM SEISMIC ANALYSES
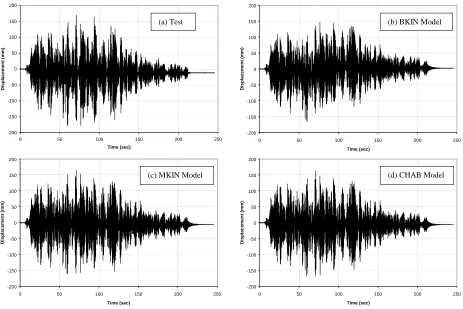
Following the analytical approach described above, a seismic analysis was performed using each of the three plastic hardening models. The test and analysis results for the high level seismic test A-2 are presented in Figures 9 and 10 as time history plots of large mass displacement and Elbow “A” flank hoop strain. Test measurements indicated peak displacements of +170/ –178 mm with permanent deformation of –12 mm at end of test. Corresponding analysis results are +146/-166 mm and +2 mm permanent deformation for the BKIN model; +165/-161 mm and –6 mm permanent deformation for the MKIN model; and +162/-167 mm and –6 mm permanent deformation for the CHAB model. An examination of the time history traces shows that the CHAB model most closely matches the test, although the MKIN model also produces a reasonably good match.
-200 -150 -100 -50 0 50 100 150 200
0 50 100 150 200 250
Time (sec)
Di
spl
acement (mm)
-200 -150 -100 -50 0 50 100 150 200
0 50 100 150 200 250
Time (sec)
Di
spl
acement (mm)
-200 -150 -100 -50 0 50 100 150 200
0 50 100 150 200 250
Time (sec)
Di
spl
acement (mm)
-200 -150 -100 -50 0 50 100 150 200
0 50 100 150 200 250
Time (sec)
Di
spl
acement (mm)
(a) Test (b) BKIN Model
(c) MKIN Model (d) CHAB Model
Figure 9 A-2 Test – Displacement at Large Mass
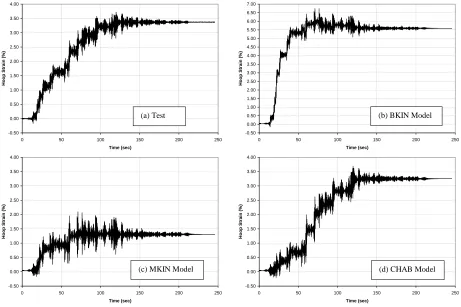
A comparison of the strain results shown in Figure 10 shows more significant differences in strain ratcheting behavior between the different analysis model results. The test results show that the hoop strain in the Elbow A flank exhibited strain ratcheting during the first 125 seconds of motion, and by the end of test had an accumulated permanent strain of 3.35%. The BKIN model overpredicted the strain ratcheting with shakedown occurring at about 75 seconds, and ended with a permanent strain of 5.6%. The MKIN model also exhibited strain ratcheting during the first 75 seconds but underpredicted the response with a permanent strain of 1.3 %. The CHAB model initially underpredicted the test strain ratcheting response during the first 50 seconds of motion but continued ratcheting for the first 125 seconds and predicted an accumulated strain of 3.25% by the end of the test. An examination of the time history traces shows that the CHAB model provides the closest match to test results.
CONCLUSION
A series of pretest analyses to predict the elasto-plastic seismic response of a simplified two-dimensional piping system tested on a large shaking table as part of the NUPEC Ultimate Strength Piping Test Program have been completed. Three different analyses were performed to test three different plasticity models. The first model used the bilinear kinematic hardening rule proposed by Prager [5] with material parameters based on a stress-strain curve from a monotonic uniaxial tension test. The second model used the multilinear kinematic hardening rule proposed by
performance of the nonlinear model versus the two linear models, particularly with regard to predicting the strain ratcheting behavior of the system. Both linear models predicted shakedown sooner than observed during the test. The bilinear kinematic hardening model overpredicted the accumulated permanent strain at end of test, while the multilinear kinematic hardening model underpredicted the accumulated strain. These differences, however, are most likely due to the differences in the stress strain curves used to represent the models instead of the differences between the two linear plastic hardening rules. The nonlinear model produced the best match to test results in terms of predicting both the accumulated strain and the overall ratcheting behavior and shakedown versus time. On the basis of these results, the Chaboche nonlinear hardening model will be applied to predict the behavior of the three-dimensional simplified piping system test under the post-test analysis phase of the BNL effort.
-0.50 0.00 0.50 1.00 1.50 2.00 2.50 3.00 3.50 4.00
0 50 100 150 200 250
Time (sec) H oop Strai n (% ) -0.50 0.00 0.50 1.00 1.50 2.00 2.50 3.00 3.50 4.00
0 50 100 150 200 250
Time (sec) H oop Strai n (% ) -0.50 0.00 0.50 1.00 1.50 2.00 2.50 3.00 3.50 4.00 4.50 5.00 5.50 6.00 6.50 7.00
0 50 100 150 200 250
Time (sec) H o o p St ra in ( %) -0.50 0.00 0.50 1.00 1.50 2.00 2.50 3.00 3.50 4.00
0 50 100 150 200 250
Time (sec) H o o p St ra in ( %)
(a) Test (b) BKIN Model
(c) MKIN Model (d) CHAB Model
Figure 10 A-2 Test – Hoop Strain at Elbow Flank
REFERENCES
1. K. Suzuki, et al., Seismic Proving Test of Ultimate Piping Strength, ICONE-9, Paper No. 155, 2001. 2. K. Suzuki, et al., Seismic Proving Test of Ultimate Piping Strength, ICONE-10, Paper No. 22225, 2002. 3. ANSYS, User’s Manual, Release 5.6., ANSYS Inc., Canonsburg, PA 15317, U.S.A.
4. Chaboche, J.L., Time Independent Constitutive Theories for Cyclic Plasticity, International Journal of Plasticity, Vol. 2, pp. 149-188, 1986.
5. Prager, W., A New Method of Analyzing Stresses and Strains in Work Hardening Plastic Solids, Journal of Applied Mechanics, Vol. 23, pp. 493-496, 1956.
6. Besseling, J.F., A Theory of Elastic, Plastic and Creep Deformations of an Initially Isotropic Material, Journal of Applied Mechanics, Vol. 25, pp. 529-536, 1958.
7. Armstrong, P.J. and Frederick, C.O., A Mathematical Representation of the Multiaxial Bauschinger Effect, CEGB Report No. RD/B/N 731, 1966.
8. Bari, S. and Hassan, T., Anatomy of Coupled Constitutive Models for Ratcheting Simulations, International Journal of Plasticity, Vol. 16, pp. 381-409, 2000.