Event reconstruction of free-streaming data for the RICH
detector in the CBM experiment
J. Adamczewski-Musch1, P. Akishin7, K.-H. Becker2, J. Bendarouach3, C. Deveaux3, M. Dürr3, J. Eschke1, J. Förtsch2, J. Heep3, C. Höhne3,1, D. Ivanishchev4, K.-H. Kampert2, L. Kochenda4,5, P. Kravtsov4,5, I. Kres2, S. Lebedev3,7,∗, E. Lebedeva3, S. Linev1,T. Mahmoud3,M. Malaev4,5,J. Michel6,N. Miftakhov4,W. Niebur1,J.-H. Otto3, E. Ovcharenko3,7,V. Patel2,C. Pauly2,D. Pfeifer2,Y. Riabov4,E. Roshchin4,V. Samsonov4,5,8, O. Tarasenkova4,M. Traxler1,D. Tyts4,M. Vznuzdaev4,A.A. Weber3, andP. Zumbruch1 1GSI Helmholtzzentrum für Schwerionenforschung GmbH, D-64291 Darmstadt, Germany 2Department of Physics, University of Wuppertal, D-42097 Wuppertal, Germany
3Institute of Physics II and Institute of Applied Physics, Justus Liebig University Giessen, D-35392
Giessen, Germany
4National Research Centre "Kurchatov Institute" B.P.Konstantinov Petersburg Nuclear Physics Institute,
188300 Gatchina, Russia
5National Research Nuclear University MEPhI (Moscow Engineering Physics Institute), 115409,
Moscow, Russia
6Institut für Kernphysik, Göthe University Frankfurt, D-60438 Frankfurt am Main, Germany
7Laboratory of Information Technologies, Joint Institute for Nuclear research (JINR-LIT), Dubna,
Rus-sia
8St. Petersburg Polytechnic University (SPbPU), St. Petersburg, Russia
Abstract.The Compressed Baryonic Matter (CBM) experiment is a dedicated heavy ion collision experiment at the FAIR facility. It will be one of the first HEP experiments which works in a triggerless mode: data received in the DAQ from the detectors will not be associated with events by a hardware trigger any-more. All raw data within a given time period will be collected continuously in containers, so-called time-slices. The task of the reconstruction algorithms is to create events out of this raw data stream. In this contribution, the optimization of the reconstruction software in the RICH detector to the free-streaming data flow is presented. The implementation of ring reconstruction algorithms which use time measurements of the hits as an additional parameter is discussed.
1 The Compressed Baryonic Matter (CBM) experiment
The Compressed Baryonic Matter (CBM) experiment at the future FAIR facility will investi-gate the phase diagram of strongly interacting matter at high net-baryon density and moderate temperature in proton-proton and nucleus-nucleus collisions. The SIS100 synchrotron will provide proton beam with energies up to 29 GeV and up to 11 AGeV for the heaviest nuclei. The beam extracted to the CBM cave reaches intensities up to 109Auions per second.
One key item of the CBM physics program is the precise measurement of electromag-netic radiation by reconstructing low-mass vector mesons andJ/ψvia the di-electron decay
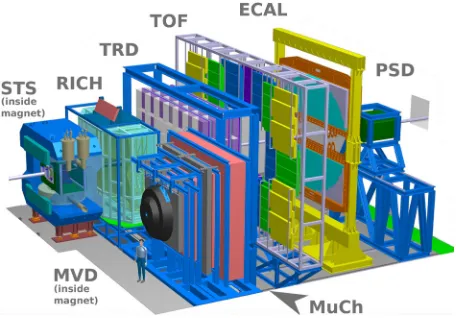
channel. This measurement requires efficient and clean electron identification, and in partic-ulare/πseparation, in wide acceptance. Electron identification and suppression of pions will be performed by a Ring Imaging Cherenkov detector (RICH) in combination with several Transition Radiation detectors (TRD) which are both positioned behind the Silicon Tracking System (STS). Figure 1 shows a sketch of the CBM detector setup. A detailed overview of the CBM physics program is given in [1].
Figure 1. Sketch of the CBM experimental setup. From left to right: Micro-vertex Detector (MVD) and Silicon Tracking System (STS) inside a dipole magnet, Ring Imaging Cherenkov (RICH) detec-tor, Transition Radiation Detectors (TRD), Time-of-flight wall (TOF), Electromagnetic CALorimeter (ECAL) and Projectile Spectator Detector (PSD). The muon detector (MUCH) is shown in its parking position; it can be interchanged with the RICH detector.
2 Ring Imaging CHerenkov (RICH) detector
The RICH detector (see Figure 2) is designed to provide electron identification covering the momentum range up to 8 GeV/c. It is split into two identical symmetrical parts below and above the beam pipe with two spherical mirror planes and two photon detector planes. CO2 gas at 2 mbar overpressure (γthr.=33, pthr.=4.65 GeV/c) is used as radiator. Each of the two mirror planes consists of 40 spherical mirror tiles with 3 m radius of curvature and spectral reflectivity down to the UV range (Al+MgF2 reflective coating). The Cherenkov photons are detected using two photon detector planes≈2×0.6m2 each, together equipped with about 1000 Hamamatsu H12700 Multianode Photomultiplier tubes. They are placed inside iron shielding boxes in order to reduce the magnetic stray field (aim at<1 mT at the photocathode). Beam test results with a real-size length RICH prototype showed that around 25 photons are detected per electron ring. A detailed technical description of the CBM RICH can be found in the Technical Design Report [2], and in [3–7].
channel. This measurement requires efficient and clean electron identification, and in
partic-ulare/πseparation, in wide acceptance. Electron identification and suppression of pions will be performed by a Ring Imaging Cherenkov detector (RICH) in combination with several Transition Radiation detectors (TRD) which are both positioned behind the Silicon Tracking System (STS). Figure 1 shows a sketch of the CBM detector setup. A detailed overview of the CBM physics program is given in [1].
Figure 1. Sketch of the CBM experimental setup. From left to right: Micro-vertex Detector (MVD) and Silicon Tracking System (STS) inside a dipole magnet, Ring Imaging Cherenkov (RICH) detec-tor, Transition Radiation Detectors (TRD), Time-of-flight wall (TOF), Electromagnetic CALorimeter (ECAL) and Projectile Spectator Detector (PSD). The muon detector (MUCH) is shown in its parking position; it can be interchanged with the RICH detector.
2 Ring Imaging CHerenkov (RICH) detector
The RICH detector (see Figure 2) is designed to provide electron identification covering the momentum range up to 8 GeV/c. It is split into two identical symmetrical parts below
and above the beam pipe with two spherical mirror planes and two photon detector planes.
CO2 gas at 2 mbar overpressure (γthr.=33, pthr.=4.65 GeV/c) is used as radiator. Each of the two mirror planes consists of 40 spherical mirror tiles with 3 m radius of curvature and spectral reflectivity down to the UV range (Al+MgF2 reflective coating). The Cherenkov
photons are detected using two photon detector planes≈2×0.6m2 each, together equipped
with about 1000 Hamamatsu H12700 Multianode Photomultiplier tubes. They are placed inside iron shielding boxes in order to reduce the magnetic stray field (aim at<1 mT at the
photocathode). Beam test results with a real-size length RICH prototype showed that around 25 photons are detected per electron ring. A detailed technical description of the CBM RICH can be found in the Technical Design Report [2], and in [3–7].
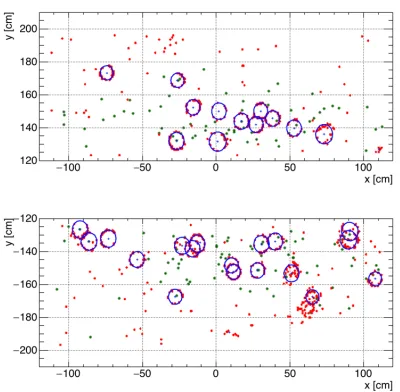
Figure 3 shows an example of a typical response of the RICH detector to a centralAu
-Aucollision at 8 AGeV beam energy. Around 25 rings per event are registered which gives about 630 hits per event on average. The most significant fraction of recorded photons in the RICH stems frome±fromγ-conversions in the STS detector or the magnet yoke (17 rings
per event).
Figure 2.Left: The mechanical design of the RICH detector. Right: The RICH detector in the CBM-ROOTframework simulation (support structure is not shown). The Cherenkov photons emitted by an electron are shown in orange color. They are reflected by the mirror (green) onto the photon detector plane (red).
Figure 3.Simulation of a typical response of the RICH detector to a centralAu-Aucollision at 8 AGeV beam energy. Blue circles: reconstructed rings; red points: RICH hits including noisy channels; green markers: reconstructed track projections onto the photon detector plane.
3 Free streaming data
different collisions may overlap in time. All raw data within a given time period are collected continuously in containers, so-called slices. The reconstruction algorithms take time-slices as input data.
Figure 4.Left: distribution of times between two neighboring events. Right: distribution of the number of RICH hits in time for two overlapping events. Red and blue colors correspond to two different events;
light blue color corresponds to noise hits.
In the simulation the start time of an individual event is generated using the Poisson process. The left plot of Figure 4 shows the distribution of the times between two neighboring events for 10 MHz interaction rate. About 10% of collisions happen within a 10 ns interval which results in overlapping events in time. The right plot of Figure 4 shows the distribution of hit times for two overlapping events in the RICH detector.
A time stamp of a RICH hit is the sum of the event time, the time of flight from the collision point to the detector, and a measurement error of the detector. For the Cherenkov photons originating from signale±the time of flight until the photon detector plane equals to around 19 ns and is almost the same for all photons. The time resolution of the photon detector was obtained after several lab and in beam tests and is expected to be less then 1 ns. In the simulation each RICH hit time is smeared according to a Gaussian distribution with σ=1 ns.
The dark rate is one of the sources of noise hits in the RICH detector. In the simulation the dark noise of individual pixels is set to 1 kHz which is rather on the large side as seen from the measurements [8]. One can see these noise hits (light blue color) in the right plot of Figure 4. The event correlated noise depends on the event multiplicity. The pixel dead time is set to 50 ns.
Figure 5 shows the initial distribution of RICH hits in time for Au-Auminimum bias collisions at 8 AGeV beam energy assuming 10 MHz interaction rate. This is only a part of a time-slice with about 100 events.
4 Ring reconstruction algorithm
The developed ring recognition algorithm is an updated version of the algorithm which works in the event-by-event mode without the usage of time information [9–14]. The updated algo-rithm is also standalone and uses only RICH hit information (X,Y and time measurements) as input. No track information is used.
different collisions may overlap in time. All raw data within a given time period are collected
continuously in containers, so-called slices. The reconstruction algorithms take time-slices as input data.
Figure 4.Left: distribution of times between two neighboring events. Right: distribution of the number of RICH hits in time for two overlapping events. Red and blue colors correspond to two different events; light blue color corresponds to noise hits.
In the simulation the start time of an individual event is generated using the Poisson process. The left plot of Figure 4 shows the distribution of the times between two neighboring events for 10 MHz interaction rate. About 10% of collisions happen within a 10 ns interval which results in overlapping events in time. The right plot of Figure 4 shows the distribution of hit times for two overlapping events in the RICH detector.
A time stamp of a RICH hit is the sum of the event time, the time of flight from the collision point to the detector, and a measurement error of the detector. For the Cherenkov photons originating from signale± the time of flight until the photon detector plane equals
to around 19 ns and is almost the same for all photons. The time resolution of the photon detector was obtained after several lab and in beam tests and is expected to be less then 1 ns. In the simulation each RICH hit time is smeared according to a Gaussian distribution with σ=1 ns.
The dark rate is one of the sources of noise hits in the RICH detector. In the simulation the dark noise of individual pixels is set to 1 kHz which is rather on the large side as seen from the measurements [8]. One can see these noise hits (light blue color) in the right plot of Figure 4. The event correlated noise depends on the event multiplicity. The pixel dead time is set to 50 ns.
Figure 5 shows the initial distribution of RICH hits in time for Au-Auminimum bias collisions at 8 AGeV beam energy assuming 10 MHz interaction rate. This is only a part of a time-slice with about 100 events.
4 Ring reconstruction algorithm
The developed ring recognition algorithm is an updated version of the algorithm which works in the event-by-event mode without the usage of time information [9–14]. The updated algo-rithm is also standalone and uses only RICH hit information (X,Y and time measurements) as input. No track information is used.
The ring reconstruction begins with the ring-candidate search which is based on the Hough Transform where hit triplets are combined, and the corresponding ring parameters
Figure 5. Distribution of the number of RICH hits in time for a part of a time-slice with about 100
Au-Auminimum bias collisions at 8 AGeV beam energy assuming 10 MHz interaction rate. Top: All events are shown in red color. Bottom: Each color corresponds to an individual event. Light blue color corresponds to the noise hits.
are calculated. Instead of combining all possible hit triplets in the whole photon detector plane, only hits within a predefined local area around the initial hit are selected and addition-ally only hits within 3σ(detector time resolution: 1 ns) time window are selected. The time window value is a reasoned assumption because the difference in time of flight of photons
from one ring is negligible in comparison to the detector time resolution. Thus the triplets are built only for a small fraction of selected hits which makes the whole procedure very fast. For each triplet the corresponding ring parameters (X,Y,R) are calculated and Hough histograms are filled. Analyzing the peaks in histograms one either accepts ring-candidate or rejects them.
The next step is to filter the ring-candidate array and reject all fake ring-candidates which are formed by random combinations of hits. For each ring a quality value is derived by an artificial neural network from 6 input parameters: number of hits in the ring, ring radius,χ2 of the circle fit, ring position on the photon detector plane, uniformity of the hit distribution around the ring, and the number of hits in a small corridor around the ring fit. Then the following rule is applied: the ring-candidate is rejected if it shares more than 25% of its hits with a better quality ring.
For all found rings the time measurement is calculated as the average time of all hits belonging to the ring.
5 Results
All results presented in this section are based on simulation studies performed for Au-Au
minimum bias collisions from the Ultrarelativistic Quantum Molecular Dynamics model (UrQMD) [15] at 8 AGeV beam energy assuming 10 MHz interaction rate. In order to en-hance statistics and investigate the RICH response to primary electrons, 5e+and 5e−were
embedded into each UrQMD event at the primary vertex.
Figure 6.Distribution of the number of RICH hits (red) in time and the number of reconstructed rings (blue) in time. Only a part of a time-slice is shown. Simulation: Au-Auminimum bias collisions at 8 AGeV beam energy, 10 MHz interaction rate.
Figure 7 shows the ring reconstruction efficiency for primarye±in dependence on
mo-mentum (left plot) and in dependence on track multiplicity in an event (right plot). Results are presented for rings from primarye±with at least 7 detected photons and rings from for
so-called primary referencee±which have more than 15 detected photons in the ring. The ring
reconstruction efficiency integrated over the momentum range from 0 – 12 GeV/c is 96.5%
for primarye±and 97.7% for the reference set. The corresponding number of fake rings is
around 1%.
Figure 7.Left: Ring reconstruction efficiency for primarye±(red circle) and primary referencee±(blue square) in dependence on momentum. Right: Ring reconstruction efficiency for primarye±in depen-dence on track multiplicity (number of Monte-Carlo tracks in event). Simulation:Au-Auminimum bias collisions at 8 AGeV beam energy, 10 MHz interaction rate.
Figure 8 shows the ring reconstruction efficiency for primarye± in dependence on the
interaction rate. The performance of the ring reconstruction algorithm does not depend on the interaction rate and is the same as the event-by-event reconstruction performance.
Figure 6.Distribution of the number of RICH hits (red) in time and the number of reconstructed rings (blue) in time. Only a part of a time-slice is shown. Simulation: Au-Auminimum bias collisions at 8 AGeV beam energy, 10 MHz interaction rate.
Figure 7 shows the ring reconstruction efficiency for primarye±in dependence on
mo-mentum (left plot) and in dependence on track multiplicity in an event (right plot). Results are presented for rings from primarye±with at least 7 detected photons and rings from for
so-called primary referencee±which have more than 15 detected photons in the ring. The ring
reconstruction efficiency integrated over the momentum range from 0 – 12 GeV/c is 96.5%
for primarye±and 97.7% for the reference set. The corresponding number of fake rings is
around 1%.
Figure 7.Left: Ring reconstruction efficiency for primarye±(red circle) and primary referencee±(blue square) in dependence on momentum. Right: Ring reconstruction efficiency for primarye±in depen-dence on track multiplicity (number of Monte-Carlo tracks in event). Simulation:Au-Auminimum bias collisions at 8 AGeV beam energy, 10 MHz interaction rate.
Figure 8 shows the ring reconstruction efficiency for primarye±in dependence on the
interaction rate. The performance of the ring reconstruction algorithm does not depend on the interaction rate and is the same as the event-by-event reconstruction performance.
To summarize, the time-based reconstruction for the RICH detector were developed and showed good performance in the simulation studies. The first test on a real data is expected for the mCBM experiment setup in 2019.
Figure 8. Ring reconstruction efficiency for primarye±in dependence on interaction rate. "Zero" interaction rate corresponds to the event-by-event mode. Simulation: Au-Auminimum bias collisions at 8 AGeV beam energy.
Acknowledgments
This work was supported by the Hessian LOEWE initiative through the Helmholtz In-ternational Center for FAIR (HIC for FAIR), by the Helmholtz Graduate School for Hadron and Ion Research, by the GSI F&E-Cooperations with Giessen and Wupper-tal (WKAMPE1012), by BMBF Grants 05P12RGFCG, 05P12PXFCE, 05P09PXFC5, 05P15PXFCA, and 05P15RGFCA, by Helmholtz Grant IK-RU-002, by SCROSATOM through FRRC, and by the Ministry of Education and Science of the Russian Federation (grant no. 14.A12.31.0002) in accordance with the Russian Federation Government Regula-tion no. 220.
References
[1] B. Friman, et al., (Eds.),The CBM Physics Book: Compressed Baryonic Matter in
Lab-oratory Experiments(Springer Series: Lecture Notes in Physics, vol.814, 2011)
[2] C. Höhne (Ed.) et al., CBM-RICH Technical Design Report, GSI-2014-00528, http://repository.gsi.de/record/65526.
[3] C. Hoehne et al. NIM A595187 (2008) [4] C. Hoehne et al. NIM A639294 (2011)
[5] J. Adamczewski-Musch et al. NIM A766101 (2014) [6] J. Adamczewski-Musch et al. NIM A87665-68 (2017) [7] J. Adamczewski-Musch et al. NIM A845434–438 (2017) [8] J. Adamczewski-Musch et al. NIM A876123–125 (2017) [9] S. Lebedev et al, J. Phys.: Conf. Series219032015 (2010) [10] S. Lebedev et al, J. Phys.: Conf. Series396022029 (2012) [11] S. Lebedev et al, PoS ACAT2010 060 (2010)
[12] J. Adamczewski-Musch et al. NIM A766250 (2014)
[13] G. Ososkov and N. Chernov, Comp. Phys. Comm.33329-333 (1984) [14] N. Chernov, J. Math. Im. Vi.27231-239 (2007)