be considered carefully in planning use of crested wheatgrass.
Literature Cited
ARNOLD, J. F. AND H. G. REYNOLDS. 1943. Droppings of the Arizona and Antelope jackrabbits and the “pellet” census. J. Wildl. Manage. 7:322-327.
BLEAK, A. T. AND W. G. MILLER. 1955. Sagebrush seed- ling production as related to time of mechanical eradica- tion. J. Range Manage. 8:66-69.
CLARKE, J. F. G. 1942. Notes and new species of micro- lepidoptera from Washington state. Proc. U.S. Nat. Museum 92: 273-274.
CLOWARD, W. J., AND D. S. FULWIDER. 1955. An approach to cooperative range management. J. Range Manage. 8:7-8.
COOK, C. W., L. A. STODDART, AND F. E. KINSINGER. 1958. Responses of crested wheatgrass to various clipping treatments. Ecol. Monographs 28:237-272.
ECKERT, R. E., JR., A. T. BLEAK, AND J. H. ROBERTSON. 1961. Effects of macro- and micro-nutrients on the yield of crested wheatgrass. J. Range Manage. 14: 149-155. FRISCHKNECHT, N. C., AND L. E. HARRIS. 1968. Grazing
intensities and systems on crested wheatgrass in central Utah: Response of vegetation and cattle. U.S. Dep. Agr., Tech. Bull. 1388.
Curing Standing Range Forage
with Herbicides1
BURGESS L. KAY AND DONALD T. TORELLZ
Specialist, Department of Agronomy and Range Science; and Specialist, Department of Animal Science,
University of California, Davis.
Highlight
Paraquat applied to standing annual range forage at anthesis of the grasses resulted in standing hay 57 to 77% higher in protein. Crude fiber was decreased and phos- phorus increased. Forage production was generally lower with treatment, because the growing season was shorter. Palatability of dry forage was improved. Lambs on treated forage gained more rapidly. No physiological or patho- logical changes were found in the lambs. Spraying resulted in less grass and more clover in the year following spraying.
The forage picture on ranges of cismontane Cali- fornia is normally one of feast or famine. During l Received April 24, 1969; accepted for publication July 14,
1969.
2We thank Mr. Joe Ruckman, Department of Agronomy and Range Science, and John Bryan, Department of Animal Science, both of the University of California, for help in making the many laboratory analyses; Chevron Chemical Co., for paraquat and diquat and financial sup- port; and David D. Sharp, B. D. Robinson, Peter D. Lawler, and William Stonebridge, of Plant Protection Limited, Imperial Chemical Industries, England and Australia, for reading the manuscript.
FRISCHKNECHT, N. C., AND A. P. PLUMMER. 1949. A simpli- fied technique for determining herbage production on range and pasture lands. Agron. J. 41:63-65.
HEINZE, D. H. 1964. The response of herbaceous species to different grazing management schemes on crested wheatgrass seedings. M.S. thesis, Univ. of Nevada, Reno. HOWARD, W. E. AND H. E. CHILDS, JR. 1959. Ecology of
pocket gophers with emphasis on Thomomys bottae mewa. Hilgardia 29:277-385.
HYDER, D. N. AND F. A. SNEVA. 1954. A method for rating the success of range seeding. J. Range Manage. 7:89-90. PARKER, K. W. 1951. A method for measuring trend in
range condition on National Forest ranges. Forest Serv., U.S. Dep. Agr., Washington, D.C.
PEARSE, KENNETH. 1935. An area-list method of mea- suring range plant populations. Ecology 16: 573-579. STEEL, R. G. D., AND H. H. TORRIE. 1960. Principles and
procedures of statistics. McGraw-Hill Book Co., New York.
STEINBRENNER, E. C. 1959. A portable air permeameter for forest soils. Soil Sci. Sot. Am. Proc. 23:478-481. U.S. DEPT. OF AGRICULTURE. 1960. Soil classification-A
comprehensive system-Seventh Approximation. Soil Conserv. Serv., Wash., D.C. 265 p.
WEAVER, J. E., AND R. W. DARLAND. 1947. A method of measuring vigor of range grasses. Ecology 28: 146-162.
much of the year forage is of low quality although these lands are generally productive, producing dry matter of 1,000 to 6,000 lb/acre. The vegeta- tion is made up almost entirely of annual. species of grasses, legumes, and forbs. These plants make most of their growth in a short spring period and then mature and die as days lengthen, temperatures rise, and the moisture supply is abruptly cut off. Total digestible nutrients reach a peak during maximum vegetative growth and decline as the forage matures. Protein and phosphorus decline soon after maturity (Guilbert et al., 1944). Protein is generally more acutely deficient than phos- phorus. Wagnon et al. (1942) showed that, with- out supplements, all classes of cattle lost weight soon after the first of July, regardless of forage abundance. Van Dyne (1965a,b) showed that an- nual grass protein varied from 2.2 to 3.5% in August, and that fistula samples from cows and sheep declined from 9.5% protein in early summer to 6.9y0 in late summer.
Nitrogen loss began at flowering in soft chess (Bromus mollis L.) and continued until senescence, whereas losses in subclover (Trifolium subter- raneum L.) began after seed setting in Australia.” Nitrogen loss was mainly from the herbage, and was probably lost by volatilization to the air. Frank
CURING STANDING FORAGE 35
Table 1. Production (lb/acre) and chemical composition (5%) by dates of sample of mowed and paraquat treated vege- tation in year of treatment and following year.
Treatment
Control (no treatment) Paraquat-treated 4/29
Paraquat-treated 5/ 12 hlowed 5/ 12
LSD .05 .o 1
Forage yield 6/24
3650 3410 3450 3340 NS
-
Crude fiber
6/24 9/16
32.0 30.0 27.2 26.8 29.9 28.8 30.1 28.6 1.1 1.5 1.6 2.2
Year of treatment
Ash Lignin
6/24 9/16 6/24 9/16
10.3 13.1 10.8 9.8 12.1 11.5 11.8 11.1 11.2 13.0 11.4 10.8 8.6 13.8 10.7 10.1 NS NS 0.6 0.4 - - 0.8 0.6
Protein
6/24 9/16
8.9 8.0 14.9 13.0 13.9 12.1 13.9 12.6 2.3 1.9 3.2 2.8
One year later
Silica- Silica- free free fib-e protein - ___
5/25 5/25
29.2 9.3 25.1 12.1
25.4 11.1 28.6 9.8 2.1 1.8 3.0 2.6
(1954) also suggested that nitrogen could be lost directly to the air.
Sneva (1967) suggested applying the herbicide paraquat (l, l’-dimethyl-4,4’-bipyridinium ion) at anthesis to arrest the redistribution of nutrients in the herbage portion of range grasses during curing. Spraying paraquat at concentrations as low as 0.2 lb/acre on crested wheatgrass (Agropyron desertorum (Fish. ex Link Schult.)) arrested the decline of protein, phosphorus (P), potassium (K), and calcium (Ca) in dry summers. In wet summers, however, the decline of P, K, and Ca was greater in paraquat-treated forage.
The studies reported here were made to test the use of paraquat, diquat(6,7_dihydrodipyrido [1,2-a: Z’, 1’-clpyrazinediium ion), and cacodylic acid (hydroxydimethylarsine oxide) on the annual vegetation of cismontane California to evaluate nutrient retention. Most of the work was at the University of California Hopland Field Station, at an elevation of 800 ft in the North Coastal Range of California, with an annual rainfall of 35 inches. An additional plant study was made about 100 miles east, at the U. C. Sierra Foothill Range Field Station, at an elevation of 640 ft, in the foothills of the Sierra Nevada, with a rainfall of 39.41 inches in the year of the trial.
Since this study consists of a number of different trials with both plants and animals over a period of four years, each of these trials is considered separately. The methods, results, and discussion are presented with each trial.
Mowing vs. Spraying Subclover
Forage from a subclover pasture sprayed with paraquat at 2 lb/acre at two dates is compared with unsprayed forage and forage mowed on the second spraying date. Paraquat was applied in 63 gpa total volume, with X-77 added as surfactant at the rate of 0.09% vol/vol. The siclebar mowed forage was left as it fell in the field.
Dominant pasture species were 40yo Mt. Barker
subclover, 19% foxtail fescue (Festuca megalura Nutt. or Vulpia megalura Rydb.), 12% soft chess, and 8% wild barley (Hordeum Zeporinum Link.).
At the first spraying date, April 29, subclover was in full bloom and soft chess was in the dough stage. At the second spraying date, May 12 (also the mowing date), subclover and soft chess were still green whereas fescue was % brown.
Forage samples were clipped to ground level (3 ft” from each treatment in all 4 replications) on June 24 and September 16. Samples were oven- dried and forage yield determined. Each was analyzed for Kjeldahl nitrogen, lignin, ether ex- tract, total ash, and crude fiber. The plots were sampled again a year later, on May 25, and yields, nitrogen, and crude fiber were determined on a silica-free basis. Pasture composition was deter- mined by the step-point method (Evans and Love,
1957) at spraying and, again, a year later.
Protein content (nitrogen x 6.25) was increased
significantly by both spraying treatments and by mowing (from 8.88% on the check to 13.88-14.94yo on the treatments) (Table l), with no significant difference between spraying and mowing. Protein retention between the two sample dates was similar, with all treatments losing about 10% of the re- tained protein in the 12-week period. Crude fiber was reduced from 32% on the check to 27-30% on the treatments. Lignin, however, increased in both spraying treatments but not in the mowed.
Species composition differed strikingly a year after treatment (Fig. 1). The spraying treatments prevented grass seed production, which reduced grass density the following year. The reduction in grass was accompanied by an increase in sub- clover. Subclover in the sprayed treatments was nearly double that in the mowed or check treat- ments.
90 -
IO -
o-
‘0°
c
-
7 / / / -s ~
Check
MOWMay
lower in the sprayed treatments, hut not in the mowed.
Grass seed production was probably arrested by both the spraying and mowing treatments, yet reduction in grass was far greater with spraying. T,his may he due to the greater efticiency of spray- ing treatments in arresting seed development. However, Warhoys and Ledson (1965) showed that paraquat residues on mulch reduce emergence. Paraquat residues were measured on old mulch in some studies reported elsewhere in this paper. Whether these residues were great enough to pre- vent emergence is not known.
Grass reduction did not always result in legume increase. In experiments where leg-umes were initially few in number, the reduction in grass density encouraged invasion of weedy broadleaf annuals--especially coast tiddleneck (Amsinckia intermedia F 8c M). In adjacent spraying trials grazed by sheep, however, legumes dominated.
Paraquat on Resident Range
ICx@Gnent I.--Small plots of resident range (10 x 15 ft) were sprayed with paraquat (1 lb/ acre) plus X-77 (0.1% vol/vol) at 64 gpa on May
::,.,: ;;-,.
10, 1965 (Fig. 2). The 10 plots treated ranged in elevation tram 550 ft to 2900 ft. Average species composition was 777” annual grass, 8% resident annual clovers, and 150/, miscellaneous annual forbs. Soft chess, the most abundant grass, varied in maturity from hard dough and 100% green, at the highest elevation, to % brown, at the lowest clcvation. The plots, plus an adjacent unsprayed area of equal size, were fenced immediately after spraying.
Forage yields were measured at spraying and at approxmately monthly intervals after spraying. Three square feet were clipped to ground level in each treatment and check at each date and oven- drird hefore weighing. Samples were analyzed for Kieldahl nitrogen, crude fiber, silica, ash, and ether extract.
Forage yields declined significantly as the sea- son progressed, hut no difference was found he- twwn sprayed and unsprayed treatments. The forage began to shatter after the July sample, making It increasingly difficult to pick up the sample. Yields averaged 2,660 lb/acre at the time of sprayin.g, in May, and 1,700 lb in the final clipping, m October. Ratliff and Heady (1962) found a lesser decline in forage yield-107, from July through August.
Protein content of the fora.gc before spraying varied from 122.5V ,“, at the h@est elevation, to 6.94% at the lowest, because of differences in ma- turity (Table 2). Protein content decreased sig- nificantly between spraying and the first sample, on July 15. llnsprayed plots lost 500/, of their protein, whereas the paraquat-sprayed plots lost only 1 l%,. Neither treatment lost significantly more during the period July 15 to October 18.
CURING STANDING FORAGE 37
Table 2. Chemical composition (%) of forage sprayed with paraquat compared with unsprayed. Data are means of ten replications calculated on a silica-free basis.
l)atc
May 10 (date
Protein Crude fiber Ether extract
Para- Para- Para-
Check quat Check quat Check quat
of spraying) 9.0 9.0 28.0 28.0 2.25 2.25 WY 15 4.5 8.0 31.2 27.6 1.68 1.42 Aug. 17 4.2 7.8 35.3 31.9 1.64 1.32 Sept. 7 4.3 7.4 34.7 32.1 1.55 1.35 Oct. 18 4.1 7.4 35.2 33.1 1.62 1.43
LSD1 .05 0.8 0.9 0.12
.Ol 1.0 1.3 0.16
1 For differences between curing treatments for the same date or for differences among dates for different curing treatments.
was higher in the unsprayed plots and at the final clipping, on October 18: 35.23%, compared with 33.09% in the sprayed samples.
Ether extract (as a measure of fat) was slightly higher in the unsprayed plots. No further decline in ether extract was noted after July 15 in either treatment.
Experiment Z.-An experiment at the Sierra Station in the spring of 1966 was planned to evaluate paraquat applications of 0, X6, l/s, ?4, ?!2, 1, and 2 lb/acre. Before any treatments were applied, however, the vegetation matured and dried abruptly because of wind and high temperatures. The site was mowed after maturity, and the plant material removed.
The following season’s growth was allowed to remain ungrazed, which resulted in an essentially all-grass sward consisting of approximately 80% soft chess, 15% annual ryegrass (Lolium multi- florum Lam.), and 5% slender wild oats (Arena barbata Brot.). A split-plot design was used to allow spraying at three different stages of maturity. The first spraying date was April 24, at which time the grasses were all headed but at the pre-anthesis stage. They were a solid sward (100% ground cover) about 14 inches high. The second spraying date was May 8, when all grasses were in anthesis and 24 inches high. The third spray was never applied, because grasses matured quite suddenly after the second treatment.
On both spraying dates cacodylic acid was tested at rates of 0, 2, 4, and 8 lb/acre in an adjacent experiment of similar design.
The herbicides were applied in a total volume of 84 gpa, with X-77 at 0.1% vol/vol in the para- quat solution but none in the cacodylic acid. The sky was overcast on the first application, and clear on the second.
In an effort to improve forecasts of maturity date, soil moisture was measured with gypsum
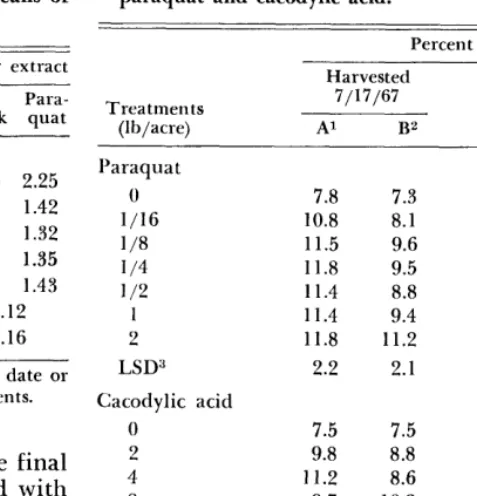
Table 3. Protein content of annual grasses treated with paraquat and cacodylic acid.
Percent protein
Harvested Harvested
Treatments (lb/acre)
7/17/67 9/l 8/67
Al B2 A B
Yaraquat 0 l/16 l/8 l/4 l/2
2 LSD”
Cacodylic acid 0
2
8 LSD”
7.8 7.3 8.0 8.3
10.8 8.1 10.8 8.7
11.5 9.6 11.1 9.9
11.8 9.5 11.4 10.0
11.4 8.8 11.4 9.5
11.4 9.4 12.2 10.8 11.8 11.2 10.2 9.6
2.2 2.1 1.9 NS
7.5 7.5 9.8 8.8 11.2 8.6 9.7 10.2 2.2 1.4
1 A, sprayed April 24, 1967. 2 B, sprayed May 8, 1967.
:+ Least significant difference at .05 level.
electrical-resistance blocks at depths of 6, 12, 18, 24, and 30 inches. Forage samples were collected on both spraying dates and again on July 17 and September 14, and analyzed for protein.
Protein content at the spraying dates was re- spectively 8.6 and 9.5%. These values were re- duced to 8.0 and 8.3 by the final harvest, more than three months after maturity (Table 3). This small reduction was apparently due to the abrupt termination of the growing season, which served to cure the green plants in a very short period. The grass was nearly all brown 10 days after anthesis. In most other studies, protein in un- sprayed grasses declined to 3-5yo by the end of summer.
Because of this high protein retention by un- sprayed forage, differences due to spraying were less than in the other experiments. Percent pro- tein was significantly greater in many treatments with both paraquat and cacodylic acid. Protein values were nearly always greater in forage sprayed at the earlier date. Paraquat at %6 lb/acre was enough to produce an increase in protein at the first date, whereas I/s lb/acre was required at the later date. With cacodylic acid, 2 lb/acre was sufficient at the first date whereas 8 lb/acre was required at the second.
tein content, with the result that unsprayed areas sometimes exceeded sprayed treatments in pounds of protein produced per acre. Thus, protein pro- duction per acre was not increased significantly by spray treatments. Increased consumption of sprayed forage noted in the other trials may result in an increase in utilized protein following spray- ing.
Although I/l6 lb/ acre was enough to retain pro- tein at the earlier spraying date, plants were only about 30% brown in this treatment, compared with 80% from 2.0 lb/acre observed four days after spraying. At least M lb/acre was required to produce a 50% browning.
Protein retention was not affected by 1.85 inches of rain falling between the second spraying and first harvest.
Forage maturation to the brown stage seems well correlated with soil moisture in the top 12 inches of soil. The plants were nearly all brown on May 18, at which time soil moisture had reached the permanent wilting point at both the 6- and 1 Z-inch depths. At the 1% and 30-inch depths, however, considerable moisture remained for another 5 to 8 days. Thus, soil moisture in the top foot plays a part in determining when the grasses dry. Maximum temperatures during this period were in the 90’s (OF), which was also important in effecting the rapid maturity.
Ground-cover reduction varied in the season after spraying. Thirty days after germination, re- duction was more than 90% in treatments of ti lb/acre or more of paraquat at the early date and ?$ lb/acre or more at the second spraying date. With cacodylic acid, reduction was 100% from only 2 lb/acre. Some reduction in ground cover was probably due to destruction of the previous season’s seed crop. Large quantities of seed are known to carry over from year to year, however, so loss of one year’s seed should not produce the great reduction in ground cover noted here. The presence of growth inhibitors in the straw of soft chess, shown by Greenwood and Kimber (1967), could be a factor. Also the possibility of herbicide residues on the plant material should be con- sidered.
Cover reduction might not have been as drastic if the plant material (i.e., growth inhibitors or herbicide residue) had been removed by grazing, or if subclover had been present. Also, this situa- tion would provide an excellent opportunity to establish more productive species, such as sub- clover and hardinggrass
(Phalaris tuberosa
L. var.stenoptera
(Hack.) Hitchc.).Paraquat vs. Diquat Rates
Paraquat and diquat were applied logarith- mically (Yates et al., 1960) to a sward of 60%
- Paraquat
--- Oiquaf
j’
c
Oct. I8
Sept. 8
July 15
Sept.
8
July 15
Oct. 18
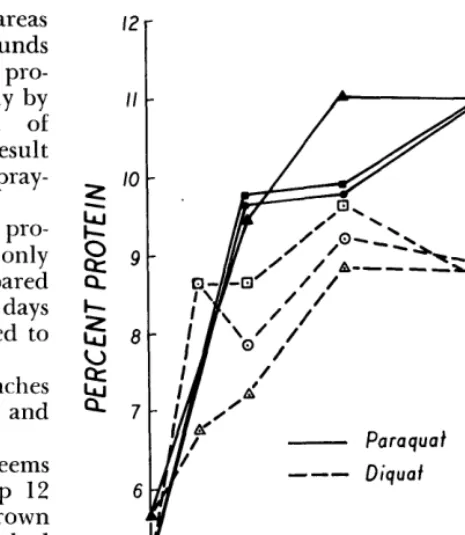
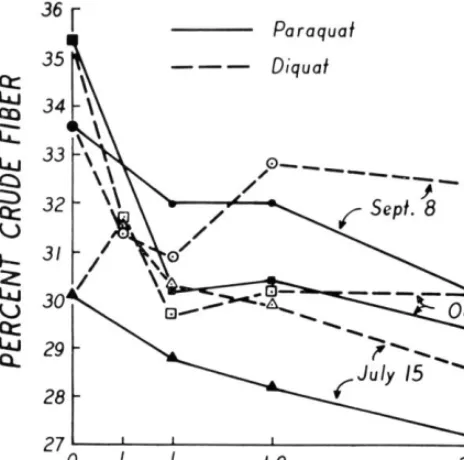
FIG. 3. Effect of paraquat and forage.
diquat on the protein content of
soft chess, 14% foxtail fescue, 4yo clover, and 22”/, miscellaneous annual forbs. Soft chess was in the hard dough stage, all green, and fescue was starting to dry. Spray applications started at 2 lb/acre for each herbicide and were applied at 84 gpa. X-77 was applied in both the concentrate and diluent, at 0.1% vol/vol. Application was at 4:30 p.m. on May 11, at a temperature of 80 F. Paraquat was applied as paraquat dimethylsulfate and diquat as diquat dibromide.
The four replications were sampled on July 14, September 8, and October 18; samples were analyzed separately for protein and crude fiber. Results appear in figures 3 and 4. Either paraquat or diquat at 1/2 lb/acre was sufficient to cause pro- tein retention. Protein values were 9.4-l 1.2% with paraquat, 7.5-9.4% with diquat, and 5.0-5.6% in the unsprayed forage. There was no significant difference between sample dates.
Crude fiber in the unsprayed forage increased from 30.1% on July 14 to 35.3yo on October 18. This probably represents a loss by shattering of plant parts lowest in fiber.
CURING STANDING FORAGE 39 36
r
Poraquof --- Diquaf
18
Total phosphorus was increased by paraquat from 0.213% in the check to an average of 0.33870 for the three treatments (Table 4). Phosphorus values were similar for all rates of paraquat. Phos- phorns declined throughout the season in both the check and paraquat-treated forage until there was no significant difference, at the end of the season.
Potassium and calcium were not affected significantly by spraying. Potassium declined markedly through the summer, whereas calcium remained unchanged or increased slightly.
Grazing Trials
Three separate grazing trials were conducted on paraquat-cured forage at the Hopland Field Sta- tion. Sheep were used in all trials.
Table 4. Percent of phosphorus, potassium, and calcium content of forage treated with various rates of paraquat at 3 sampling dates.
Treatme”ta Phosp'torur Potassium Calcium
(lb/acre) X/F 9,s 10,2R R/f 9,s 10,~ R/6 9,~ I”,28
Check 213 ,106 .a90 1.25 0.32 0.16 1.11 1.22 0.96 Palaqll3t
2.0 ,339 .I50 .I26 1.35 0.36 0.18 1.09 I.31 1.33 1.0 ,354 ,133 .I26 1.30 0.30 0.18 0.98 0.94 1.1” 0.5 ,321 ,134 .I28 1.20 0.30 0.18 0.90 1.00 1.14 1.w ,046 .02x NS NS NS NS NS NS NS LSD2 ,065 NS - - - _ _ 1 LeaSt significant difference at .05 level.
2 Least significant difference at .a, Iwe,.
Fi,sl Trial.-The first trial was on a 1.5 acre subclover-annual grass pasture. Composition at spraying was 5270 legumes (mostly Mt. Barker subclover in full bloom), 45% annual grasses (mostly annual fescue and soft chess), and
37,
forbs. The soft chess was still green, but the fescue was 45 brown.The pasture was sprayed in the afternoon of May 11, 1964, with paraquat cation at 2.0 Ib/acre in total volume of 50 gpa containing X-77 at 0.05% vol/vol. This relatively high rate of paraquat was used because trials a few weeks earlier and other studies by Kay (1964, 1968) had shown subclover very resistant to paraquat. Sheep were turned in on June 24, when the pasture \vas all brown.
On June 10 the forage was a very dark color. Spores of the fungus Allernwia rose in a cloud when one walked through the pasture. This was probably the result of late May and early June rains totaling 0.85 inch. This did not appear to affect the acceptability of the forage to the sheep. In all trials, sheep preferred paraquat-sprayed forage to the unsprayed forage (Fig. 5).
Three ewe lambs were autopswd by Pathology Department personnel4 on September 9 after graz- ing sprayed pasture 77 days. Nothing abnormal was found.
The ten remaining lambs retained their average weight of 73.5 lb from June 24 to October 13.
Spraying had some effect on pasture composition one year larer. Paraquat plus summer grazing by sheep increased the subclover from 40 to 52%. Soft chess, ryegrass, and wild barley were reduced from 26 to 1%. Annual fescue remained the same, probably because this species had set seed before spraying. Forbs, largely filaree (Erodium sp.), in- creased from 3 to 18%.
Total ground cover in the winter after spraying was reduced to 25%, predominantly subclover. The pasture recovered to 100% ground cover by spring.
Second Grazing T&Z.--The annual legume Lana woolypod vetch (Vicia dusycarpu Ten.) was selected for this trial. In earlier trials vetch had proven much easier than subclover to desiccate with para- quat. Vetch also persists better under nongrazing during the growing season. Subclover rapidly de- creases under nongrazing and the pasture becomes grass-dominant.
The three 0.56 acre treatments were: paraquat sprayed at 1.0 lb/acre at early bloom (May 11) and at full bloom (June 3), and an unsprayed pasture as a check. On July 7, ten sheep per treat- ment were turned in on the unsprayed and the late-sprayed pastures. Two lambs in the un- sprayed group and one lamb in the late-sprayed group died from viral pneumonia during the first month.
Forage yield was 5,200 lb/acre on the early- spray, 7,500 lb on the late-spray, and 8,000 lb on the unsprayed areas, reflecting the amount of growth that took place after each spray treatment. There was a small amount of sprouting and re- growth of the vetch on the pasture sprayed the earliest.
Protein measurements on July 15 were respec- tively 13.3, 13.1, and 9.9%. Total protein pro- duction was 693, 982, and 854 lb/acre, which re- flects regrowth. Early treatment resulted in a net loss of protein per acre, whereas later spraying re- sulted in an increase of 128 lb/acre.
Samples taken near the end of the grazing sea- son, on September 8, showed protein to be re- spectively 11.1, 7.9, and 7.1%.
From July
7
to September 9, lambs on thesprayed vetch gained 9.8 lb, compared with 4.6 lb on unsprayed vetch. This was significantly dif- ferent at the .05 level of probability. From Septem- ber 9 to October 6, lambs on sprayed vetch lost 2.5 lb whereas those on the unsprayed vetch gained
1.7 lb. We feel this is because the forage supply had decreased more in the sprayed field, and the lambs were not getting enough to eat.
Third grazing trial.- This trial consisted of two
Seven lambs were turned into each pasture on July 7 and left for 91 days.
Forage samples collected September 8 showed the protein in sprayed and check pastures to be respectively 10.00% and 7.56%. Protein value in the unsprayed pasture was not excessively low, but the increase due to spraying resulted in in- creased lamb weights.
The lambs on sprayed pasture gained an average of 12.1 lb, compared with 6.7 lb on the unsprayed pasture, a difference significant at the .lO level. A small percentage can be important in that a higher protein content in feed increases microbial activity in the rumen (Oh et al., 1969). The in- creased activity digests feed at a faster rate, which increases rate of passage, allowing the animal to eat more. As shown by Blaxter et al. (1961), an increase in digestibility from 50 to 55% is actually more than a 10% increase. Since this increases voluntary intake, the energy available above main- tenance increases more than 100%.
Forage samples were collected 66, 92, and 120 days after sprayin g and analyzed for paraquat ion residue.G Paraquat levels declined considerably be- tween the first and second samplings, though a significant amount remained. Values at the three dates were 74.4, 33.2, and 37.6 ppm paraquat ion. Rain (0.53 inch) fell between the second and third samples. These residues are greater than those reported by Sneva (1967), which were taken in a year with rainfall of 2.54, 0.90, and 2.04 inches for -June, July, and August. This rainfall may account for lower residues in his work, due both to leaching and to dilution by forage regrowth.
The composition of the sprayed pasture was changed in the following year. Grass, legume, and
forb components were respectively 33, 2 1, and 46% in the sprayed pasture, and 51, 17, and 32% in the unsprayed.
Several plots of Italian thistle (Curduus pycno- cefjhulus L.) were treated with paraquat at % lb/ acre, and the plants were harvested on July 15 for chemical analysis. Treated thistle had 12.7% pro- tein content, compared with 3.4% for the un- sprayed. Likewise, crude fiber content was 22.4p/‘, for the treated and 34.5% for the untreated thistle. The sheep readily consumed the sprayed thistle. pastures-one sprayed on May 10 with paraquat at
1.0 lb/acre, and an adjacent unsprayed field as a Summary and Conclusions
check. The sprayed field was 70% grass, mostly soft Paraquat was very effective as a desiccant to chess and annual ryegrass in anthesis, 11 y0 legumes, cure standing annual range forage just prior to largely bur clover (Medicago hispidu Gaertn.), and natural maturing of the plant. Diquat and cacody- 19% forbs, compared with 5 1, 36, and 13%, re- lic acid were less effective on resident range, but spectively, in the unsprayed field. Total forage were not tried on subclover or vetch.
yield at spraying was 2,920 lb/acre and a month Desiccation of plants at this growth stage made later was 2,670 and 3,820 lb/acre on the sprayed a standing hay 57 to 68% higher in crude protein and unsprayed fields, respectively, indicating con-
CURING STANDING FORAGE 41
for a subclover-grass pasture,
77%
higher for a 77% annual grass pasture, and 34y0 higher on a ve tch pasture.Forage palatability is enchanced by treatment. Whether this is due to increased crude protein and phosphorus, decreased crude fiber, or other factors is not known.
Lambs grazing on forage treated with paraquat gain more rapidly than lambs grazing on naturally matured forage. Total sheep days per acre, how- ever, were less on treated forage than on untreated because sprayed pastures had fewer total days of growth and therefore less forage production. Also, the lambs probably consume more forage per day, further reducing carrying capacity.
No physiological or pathological changes were found in lambs that had grazed paraquat-treated forage.
The treated plots varied considerably in bo- tanical composition one year after spraying. An- nual grasses were greatly reduced in number, especially if much plant residue was left from the preceding year. When subclover was a dominant plant, its percentage was increased in the following year. Weedy plants invaded the area when sub- clover density was low.
Ground cover was about 25% in the winter following spraying, but increased to 100% by early spring.
Chemical composition of plants was similar in mowed plots and sprayed plots.
Weedy nuisance plants such as Italian thistle can be converted to palatable nutritious feeds by spray- ing with paraquat before they mature.
Literature Cited
BLAXTER, K. L., F. W. WAINMAN, AND R. S. WILSON. 1961. The regulation of food intake by sheep. Animal Produc- tion 3:51-61.
EVANS, R. A., AND R. M. LOVE. 1957. The step-point method of sampling-A practical tool in range research. J. Range Manage. 10:208-212.
FRANK, H. 1954. On the nitrogen loss of ageing plants. Planta 44:319-40.
GORDON, AARON, AND A. W. SAMPSON. 1939. Composition of common California foothill plants as a factor in range management. Calif. Agr. Exp. Sta. Bull. 627.
GREENWOOD, E. A. N., AND R. W. L. KIMBER. 1967. In- hibition of germination and root growth by extracts of
Bromus mollis L. straw. Field Station Record, 6:55-60 (CSIRO, Kojonup, W. A.).
GUILBERT, H. R., G. H. HART, K. A. WAGNON, AND H. Goss. 1944. The importance of continuous growth in beef cattle. Calif. Agr. Exp. Sta. Bull. 688.
HART, G. H., H. R. GUILBERT, AND H. Goss. 1932. Sea- sonal changes in the chemical composition of range forage and their relation to nutrition of animals. Calif. Agr. Exp. Sta. Bull. 543.
KAY, BURGESS L. 1964. Paraquat for selective control of range weeds. Weeds 12: 192-194.
KAY, BURGESS L. 1968. Effects of paraquat on yield and composition of a subclover-hardinggrass pasture. Weeds 16:66-68.
OH, H. K., W. M. LONGHURST, AND M. B. JONES. 1969. Relation of nitrogen intake to rumen microbial activity and consumption of low-quality roughage by sheep. J. Ani. Sci. 28:272-278.
RATLIFF, R. D., AND H. F. HEADY. 1962. Seasonal changes in herbage weight in an annual grass community. J. Range Manage. 15: 146-149.
SNEVA, FORREST A. 1967. Chemical curing of range grasses with paraquat. J. Range Manage. 20:389-394.
VAN DYNE, GEORGE M. 1965a. Chemical composition and digestibility of plants from annual range and from pure stand plots. J. Range Manage. 18:332-337.
VAN DYNE, GEORGE M., AND H. F. HEADY. 1965b. Dietary chemical composition of cattle and sheep grazing in common on a dry annual range. J. Range Manage. 18: 78-86.
WAGNON, K. A., H. R. GUILBERT, AND G. H. HART. 1942.
Experimental herd management. In: Hutchison, C. B., and E. L. Kotk. The San Joaquin Experimental Range. Calif. Agr. Exp. Sta. Bull. 663: 50-82.
WALLACE, JOE D., F. A. SNEVA, R. J. RALEIGH, AND C. B.
RUMBURG. 1966. Digestibility of chemically cured range forage. Proc. West Sec. Am. Sot. An. Sci. 17:385-390. WARBOYS, L. B., AND S. LEDSON. 1965. The effect of para-
quat treated grass mulch on the rate of emergence and growth of barley, rape, and perennial ryegrass seedlings. J. Brit. Grassland Sot. 20: 188-189.
YATES, W. E., AND F. M. ASHTON. 1960. Logarithmic dosage sprayer. Agr. Eng. 41:436-438, 442.
NOTICE OF NEW PUBLICATIONS