Segmentation of Skin Lesions from Digital Images
using an Optimized Approach: Genetic Algorithm
Hina Sood#1, Manshi Shukla*2
#M. Tech, Research Scholar, Department of Computer Science and Engineering, RIMT-IET, Mandi Gobindgarh, Fatehgarh Sahib, Punjab, India.
*Assistant Professor , Department of Computer Science and Engineering,RIMT-IET, Mandi Gobindgarh, Fatehgarh Sahib, Punjab, India.
Abstract- The incidence rates of skin cancer diseases
Melanoma have been on a rapid increase and is leading to higher death rates. Early detection is of utmost important which increases the survival rates if detected at Stage I. Segmentation of skin lesion is one of the biggest task to do along considering under and over segmentation. An algorithm for detection of skin lesion from digital images using Genetic Algorithm is proposed to get merging of over segmentation to get solved with it. It is one of the most popular techniques to get infinite probabilities solved with genetic algorithm which provides very close results in a short time. The lesion segmentation has been compared to the results of other algorithms. The proposed segmentation algorithm has higher segmentation Sensitivity, Specificity and Accuracy compared to all other segmentation algorithms.
Keywords- Melanoma, Segmentation, Genetic Algorithm,
Lesion, Dermoscopy.
I INTRODUCTION
Melanoma, a deadly skin cancer diseases is a malignant tumor of melanocytes which is causing a large number of deaths and it has been also found that its incidence rates have been on rapid increase [1]. It was estimated that in the United States 1 person among every 49 has the risk of suffering from melanoma [2]. This most deadly form of skin cancer mostly occurs among an age group of 15-30 [3]. However it is been emerging as a leading skin cancers among white-skinned people who come in contact with the ultraviolet radiations [4]. It was also made into notice that melanoma occurs on the lower extremities in a maximum number of cases that have been diagnosed yet [5]. Recent trends have stated that melanoma can be less dangerous if detected at an early stage i.e. if detected at Stage I, the survival rate of the effected person increases to 96% [6]. Due to the increase in the incidence rate of melanoma, researchers are more concerned about proposing such automated systems that diagnose skin lesions accurately and more effectively [7]. Also it has been found that in order to detect melanoma at an early stage screening is beneficial [8]. But the cost of screening melanoma is too high. So, to reduce the screening cost many automated algorithms have been proposed to automatically screen melanoma [8].
A digital dermoscope acquires images that contribute to early screening of melanoma [9] and all automated systems use dermoscopic images [10-11]. A dermoscope is a device that is used to capture images of lesions by the
dermotologists. It also magnifies the image and acts as a filter [8]. But most of the practicing dermotologists avoid using dermoscopy due to the lack of training [12]. With dermoscopy it becomes difficult to differentiate malignant and benign lesions and in such case a detailed analysis is needed to be done [13].
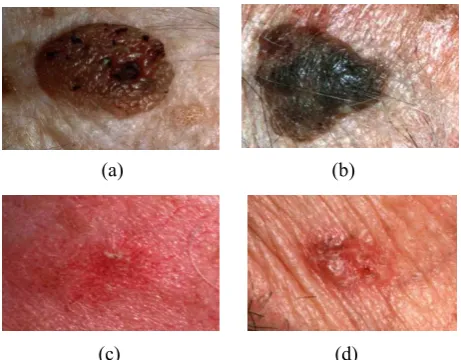
Recent studies show that standard digital camera is used to analyze images in automated screening algorithms for melanoma [14]. The standard approach followed in analyzing dermoscopic images automatically includes 1) image segmentation, 2) feature extraction, 3) lesion classification [15]. Segmentation is one of the most important steps in accurately determining a skin lesion. The subsequent steps depend highly on how precisely segmentation has been done. So, segmentation needs to be done with utmost care and is also a difficult task to do as in some lesion images the lesions have an approximately similar intensity value as that of the skin and also the image includes dark hairs covering the lesion. Some examples of such images have been shown in figure 1.
(a) (b)
(c) (d)
Figure 1: Difficulties in detecting lesions: (a) multiple colored lesions, (b) presence of hair, (c) smooth transition between lesion and skin, (d) specular reflections
to dermoscopy images. Some of the automated segmentation algorithms i.e. Independent Histogram Pursuit (IHP) [16], LOG Edge Detector [17], Texture Distinctiveness (TDLS) [18], Iterative Stochastic Region Merging [19] have been summarized under [20]. Many segmentation algorithms use colour information i.e. intensity value of pixels to detect the lesion. The colour information is either used in a single channel or across three colour channels [8]. The various segmentation methods include adaptive thresholding (AT), fuzzy-based split-and-merge algorithm (FBSM) [21] [22], gradient vector flow (GVF) [23], expectation-maximization level set (EM-LS) [24] etc. An another approach to detect skin lesions is to find out the best thresholds with the help of multi-level adaptive thresholding.
In this paper we propose an algorithm based on an optimization technique i.e. Genetic Algorithm (GA) to detect skin lesion in digital images. This algorithm is referred as the Genetic Algorithm based lesion segmentation algorithm. Genetic Algorithm is one of the most popular techniques to get infinite probabilities to get very close results in short time. As we have seen that segmentation of skin lesion is one of the biggest task to do along considering under and over segmentation. One of the biggest hurdles is to merge segmented objects after over segmentation due to its large number of probabilities. So, here we are proposing a unique algorithm to get merging of over segmentation to get solved with Genetic Algorithm. Section II, describes the proposed work. Experimental results are described in Section III. Section IV gives the conclusion of the work done and the future scope.
II PROPOSED WORK
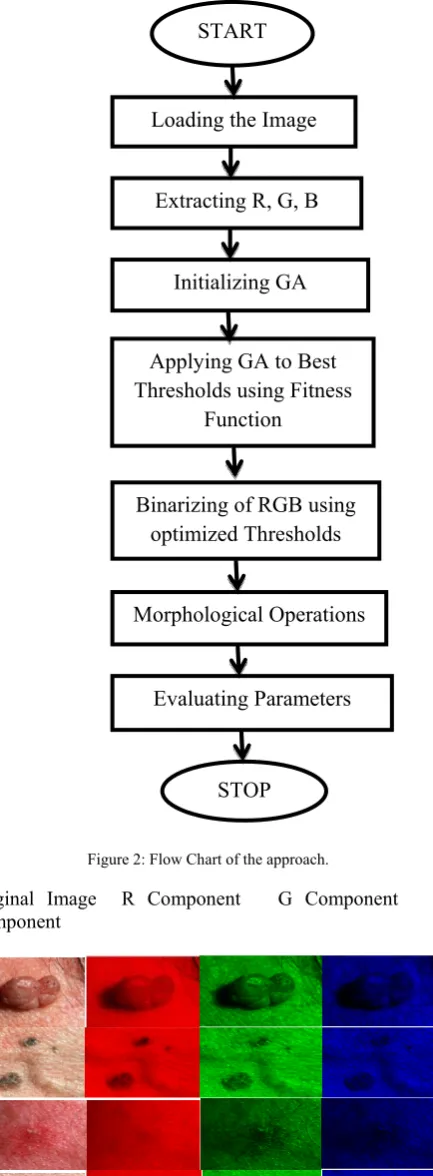
Segmentation of skin lesion is one of the biggest task to do along considering under and over segmentation. One of the biggest hurdles is to merge segmented objects after over segmentation due to its large number of probabilities [8]. So, here we are proposing a unique algorithm to get better results with large number of probabilities in less time. The first step of the proposed work involves the process of extracting the R, G and B components of the digital image. Through this characterization we represent the respective components as to which shows the lesion more clearly. In the second step Genetic Algorithm incorporates the best thresholds using the fitness function and generates a GA segmented result. Binarization of R, G and B components and Morphological operations and filtration is defined in third step. Figure 2 represents the various steps of the proposed work.
A. Extracting R, G and B Components
The proposed algorithm includes extracting the R, G and B components as its initial step which expresses the three components separately and shows the dissimilarities between the three colours so that we can examine that which component clearly views the lesion. As this initial step firstly the image is loaded in the MATLAB and its R, G and B components are extracted and are shown separately. To describe this step in detail Figure 2 includes some examples that illustrate the process of extraction and also show the components separately.
Figure 2: Flow Chart of the approach.
Original Image R Component G Component B Component
Figure 3. Images showing R, G and B components separately
After the R, G and B components have been extracted, a non-linear digital filtering technique i.e. a 3*3 Median Filter is used to detect edges, remove background noise and
START
Loading the Image
Extracting R, G, B
Initializing GA
Applying GA to Best Thresholds using Fitness
Function
Binarizing of RGB using optimized Thresholds
Morphological Operations
Evaluating Parameters
smoothen the image. Moreover to improve the visual quality and to increase the global contrast of the image Histogram Equalization is used. This adjusts the contrast and makes the image easier to analyze. Then the shadows in the image are removed using Colour Normalization by preserving the colour values.
B. Applying Genetic Algorithm
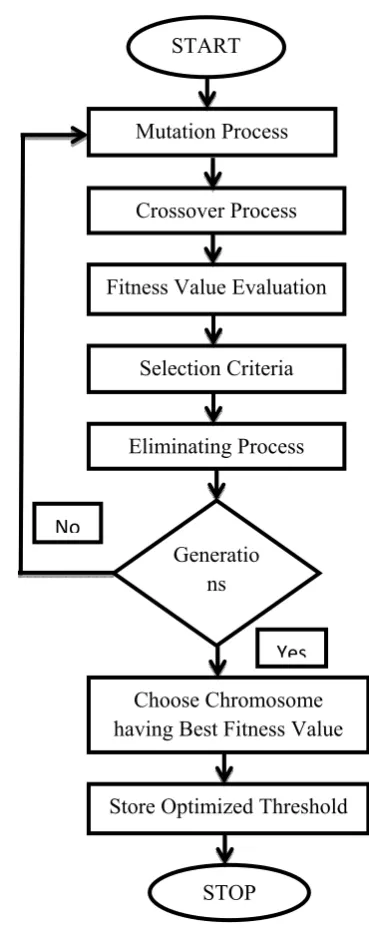
The Genetic Algorithm consists of two main steps. First is Initialization of GA Parameters that initializes the parameters like the number of chromosomes and the number of generations to be operated. The second step Genetic Algorithm is applied to get best thresholds using fitness function. Figure 3 illustrates the overall process of Genetic Algorithm.
Initializing GA Parameters
The first phase of application of Genetic Algorithm is initializing the various parameters that are needed for the computation. The parameters include (a) the number of chromosomes and (b) the number of generations. If we assume the number of chromosomes as ‘C’ and the number of generations as ‘n’ then the algorithm will run for ‘c’ number of chromosomes and will operate on ‘n’ number of generations. More the number of generations more will be the accuracy of the lesion detected. The initialized chromosomes are termed as ‘parent chromosomes’. After the parameters have been initialized the various phases of genetic algorithm are executed to get the best chromosome having best fitness value and generating the GA segmented result. The various steps are as follows:
1) Mutation: In the mutation process child chromosomes
are generated from the parent chromosomes. It operates at bit level of the image. Generating child chromosomes include changing one if the values among each chromosome with a defined step size accordingly. This results in an equal number of parent and child chromosomes. The parent and child chromosomes share certain characteristics.
2)Crossover: Crossover process is used to prepare a child
solution with the help of more than one parent. Through this we can vary programming of one chromosome from the other. Crossover process includes crossing over between the best selected chromosomes. In this any one of the value of any of the chromosomes crosses over with the value of some other chromosome.
Applying GA to best threshold using Fitness Function
The second phase of Genetic Algorithm includes the following steps which compute the fitness value and generates best threshold as a final output.
3) Fitness Value Evaluation: A fitness function is a
function that gives us a fitness value with which we can select the best one for later steps in the algorithm. The maximum value of fitness function denotes the best chromosome. The fitness value evaluation includes evaluating fitness value for both the parent as well as child chromosomes by substituting the value of define parameters into the fitness function. This fitness value is referred to in
future in the selection process to extract the best chromosomes.
Figure 4: Flow chart describing Genetic Algorithm.
The fitness function is defined using the weight sum method where the fitness value is generated keeping in concern all the evaluation parameters. The weight sum method initializes equal weight for each parameter used in fitness function which equally increases the value for each i.e. Sensitivity, Specificity and Accuracy. The fitness function so designed for this particular algorithm is given as follows:
IR₁ = {IR (I, j) < thr then, IR₁ (I, j) = 1 otherwise, IR₂ (I, j) = 0 (1) IG₁ = {IG (I, j) < thg then, IG₁ (I, j) = 1 otherwise, IG₂ (I, j) = 0 (2)
START
Mutation Process
Crossover Process
Fitness Value Evaluation
Selection Criteria
Eliminating Process
Generatio ns
Choose Chromosome having Best Fitness Value
Store Optimized Threshold
IB₁ = {IB (I, j) < thb then, IB₁ (I, j) = 1 otherwise, IB₂ (I, j) = 0 (3) where i and j are the dimensions for image and IR, IG and IB are the indexed component of the image.
Fitness Value = (SN (IR₁|IG₁|IB₁)) * W₁ + (SP (IR₁|IG₁|IB₁)) * W₂ + (Acc (IR₁|IG₁|IB₁)) * W₃
(4)
where SN(), SP(), Acc() are the function to evaluate Sensitivity, Specificity and Accuracy and W₁, W₂ and W₃
are the respective weights.
4) Selection: The selection process includes selecting the
best fitness value that in turn gives best chromosome. The chromosome with a highest fitness value is to be selected. The optimization algorithm deals with the maximum (i.e. maxima) and minimum (i.e. minima) values that generate the best results. Here we are proposing an algorithm that deals with maxima.
5) Elimination: In the elimination phase the chromosomes
with least fitness value are replaced with the one having maximum fitness value. This process is repeated for all chromosomes and the chromosomes with least fitness value are eliminated. With this only the best chromosomes are left for further processing and others are eliminated.
After this elimination, the algorithm checks if it has completed its processing for ‘n’ number of generations. If not, the whole process repeats itself till all generations have been operated.
If the generations are over, the chromosome having best fitness value is chosen and the process is terminated. This generates a best threshold value for the image.
The Genetic Algorithm is summarized as follows in the form of pseudo code.
for i = 1 to i = C C_Pᵢ = R (SS) END for for j = 1 to j = n for i = 1 to i = C
{if C_ Pᵢ + I(Ѵ) < 0 & C_ Pᵢ + I(Ѵ) < 255 then C_Cᵢ = C_ Pᵢ + I(Ѵ) {if C_ Pᵢ + I(Ѵ) < 0
then C_Cᵢ = C_ Pᵢ {if C_ Pᵢ + I(Ѵ) > 255
then C_Cᵢ = C_ Pᵢ END for
END for for i = 1 to i = C C_Cfᵢ = ff (C_ Cᵢ) END for
for i = 1 to i = C if (C_Cfᵢ > C_Pfᵢ) (C_Pfᵢ > C_Cfᵢ) (C_Pfᵢ > C_Cfᵢ) END if
END for Where,
R is the random function to generate thresholds with SS search limit.
SS ϵ [0 255] n is the number of generations C is the number of chromosomes
I(Ѵ) is the function to mutate chromosomes with Ѵ Ѵϵ [-10 10]
C_Cfᵢ is the fitness value for its chromosomes ff is the fitness function
C. Binarization of RGB and Morphological Operations
Binarization of RGB using Optimized Thresholds
After applying GA to get best thresholds using fitness function, the binarization of RGB is done using best thresholds. The best thresholds generated by the Genetic Algorithm is that value that gives the best output for the lesion. This value is then converted in binary form in this stage. Thus the optimized thresholds help in detecting the lesion more accurately.
Morphological Operations
After binarization, morphological operations are applied to analyze and process the lesion structure. The basic morphological operators used are dilation, erosion, closing and opening. Here for the proposed algorithm we are using the morphological erosion operation. This operator after application shrinks the objects in image for more correctly detecting the lesion. After applying Morphological Dilation operation, Morphological Filtering is applied to the image for enhancing the image to improve the perceptibility of the image.
C. Summary of the Genetic Algorithm
1) Extract the R, G and B components of the image loaded in the MATLAB.
2) Initialize the Genetic Algorithm by defining the parameters such as the ‘C’ number of chromosomes to be operated with ‘n’ number of generations.
3) Computing the best thresholds for the given image. 4) Applying GA to best thresholds using fitness function
so that the best value computed by the fitness function is selected for further processing and producing a GA segmented image.
5) Selecting the chromosomes with maximum fitness value and eliminating the others by replacing them by the selected maximum fitness value chromosomes. 6) Checking if all the generation have been operated. If
not repeating all the above steps for ‘n’ number of generations.
7) Storing the optimized threshold.
8) Converting the R, G and B components to their binary forms using optimized thresholds.
9) Predicting outline to the detected lesion.
10) Apply a morphological dilation operation to the resulting image.
III EXPERIMENTAL RESULTS
The proposed work compares the Detected skin lesion using Genetic Algorithm with other segmentation algorithms. The two steps involved in the process are to generate a GA segmented result and the second step is to compute the final resulting image using the best thresholds generated by the genetic algorithm. The Genetic Algorithm is implemented in MATLAB with a Intel (R) Core (TM) i5 CPU (M 480 @ 2.67 GHz 2.66 GHz, 4 GB RAM). To segment a skin lesion in a 1640 * 1043 image, the algorithm computes an average 100% Sensitivity, 99.93% Specificity and 99.94% Accuracy and has an average rum time of 45.8893 seconds.
The images used for this algorithm have been taken from the Dermquest database [25]. The images used are corrected using MSIM algorithm [26].
A. GA Segmentation
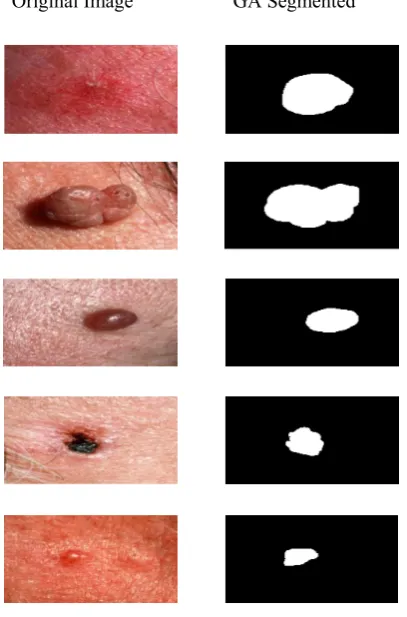
After the image has been loaded into the MATLAB, and its R, G and B components have been extracted, Genetic Algorithm is applied to the image to get a GA segmented result. This GA segmented result is further used to drive the best thresholds and detect the skin lesion accurately. The GA segmented result of some of the images have been shown as follows:
Original Image GA Segmented
Figure 5 Representation of GA segmentation
B. Segmentation Sensitivity, Specificity and accuracy evaluation
The objective of this algorithm is to increase the Sensitivity, Specificity and Accuracy. The metrics that are been used to compare the detected skin lesion to the ground
truth are Sensitivity, Specificity and Accuracy. The formulas to compute these three parameters are given in Eqn. 5, 6 and 7.
(5)
(6)
(7)
Here
TP= True Positive i.e. the number of true positive pixels TN= True Negative i.e. the number of true negative pixels FN= False Negative i.e. the number of false negative pixels FP= False Positive i.e. the number of false positive pixels
TABLE I
SEGMENTATION SENSITIVITY, SPECIFICITY AND ACCURACY RESULTS FOR ALL LESION PHOTOGRAPHS
Segmentation
Algorithm Sensitivity Specificity Accuracy
L-SRM [27] 89.4% 92.7% 92.3%
Otsu-R [28] 87.3% 85.4% 84.9%
Otsu-RGB [29] 93.6% 80.3% 80.2%
Otsu-PCA [30] 79.6% 99.6% 98.1%
TDLS [8] 91.2% 99.0% 98.3%
GA 100% 99.93% 99.94%
The above table shows the results of the algorithms including the proposed algorithm i.e. Genetic Algorithm (GA).
Original Image Ground Truth GA
Figure 7 Segmentation of skin lesion using genetic algorithm. The first column shows the original image, the second column shows the manually segmented ground truth and the third column contains the results of proposed genetic algorithm.
IV CONCLUSION
A unique algorithm to get merging of over segmentation is proposed. The biggest hurdle was to merge segmented objects after over segmentation due to a large number of probabilities. Also segmentation of skin lesion is one of the biggest task to do along considering under and over segmentation. The proposed algorithm have generated highest result for all the three parameters and has computed very close results in a short time. The future work is worth conducting an analysis of other optimization techniques to produce better results.
ACKNOWLEDGMENT
REFERENCES
[1] A. Jemal, M. Saraiya, P. Patel, S. S. Cherala, J. Barnholtz-Sloan, J. Kim,C. L. Wiggins, and P. A. Wingo, “Recent trends in cutaneous melanoma incidence and death rates in the united states, 1992-2006,” Journal of theAmerican Academy of Dermatology, vol. 65, no. 5, pp. S17.e1–S17.e11,Nov 2011.
[2] N. Howlader, A. M. Noone, M. Krapcho, J. Garshell, N. Neyman,S. F. Altekruse, C. L. Kosary, M. Yu, J. Ruhl, Z. Tatalovich, H. Cho,A. Mariotto, D. R. Lewis, H. S. Chen, E. J. Feuer, and K. A. Cronin,“Seer cancer statistics review, 1975-2010,” Bethesda, MD, Tech. Rep.,2013.
[3] C. Herzog, A. Pappo, M. Bondy, A. Bleyer, and J. Kirkwood, “Malignant melanoma,” in Cancer Epidemiology in Older Adolescents and Young Adults 15 to 29 Years of Age, Including SEER Incidence and Survival: 1975-2000, A. Bleyer, M. OLeary, R. Barr, and L. A. G. Ries, Eds. Bethesda, MD, USA: Nat. Cancer Inst., 2006, pp. 53–64.
[4] A. Green, N. Martin, G. McKenzie, J. Pfitzner, F. Quintarelli, B. W. Thomas, M. O’Rourke, and N. Knight, “Computer image analysis of pigmented skin lesions,” Melanoma Res., vol. 1, pp. 231–236, 1991. [5] Public Health Agency of Canada. (2012, Jul.). Melanoma Skin
Cancer [Online]. Available: http://www.phac-aspc.gc.ca/cd-mc/cancer/melanoma_skin_cancer-cancer_peau_melanome-eng.php [6] K. A. Freedberg, A. C. Geller, D. R. Miller, R. A. Lew, and H. K.
Koh,“Screening for malignant melanoma: A cost-effectiveness analysis,” Journal of the American Academy of Dermatology, vol. 41, no. 5, pt. 1,pp. 738–745, Nov 1999.
[7] Harald Ganster*, Axel Pinz, Reinhard Röhrer, Ernst Wildling, Michael Binder, and Harald Kittler “Automated Melanoma Recognition” IEEE TRANSACTIONS ON MEDICAL IMAGING, VOL. 20, NO. 3, MARCH 2001
[8] Jeffrey Glaister, Alexander Wong and David A. Clausi “Segmentation of skin lesions from digital images using joint statistical texture distinctiveness”0018- 9294 (c) 2013 IEEE Transactions on Biomedical Engineering.
[9] M. E. Celebi, H. A. Kingravi, B. Uddin, H. Iyatomi, Y. A. Aslandogan, W. V. Stoecker, and R. H. Moss, “A methodological approach to the classication of dermoscopy images,” Computerized Medical Imaging and Graphics, vol. 31, no. 6, pp. 362–373, Sept 2007.
[10] H. Iyatomi, H. Oka, M. E. Celebi, M. Hashimoto, M. Hagiwara,M. Tanaka, and K. Ogawa, “An improved internet-based melanoma screening system with dermatologist-like tumor area extraction algorithm,” Computerized Medical Imaging and Graphics, vol. 32, no. 7,pp. 566 – 579, Oct 2008.
[11] [9] H. Ganster, A. Pinz, R. Rohrer, E. Wildling, M. Binder, and H. Kittler,“Automated melanoma recognition,” IEEE Transactions on Medical Imaging, vol. 20, no. 3, pp. 233–239, Mar 2001.
[12] H. C. Engasser and E. M. Warshaw, “Dermatoscopy use by US dermatologists:A cross-sectional survey,” Journal of the American Academy of Dermatology, vol. 63, no. 3, pp. 412–419, 2010. [13] Hina Sood1, Manshi Shukla2 “An Approach for Detection of Skin
Lesions from Digital Images using Genetic Algorithm” Global Journal of Advanced Engineering Technologies, Vol3, Issue3-2014 [14] P. G. Cavalcanti and J. Scharcanski, “Automated prescreening of
pigmented skin lesions using standard cameras,” Computerized Medical Imaging and Graphics, vol. 35, no. 6, pp. 481–491, Sept 2011.
[15] Margarida Silveira, Member, IEEE, Jacinto C. Nascimento, Member, IEEE, Jorge S. Marques, André R. S. Marçal, Member,
IEEE, Teresa Mendonça, Member, IEEE, Syogo Yamauchi, Junji Maeda, Member, IEEE, and Jorge Rozeira “Comparison of Segmentation Methods for Melanoma Diagnosis in Dermoscopy Images” IEEE Journal of selected topics in Signal Processing, vol. 3, no. 1, February 2009
[16] Gregory A. Hance , Scott E. Umbaugh, Randy H. Moss and William V. Stoecker “Unsupervised Color Image Segmentation With Application to Skin Tumor Borders” IEEE Engineering in Medical and Biology, January/Febuary 1996.
[17] Alexander Wong, Jacob Scharcanski and Paul Fieguth “Automatic Skin Lesion Segmentation via Iterative Stochastic Region Merging”IEEE Transactions on Information Technology in Biomedicine, Vol. 15, No. 6, November 2011
[18] Stefan Fischer, Philippe Schmid,JoelGuillod “Analysis Of Skin Lesions With Pigmented Networks” Image Processing 1996 IEEE proceedings Pg323 - 326 vol.1
[19] Jeffrey Glaister, Alexander Wong and David A. Clausi “Segmentation of skin lesions from digital images using joint statistical texture distinctiveness”0018- 9294 (c) 2013 IEEE Transactions on Biomedical Engineering
[20] Hina Sood, Manshi Shukla “Various Techniques for Detecting Skin Lesion: A Review” IJCSMC, Vol. 3, Issue 5,May 2014.
[21] J. Maeda, A. Kawano, S. Saga, and Y. Suzuki, “Number-driven perceptual segmentation of natural color images for easy decision of optimal result,” in Proc. Int. Conf. Image Processing, 2007, vol. 2, pp. 265–268.
[22] J. Maeda, A. Kawano, S. Saga, and Y. Suzuki, “Unsupervised perceptual segmentation of natural color images using fuzzy-based hierarchical algorithm,” in Proc. SCIA. New York: Springer, 2007, vol. 4522, Lecture Notes in Computer Science, pp. 462–471. [23] C. Xu and J. Prince, “Snakes, shapes, and gradient vector flow,”
IEEE Trans. Image Process., vol. 7, no. 3, pp. 359–369, Mar. 1998. [24] G. McLachlan and T. Krishnan, The EM Algorithm and Extensions.
New York: Wiley, 1997.
[25] DermQuest, http://www.dermquest.com, 2012, Accessed: 08 Nov 2012.
[26] J. Glaister, R. Amelard, A. Wong, and D. A. Clausi, “MSIM: Multi-stage illumination modeling of dermatological photographs for illumination corrected skin lesion analysis,” IEEE Transactions on Biomedical Engineering, vol. 60, no. 7, pp. 1873–1883, July 2013. [27] M. E. Celebi, H. A. Kingravi, H. Iyatomi, Y. A. Aslandogan, W. V.
Stoecker, R. H. Moss, J. M. Malters, J. M. Grichnik, A. A. Marghoob,H. S. Rabinovitz, and S. W. Menzies, “Border detection in dermoscopy images using statistical region merging,” Skin Research and Technology,vol. 14, no. 3, pp. 347–353, 2008. [28] P. G. Cavalcanti, J. Scharcanski, and C. B. O. Lopes, “Shading
attenuation in human skin color images,” in Advances in Visual Computing, ser. Lecture Notes in Computer Science, G. Bebis, R. Boyle, B. Parvin, D. Koracin, R. Chung, R. Hammoud, M. Hussain, T. Kar-Han, R. Crawfis, D. Thalmann, D. Kao, and L. Avila, Eds. Springer Heidelberg, 2010, vol. 6453, pp. 190–198.
[29] P. G. Cavalcanti and J. Scharcanski, “Automated prescreening of pigmented skin lesions using standard cameras,” Computerized Medical Imaging and Graphics, vol. 35, no. 6, pp. 481–491, Sept 2011.