The Importance of Take-Out Food Packaging Attributes: Conjoint
Analysis and Quality Function Deployment Approach
Dyah Lestari Widaningrum1
1
Industrial Engineering Department, Faculty of Engineering, Bina Nusantara University, Jl. KH Syahdan 9, Jakarta, 11480, Indonesia, [email protected]
Abstract. This research aims to investigate the importance of take-out food packaging attributes, using conjoint analysis and QFD approach among consumers of take-out food products in Jakarta, Indonesia. The conjoint results indicate that perception about packaging material (such as paper, plastic, and polystyrene foam) plays the most important role overall in consumer perception. The clustering results that there is strong segmentation in which take-out food packaging material consumer consider most important. Some consumers are mostly oriented toward the colour of packaging, while another segment of customers concerns on packaging shape and packaging information. Segmentation variables based on packaging response can provide very useful information to maximize image of products through the package’s impact. The results of House of Quality development described that Conjoint Analysis – QFD is a useful combination of the two methodologies in product development, market segmentation, and the trade off between customers’ requirements in the early stages of HOQ process
1 Introduction
Today, fast food industry is growing in Indonesia especially in Jakarta as urban area. One of the services provided by the fast food restaurant is call take-out food service. This service includes direct purchase at restaurant (or special kiosk provided by restaurant) as well as ordering by phone/fax/internet.
While such convenience seems irresistible to consumers, widespread purchase of take-out food brings about concerns of several problematic factors: the amount of time from purchase to consumption, the type of container, and the consumer knowledge as to reheating
food product safely (Boyce et al., 2008). Packaging used
by fast food restaurants hold foods that frequently consume outside the restaurant
Silayoi and Speece (2005) demonstrate that the conjoint study seems to have been an effective way to examine how consumers view packaging, and Surjandari (2010) describes that Conjoint Analysis – QFD is a useful combination of the two methodologies in product development, market segmentation, and the trade off between customers’ requirements in the early stages of the HOQ process. This research examines consumer response packaging using a Conjoint Analysis and Quality Function Deployment (QFD) among consumers for take-out food products in Jakarta, Indonesia. The relationship between consumer choices in various market segments and design characteristics of packaging is a key
issue that marketers of packaged food products must understand to develop effective marketing strategy (Silayoi and Speece, 2005).
1.1 Research Problem
- What is take-out food packaging attributes based on
consumers perception?
- How is the consumer segmentation based on their
preferences?
- How is the conjoint analysis results can use for
packaging development?
1.2 Objectives of the Study
- To identify take-out food packaging attributes based
on consumers perception
- To define consumer segmentation based on their
preferences
- To develop the House of Quality in the early stage
using the conjoint analysis results
2 Methodology
This study consists of 5 steps as can be seen in Figure 1. Conjoint Analysis and Cluster Analysis in Step 1 to 3 use empirical data obtained from the survey on consumer of take-out food product. This survey consists of several
activities as can be seen in Figure 2. The results of these steps used as information to mediate between consumer expectation and product designer. This study have prioritized technical requirements for all customer segments, by developing House of Quality, that consists of several activities as can be seen in Figure 3.
Figure 1. Research Methodology: Conjoint-QFD (source: Surjandari, 2010)
Figure 2.Conjoint Analysis Methodology (source: Hairet al, 2006)
3 Collecting Data
The object of this study is the user consumers of take-out food products, from one of well-known fast food restaurant in Indonesia. This restaurant has had 62 outlets in Jakarta and 85 outlet in others area (Banten, West Java, Central Java, East Java, Jogjakarta and Bali), but the
research focus on Jakarta Area, to fulfil the convenience life style. Packaging that analyzed in this study is packaging that used to contain the packaged menu, consists of rice, main menu/product, side dishes, salad, and sauce.
Figure 3.Develop House of Quality (source: Surjandari, 2010)
4 Analyzing Data
4.1. Step 1: Conjoint Analysis
Attributes and levels of take-out food packaging are
defined based on data analyzing from 1st survey and
Focus Group Discussion from various department within the company, as can be seen in Table 1.
Table 1.Attributes and Levels of Take-Out Food Packaging
Attributes Levels
1 Packaging Material
1 Plastic
2 Paper
3 Polystyrene Foam
2 Information on the Packaging
1 Detail Information*)
2 Non Detail Information
3 Container Shape
1 With Compartment
2 Without Compartment
4 Container Colour
1 Light (White, Beige, etc)
2 Dark (Black, Brown, etc)
*) information consists brand name, brand logo, name of product, food grade symbol, recycling code.
The design stimuli in this study using SPSS 15.0 software and so was the conjoint data analyzing. Data
total of 287 data, but only 274 data used for the analysis. Thirteen data were unusable for data analysis because the participants failed to complete all portions of the surveys or not eligible respondents.
Pilot test of 30 respondents conducted to ensure that there is clarity of statement on the questionnaire, and the result indicates that the survey instrument is reliable.
Goodness of Fit conducted to ensure the accuracy and consistency of the respondents in filling out the questionnaire, with the minimum coefficient of Pearson’s R for individuals is 0.4 with p-value<0.05. Pearson’s
coefficient R0.4 indicates the strength of correlation
between the results predicted ranking with actual ranking of data is moderate to very strong. P-value<0.05 indicates a significant correlation between the results predicted ranking with the actual ranking of data, and it can be concluded that the model was accurate so that the calculation of data worth for further analysis.
Of the 274 data used, there were 11 data are not worthy to be further processed, because it has p-value>0.05 or Pearson’s R value<0.4. Of 263 data were analyzed, individually generated utility value of each level with standard error of the utility, as well as the utilities importance value of each attribute take-out food product packaging, as can be seen in Table 2.
Table 2. Conjoint Analysis Result (n=263)
Attribute Level Estimate Utility Std. Err.
Importance Values
Packaging Material
Plastic -.046 .023
44.539
Paper .210 .023
Polystyrene
Foam -.163 .023
Information
on the
Packaging
Detail
Information .184 .017 17.772 Non Detail
Information -.184 .017
Container Shape
With
Compartment .123 .017 15.356
Without
Compartment -.123 .017
Container Colour
Light (White,
Beige, etc) .193 .017 22.333 Dark (Black,
Brown, etc) -.193 .017
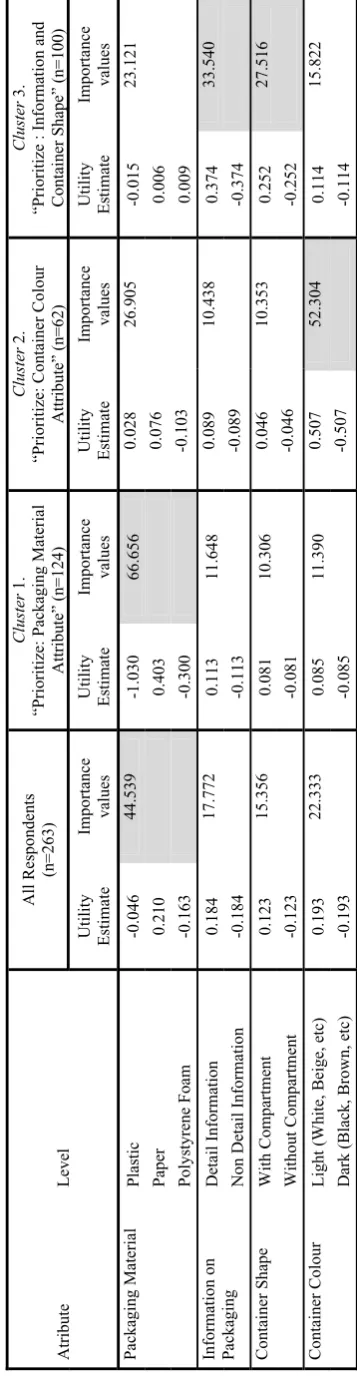
Individual utility value varies but when viewed as aggregate, utility value that has the highest positive value in sequence are packaging material, container colour, information on the packaging, and the container shape.
Conjoint analysis result indicate that packaging material are the most attribute that affect consumers’ preferences of take-out food packaging, as for the other attributes have important values that are not too different.
Packaging material as the main attribute, has a highest utility value for packaging material base paper. Consumer choose light colour for container, indicate that consumers’ perceived safe and comfort with light colour
that can reflect the quality of food they consume. This is related to the main function of take-out food packaging to protect the product during distribution, and not as a
marketing tools (Boyce et al, 2008).
Detail information on take-out food packaging prefer by consumers indicate that consumers concern about food safety, healthy, and environment. This attribute give added value for the packaging design.
Container shape with compartment have positive utility value that related with previous research that consumers prioritize convenience, include easy to consume the food they buy (Silayoi and Speece, 2007;
Boyce et al, 2008; Binkley et al, 2008).
Conjoint Analysis calculation with aditif model are appropriate with assumption that has described before, so it can state that the research are valid internally. The respondents used that are representative to the population and the high accuracy in predicting the ranking show that the research are valid externally.
4.2. Step 2: Cluster Analysis
This research conduct Clustering to 263 respondents based on importance values from each respondent. Two stage clustering procedure using Ward’s and K-Means to develop market segmentation.
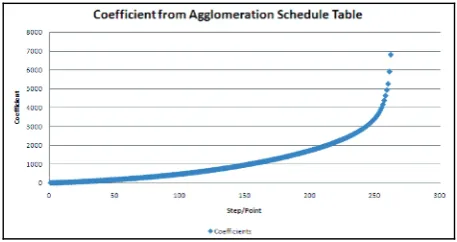
Cluster analysis which using Ward’s method have resulted agglomeration schedule table and dendrogram. Agglomeration schedule table used to consider how many cluster to define. By the table, it can be seen that from 1 to 259 point, there is no significance change, but a surge dramatically at the point 260, 261, and 262.
Figure 4. Coefficient Graphic from Agglomeration Schedule Table
Coefficient value algorithm from 263 respondents generate the elbow to the graphic. By this result, the number of clustering group can be calculated by deduct the amount of respondents with the drastic surge on the coefficient value, that is (263-260) = 3 clustering group.
The second stage is using K-Means method to improve Ward’s method and show the selection of respondents by the clustering group.
Table 3.
One-way ANOVA Importance Values of Take
-out Food Packaging to 3 Clustering Group
Cluster
Error
F
Sig.
Mean Square
df
Mean Square
df
Packaging Material
57628.468
2
190.564
260
302.410
.000
Information on Packaging
13565.185
2
152.396
260
89.013
.000
Container Shape
8050.101
2
135.927
260
59.224
.000
Container Colour
36902.168
2
131.319
260
281.013
.000
Table 4.
One-way ANOVA Importance Values of Take
-out Food Packaging to 3 Clustering Group
Level
All Respondents
(n=263)
Cluster
1.
“Prioritize: Packaging Material
Attribute” (n=124)
Cluster
2.
“Prioritize: Container Colour
Attribute” (n=62)
Cluster
3.
“Prioritize : Information
and
Container Shape” (n=100)
Utility Estimate
Importance
values
U
tility
Estimate
Importance
values
Utility Estimat
e
Importance
values
Utility Estimate
Importa
n
ce
values
Plastic
-0.046
44.539
-1.030
66.656
0.028
26.905
-0.015
23.121
Paper
0.210
0.403
0.076
0.006
Polystyrene Foam
-0.163
-0.300
-0.103
0.009
Detail Information
0.184
17.772
0.113
11.648
0.089
10.438
0.374
33.540
Non Detail Information
-0.184
-0.113
-0.089
-0.374
With Compartment
0.123
15.356
0.081
10.306
0.046
10.353
0.252
27.516
Without Compartment
-0.123
-0.081
-0.046
-0.252
Light (
W
hite, Beige, etc)
0.193
22.333
0.085
11.390
0.507
52.304
0.114
15.822
Dark (Black, Brown, etc)
-0.193
-0.085
-0.507
Table 5.
House of Quality for Take-Out Food Packaging
Levels Customer
Needs
Technical Requirements
The Relative Importance
Material
Characteristic
Information
Aesthetic
Conformance
All
Seg
1 Seg
2 Seg
3
L11 L12 L13
Packaging
Material
9
9
3
3
9
44.539
66.656 26.905 23.121
L21 L22
Information on Packaging
3
3
9
3
1
17.772
11.648 10.438 33.540
L31
L32
Container
Shape
3
9
1
9
9
15.356
10.306 10.353 27.516
L41 L42
Container
Colour
3
3
1
9
3
22.333
11.390 52.304 15.822
Importance Absolute
1 699.936
761.772
326.496
430.176
738.476
2957
2 461.43
523.548
237.314
675.942
502.672
2401
3 438.723
603.819
414.561
560.025
536.739
2554
Importance Relative
(%)
1 23.67%
25.76%
11.04%
14.55%
24.98%
Note:
2 19.22%
21.81%
9.88%
28.15%
20.94%
9
Strong
3 17.18%
23.64%
16.23%
21.93%
21.02%
3
Medium
Segments 1 ranks
3
1
5
4
2
1
Weak
Segments 2 ranks
4
2
5
1
3
Segments 3 ranks
4
1
5
2
3
Importance Absolute All Customers
567.234
659.37
331.254
526.134
623.826
2708
Importance Relative All Customers
(%) 20.95%
24.35%
12.23%
19.43%
23.04%
All the Customer Ranks
3
1
5
4
2
(source:
Surjandari,
4.3 Step 3: Conjoint Analysis for Each Segment
In this step, conjoint analysis conducted to each cluster. The result of this conjoint analysis can be seen in Table 4.
4.4 Step 4: The HOQ Mechanism
The first step to develop QFD are identify customer
requirement, and this information has gained from the 1st
survey and FGD, that define packaging material, information on packaging, container shape, and container colour as main attributes.
Prioritizing product attributes based on customer requirement interpret from conjoint analysis result, in aggregate and each clustering group. The importance value in percentage form and in ranking can be seen in Table 6.
Table 6. Relative Importance for Each Market Segment
Attribute Relative Importance (%) Ranking
A 1 2 3 A 1 2 3
Packaging Material
44, 539
66, 656
26, 05
23,
121 1 1 2 3 Information
on Packaging
17, 772
11, 648
10,4 38
33,
540 3 2 3 1
Container Shape
15, 356
10, 306
10,3 53
27,
516 4 4 4 2 Container
Colour
22, 333
11,3 90
52,3 04
15,
822 2 3 1 4
Technical response has defined as alternative program that company can take to response customer requirements, as can be seen below:
1. Material Design Process 2. Characteristic Design Process 3. Information Design Process 4. Aesthetic Design Process 5. Quality Conformance Process
After defining the technical response, then the relationship matrix define to show the relationship between the technical response and customer requirement. This is the fundamental portion of HOQ. Each cell represents how an engineering parameter relates to customer requirements. 9 represent strong relationship, 3 represent medium relationship, 1 represent weak relationship, and we can leave the cell blank if there is no relationship at all.
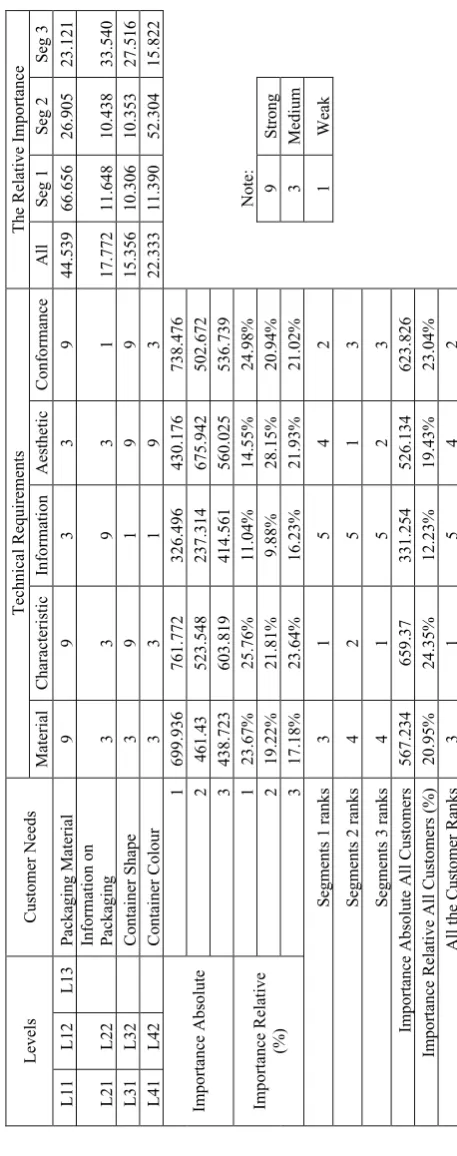
Based on the relationship matrix and the relative importance value, we can conduct rank ordering, to assign the requirement with the highest priority and then decrease as the requirements have lower priority. We can determine rank ordering by calculating the relative importance based on customers’ requirement and the relation matrix. The calculation is to get Importance Absolute, Importance Relative (%), Importance Absolute All Customers, and Importance Relative All Customers (%), as can be seen in Table 5.
4.5 Step 5: The Analysis of The Results
Physical characteristics of the design process of take-out food packaging is seen as the most important requirements, followed by conformance to quality, material packaging design, aesthetic design, and information design.
The first three requirements in line with the fulfilment of the functions value of take-out food packaging. The aesthetic and information design also important to give added-value that can perceived by customers and provide opportunity to improve customer satisfaction.
The rank order for each segment are not significantly difference compare to the rank order that based on all consumers. Companies can make policy based on the results of the development of House of Quality, and the policy should consider the ability of the company in product development process (Surjandari, 2010).
5 Conclusion
From the analysis that has been done, it can be concluded as follows. Packaging characteristics considered important by respondents, either with words that expressed directly by respondents, and the results of the assessment given by the respondents, represent that packaging material attributes have the highest importance values, followed by container colour, information on packaging, and container shape.
Consumer choice to the level of the attributes shown on the utility generates the value that consumers most liked packaging made of paper material, with a light colour packaging (white or beige), detail information, and the form of packaging which has compartment.
Segmentation is performed based on importance values respondents data, resulting in three clusters, that is cluster which prioritizes the attributes of packaging materials, cluster which prioritizes the container colour attribute, and the cluster that promotes information and forms of packaging. Each cluster has their own preference for the level-attribute combination. As for example, the cluster which prioritizes the attributes of packaging materials prefer the take-out food packaging with paper material, with a light colour packaging (white or beige), detail information, and the form of packaging which has compartment (it is the same level-attribute combination for all consumers).
References
[1] Binkley, M, et al (2008), “Consumer Perception of
Take out Food: Safe Handling Practices and Desired Package Attributes”
[2] Binkley, M., and Ghiselli, R. (2005), “Food safety issues and training methods for ready-to-eat foods in
the grocery industry”, Journal of Environmental
Health, Vol. 68 No. 3, pp. 27-31.
[3] Boyce, Janice, Broz, Charles C., and Binkley,
Margaret (2008), “Consumer Perspectives: Take out
Packaging and Food Safety”, British Food Journal, Volume 110 No. 8, pp. 819-828
[4] Goyal, Anita, and Singh, N.P., (2007), “Consumer Perception About Fast Food In India: An
Exploratory Study”, British Food Journal, Vol. 109
No. 2, pp. 182-195
[5] Hair Jr., Joseph F., et al., Multivariate Data
Analysis, Prentice-Hall, 2006, sixth edition
[6] Silayoi, Pinya, and Speece, Mark (2007), “The
Importance of Packaging Attributes: A Conjoint Analysis Approach”, European Journal of Marketing, Volume 41 No. 11/12, pp. 1495-1517 [7] Silayoi, Pinya, and Speece, Mark (2004),
“Packaging and purchase decision: An exploratory study on the impact of involvement level and time pressure”, British Food Journal, Volume 106 No. 8 pp. 607-628
[8] Surjandari, Isti, Conjoint Analysis: Konsep dan
Aplikasi, Penerbit Universitas Trisakti
References
[1] Binkley, M, et al (2008), “Consumer Perception of
Take out Food: Safe Handling Practices and Desired Package Attributes”
[2] Binkley, M., and Ghiselli, R. (2005), “Food safety issues and training methods for ready-to-eat foods in
the grocery industry”, Journal of Environmental
Health, Vol. 68 No. 3, pp. 27-31.
[3] Boyce, Janice, Broz, Charles C., and Binkley,
Margaret (2008), “Consumer Perspectives: Take out
Packaging and Food Safety”, British Food Journal, Volume 110 No. 8, pp. 819-828
[4] Goyal, Anita, and Singh, N.P., (2007), “Consumer Perception About Fast Food In India: An
Exploratory Study”, British Food Journal, Vol. 109
No. 2, pp. 182-195
[5] Hair Jr., Joseph F., et al., Multivariate Data
Analysis, Prentice-Hall, 2006, sixth edition
[6] Silayoi, Pinya, and Speece, Mark (2007), “The
Importance of Packaging Attributes: A Conjoint Analysis Approach”, European Journal of Marketing, Volume 41 No. 11/12, pp. 1495-1517 [7] Silayoi, Pinya, and Speece, Mark (2004),
“Packaging and purchase decision: An exploratory study on the impact of involvement level and time pressure”, British Food Journal, Volume 106 No. 8 pp. 607-628
[8] Surjandari, Isti, Conjoint Analysis: Konsep dan