61:2 (2013) 71–77 | www.jurnalteknologi.utm.my | eISSN 2180–3722 | ISSN 0127–9696
Full Paper
Jurnal
Teknologi
Development of Biomedical Image Processing Software Package for New
Learners
Nasrul Humaimi Mahmooda*, Lee Chen Hsienga, Siti Asmah Dauda
a
Biomedical Instrumentation and Electronics Research Group, Faculty of Electrical Engineering, Universiti Teknologi Malaysia, 81310 UTM Johor Bahru, Johor, Malaysia
*Corresponding author: [email protected]
Article history
Received :31 May 2012 Received in revised form :10 October 2012
Accepted :5 January 2013
Graphical abstract
Abstract
Biomedical image processing techniques involve a lot of mathematical equations and new learners need to calculate manually in order to analyze such techniques. It is therefore very important that they understand the biomedical image processing through live demonstration to add to their understanding of the techniques. This research will enable the biomedical students and staff, who are new learners in medical image processing, to use a software package that can analyze various techniques of biomedical image processing. It is one of the alternative ways to improve their learning process. Moreover, developing this user friendly software package using the Matrix Laboratory (MATLAB) will bring a lot of benefits to the users. Among the benefits of the software are shortening the time to process an image and helping the new learners to study about image processing because they can observe the particular object rather than just applying mathematical equations.
Keywords: Biomedical image processing techniques; images; MATLAB
Abstrak
Teknik-teknik pemprosesan imej perubatan melibatkan banyak persamaan matematik dan pengguna-pengguna atau pelajar-pelajar perlu mengira secara manual untuk menganalisis teknik-teknik tersebut. Pemahaman tentang pemprosesan imej perubatan adalah amat penting kepada pengguna-pengguna baru dan demonstrasi secara langsung boleh membawa manfaat bagi meningkatkan pemahaman mereka tentang teknik-teknik tersebut. Melalui kajian ini, pengguna-pengguna baru yang terdiri daripada staf dan pelajar perubatan akan mendapat banyak faedah dari pakej perisian baru ini. Salah satu cara yang boleh membantu mereka dalam menganalisis teknik-teknik pemprosesan imej perubatan adalah dengan menggunakan perisian tersebut. Perisian yang mesra pengguna tersebut dihasilkan dengan menggunakan MATLAB dan faedah-faedah yang boleh diperolehi oleh pengguna-pengguna adalah seperti masa yang diambil untuk pemprosesan imej akan berkurangan dan mereka juga akan memahami pemprosesan imej secara berkesan berbanding dengan hanya menggunakan persamaan-persaman matematik.
Kata kunci: Teknik-teknik pemprosesan imej perubatan; imej; MATLAB
© 2012 Penerbit UTM Press. All rights reserved.
1.0 INTRODUCTION
Biomedical image processing is any form of biomedical signal processing for which the input is a medical image, such as from various imaging modalities, i.e. MRI (Magnetic Resonance Imaging), CT (Computed Tomography) Scan and X-Ray. Most biomedical image processing techniques involve treating the biomedical image as a 2D signal and applying standard signal-processing techniques to it. There are a lot of works for certain applications that create a user friendly software package for understanding a particular task.
For example, ImageJ software can calculate area and pixel value statistics of user-defined selections. It can measure distances and angles. Images are normally used for documentation,
qualitative description and illustration of how phenomena occurred. If a user wants to calculate the number of blood cells in a dark image, he or she will find it difficult to calculate it because the image is unclear. Therefore, by using suitable image processing techniques, he or she can enhance the image so that the visibility of blood cells is obvious. From various applications, users can learn quickly on how Biomedical Image Processing techniques work through the analysis in the software package developed by using MATLAB Programming Tools.
greatly by using this software. However, there are also weaknesses in using this software. One of the disadvantages is that users cannot set the parameters of measurement for image segmentation.
Another developed software is a software package for medical imaging applications which is also known as HIPPOCRATES.2 It contains a lot of advanced routines which perform low level and high level image processing operations, while their modular structure helps in the development of any image related applications. Many software package features are available in HIPPOCRATES that is useful in medical image analysis. The main features are segmentation, edge detection, morphological operations and tools for handling ROIs (Region of interests).2 However, the 2D images cannot be processed using this software.
A software tools known as Duff is developed for visualization and processing the neuroimaging data.3 The main idea of this work is how the software package, namely Duff can provide synchronized visualization of multiple co-registered image volumes, surfaces, and curves. The result of this research is that the developed software is able to provide users with increased abilities to represent & interpret data of images. However, the visualization tools of this software are limited to the users. Next, an optimized Java based software package for biomedical images and volumes processing is developed called ImageJ and integrated with VTK (Visualization Toolkit), which offer a rich set of tools to visualize and process images and volumes.4 These two subsystems have been encapsulated into a common graphic interface, developed in Java, thus ensuring a simple and user friendly tool to open data, to choice between a series of image processing filters, measurement and graphical functionalities, and to switch between images and volumes analysis and processing. However, not all functionalities are available in the software yet.
2.0 THEORY
2.1 Biomedical Images
An image defined in the “real world” is considered to be a function of two real variables, for example, a (x, y) with a as the amplitude (e.g. brightness) of the image at the spatial/plane/real coordinate position (x, y).5 Biomedical images can be obtained from different imaging modalities, for instance MRI, CT Scan, X-Ray, ultrasonography and others. The file of those images is usually in TIFF (Tagged Image File Format), PNG (Portable Network Graphics), JPEG (Joint Photographic Experts Group) and others. Figure 1 shows biomedical images from different imaging modalities.
2.2 Image Processing Technique
By using image processing techniques, the appearance of an image can be improved. Furthermore, the qualitative measurement of an image can be carried out without have to do it manually and to bring out the obscure details of the image. Nowadays, there are various image processing techniques available. The three main image processing techniques available in the developed software are image enhancement, image filtering and image segmentation. Image enhancement is performed in order to make the processed image more suitable than the original image for a specific application. The main objectives for image enhancement are to sharpen the details of the images and also to smooth the images into more uniform regions. In image enhancement, the
common methods used are intensity transformation, contrast adjustment of image using histogram and spatial filtering. Image filtering technique is normally being carried out in the frequency domain via the Fourier Transform. By computing the spectrum of the Fourier Transform (i.e the magnitude of the transform), its transform can be analyzed visually. In order to sharpen an image, high pass filtering which only attenuating the low frequencies of the Fourier Transform is applied. On the other hand, low pass filtering is used to blur an image and also for noise reduction. The most effective filter in reducing noise is median filter.
In order to solve the graphical picture pattern-recognition and scene analysis problems effectively, it will be essential to begin with image segmentation. By observing the specific characteristics of the image processing problem, the appropriate choice of which segmentation method can be selected based on the applications. An image is subdivided into its constituent regions or objects by segmentation. Segmentation process would stop once the regions or objects of interest in an application have been isolated successfully.
3.0 METHODOLOGY
In our developed software package known as BIP, three main image processing techniques are available to analyze the biomedical images. The techniques are image enhancement, image filtering and image segmentation. At least three methods are developed for each image processing techniques respectively. Firstly, for image enhancement, intensity transformation, histogram and spatial filtering are included in the software. Next image processing technique is image filtering; the available methods are discrete Fourier Transform, smoothing and sharpening. Another technique that is available in the software package is image Segmentation which can perform various methods such as point, line and edge detection, thresholding and Hough Transform.
(a)
(c)
Figure 1 Different biomedical image from various medical imaging
modalities. (a) Brain MRI scan image, (b) Black and white photo of x-ray picture of human hands and (c) Brain computed tomography image
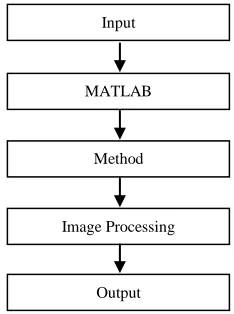
Various images are available as an input in the software. Users can choose those images and click on the buttons in the software to choose the specific image processing techniques to process the image. The desired output image will be displayed as a result. Figure 2 shows the flow chart of the process stages.
Figure 2 Flow chart of process stages
4.0 RESULTS AND ANALYSIS
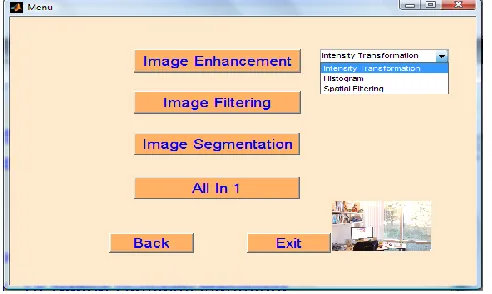
In order to make the software package is interactive, MATLAB’s GUIDE (Graphical User Interface Development Environment) is used to create buttons, pop-up menus and others so that users can choose the available options in the software. Figure 3 shows the Main Frame of the developed Biomedical Image Processing (BIP) software.6,8 The Main Frame of BIP consists of 3 buttons which are Start, Exit and Help. If the user clicks on Start button, the user will enter into the Menu frame (as shown in Figure 5) to choose the image processing techniques available. However, if the user chooses to click on the Exit button, the Main Frame will be closed (exit the program). While if Help button is selected, some basic information regarding BIP will be displayed in order to provide some guidance to new users as shown in Figure 4.
Figure 3 Main frame of the developed BIP software
All the methods listed in the Menu can be used to process the image depending on the users’ choice. Every method is applied in different ways in order to obtain the desired output. For instance, in order to enhance image contrast, users can select either intensity transformation or histogram method as shown in Figure 6. Both methods can be used in image enhancement.9
Figure 4 Basic information about BIP software is displayed when Help
button is clicked
Figure 5 Menu for the 3 main image processing techniques
Input
MATLAB
Method
Image Processing
Figure 6 Pop-up menu of image enhancement techniques when the Image Enhancement button is clicked
Figure 7 shows the GUI of intensity transformation which is used to enhance the image contrast. Simple steps on how to apply this method will be displayed if the user clicks on the Tutorial button. On the other hand, if the user suddenly decides to choose another method, the Back button can be used to change back to the Menu in Figure 5. If About Contrast in the GUI image is clicked, Figure 8 will be shown to display some basic information about how best contrast stretch image can be obtained using BIP.
Figure 7 Intensity Transformation is used to enhance the image contrast
Figure 8 Example of how best contrast stretch image can be obtained
using BIP.
Figure 9 Sliders are used to change the contrast of the image
Figure 9 shows that sliders can be used to change the contrast of the image according to the setting value by the user. In order to obtain the best contrast stretch of an image, the Auto option can be selected. The negative of an image (Negative Image option) means the output image is the reversal of the input image. In the case of an 8-bit image, the pixels with a value of 0 take on a new value of 255, while the pixels with a value of 255 take on a new value of 0. All the pixel values in between take on similarly reversed new values. The new image appears as the opposite of the original.
Figure 10 GUI for adjusting image contrast using histogram
specifications. Data from a histogram can aid you in contrast enhancement and thresholding. Figure 10 shows how the contrast of an image can also be adjusted using histogram by dragging the mouse over to the range of the desired gray level.
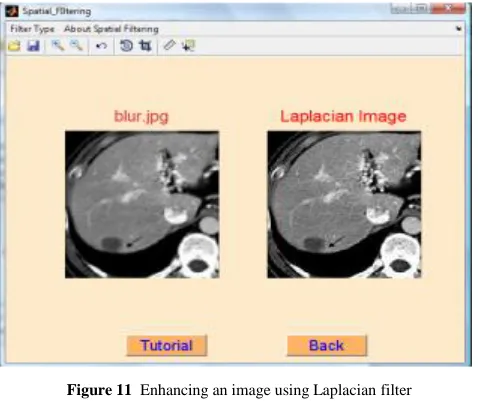
The process of linear spatial filtering consists of moving the center of the filter mask, w from point to point in an image, f. At each point (x, y) of an image, the response of the filter at that point is the sum of products of the filter coefficients and the corresponding neighborhood pixels in the area scanned by the filter mask. Figure 11 shows how a mildly blurred image can be enhanced using Laplacian filter.
Figure 11 Enhancing an image using Laplacian filter
(a) (b) (c) (d)
Figure 12 Visual analysis: (a) Original image, (b) Fourier Spectrum of
(a), (c) Noise image, (d) Fourier Spectrum of (c)
An image is a 2D collection of discrete signals that have frequencies associated with them. Discrete Fourier Transform can be used to determine the frequency content of an image. The 2-D Fourier Transform of images will reveal interesting properties that are shared by many images. Natural images could be distinguished from Non-Images such as noise by visualizing and analyzing the Fourier Spectrum produced. Different filters are used in different processing applications.
Visual analysis of the spectrum by displaying it as an image is an important aspect of working in the frequency domain. The low frequencies content of an image (bright spots) distinguishes the natural images (with bright spots) from the non-images (without bright spots). For better visualization, bright spots are moved to the center of the image. In Figure 12, for Fourier spectrum in (b), bright spots are displayed in the center while there are no bright spots in spectrum (d). This means that image (c) is not one of the natural images.
Figure 13 Median filters are used to reduce noise in the image
In image smoothing technique, median filter falls under the category of order statistics filters (non-spatial filter). A median filter is very effective in reducing noise and preserving the edges of an image. Utilizing median filtering, the center value of an output pixel is determined by the median of the neighborhood pixels as specified by the size of the mask. Other types of order statistics filters are max filters and min filters. Max filters are used to find the brightest point in the image and the center pixel will be replaced by the maximum value in the neighborhood. On the other hand, the center pixel will be replaced by the minimum value in the neighborhood for min filters. Figure 13 shows the effectiveness of median filter in reducing noise and preserving the edges of an image.
Figure 14 The unsharp masking filter sharpens the edges & details in the image.
Figure 15 The edges of image can be detected by using Canny method
The most powerful edge-detection method that edge provides is the Canny method. The Canny method differs from the other edge-detection methods in that it uses 2 different thresholds (to detect strong & weak edges) & includes the weak edges in the output only if they are connected to strong edges as shown in Figure 15. This method is therefore less likely than the others to be fooled by noise & more likely to detect true weak edges.
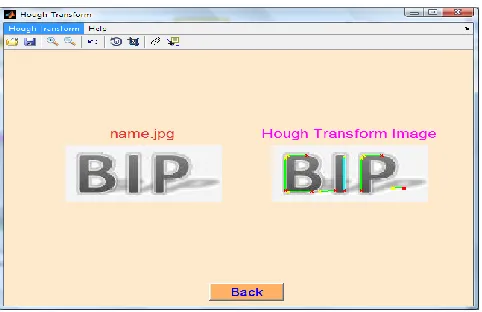
Figure 16 Detecting the lines in the image by using Hough transform
Hough Transform can be used to find and link line segments in an image. This approach detects lines even if they are disrupted by noise or only partially visible. A point (X(i), Y(i)) will be considered and all the lines passing through this point has to satisfy the slope-intercept equation Y(i) = mX(i) + c for some values of m and c where c and m are the offset and slope of the line respectively.
A better parameterization of a straight line is given by using two different parameters with finite values. One possibility is to take the angle of the slope of the line and the distance of the line from the center of the coordinate system. Figure 16 shows the blue line of the image as the longest line segment in the image by applying Hough Transform.
Thresholding normally results in binary image. Any point for which f(x, y) >T is called an object point where the pixels labeled as 1(white). Otherwise the point is called a background point where the pixels labeled as 0 (black). The thresholded image, g(x, y) is defined as pixels labeled 1 or 0 depending on the conditions. Figure 17 shows the result of thresholding using an Otsu threshold method.
Figure 17 Image produced using Otsu threshold method:
Original Image (left), Otsu thresholded Image (right)
5.0 CONCLUSION
In conclusion, the BIP software is successfully developed with various interactive applications installed in it. Based on the results obtained by processing the images using BIP, various image processing techniques can be performed easily without having to calculate it manually using mathematical equations. Further improvements could be made by adding more image processing techniques into the software package. For example, such techniques like image registration, morphological image processing and others could be included in the software. Additional toolbars also can be included in the software such as calculating the number of objects in an image or any biomedical image analysis.
Acknowledgement
This paper is a part of a publication series on Research and Development in Signal, Image and Sensors in Biomedical Engineering Applications. The authors would like to express their most gratitude to all staffs and students in Medical Electronics Laboratory, Faculty of Electrical Engineering, Universiti Teknologi Malaysia for supporting this study by contributing in terms of time and equipment. This work is also sponsored by Centre of Teaching and Learning UTM under “Dana Pembangunan Pengajaran” grant.
References
[1] C. A. Zaffari, P. Zaffari, D. F. G. de Azevedo, T. Russomano, T. Helegda, and M. V. Figueira. 2006. A Program for Medical Visualization and Image Processing. 28th IEEE EMBS Annual International
Conference. New York City: 5790–5793.
[2] N. Yoldassis, S. Kotsopoulos, V. Zoupas, and D. Lymberopoulos. 1993. HIPPOCRATES: A New Software Package for Medical ImagingApplications. IEEE 15th Annual International Conference. 1062– 1063.
[3] D. W. Shattuck, A. MacKenzie-Graham, and A. W. Toga. 2004. Duff: Software Tools for Visualization and Processing of Neuroimaging Data.
IEEE International Symposium on Biomedical Imaging. 644–647.
[4] A. Maurizi, D. Franchi and G. Placidi. 2009. An Optimized Java Based Software Package for Biomedical Images and Volumes Processing. IEEE
International Workshop on Medical Measurement and Applications.
219–222.
[5] R. C. Gonzalez, R. E. Woods and S L. Eddins. 2004. Digital Image
Processing using MATLAB. 3rd ed. Upper Saddle River, N. J.: Prentice
[6] T. A. Davis and K. Sigmon. 2005. MATLAB Primer.7th Edition, Boca Raton, Florida: Chapman & Hall/CRC.
[7] A. Sitt. 2005. 123RF Stock Photos. Health & Medical Images. Retrieved on June 10. 2012, from http://www.123rf.com.
[8] P. Marchand and O. T. Holland. 2003. Graphics and GUIs with
MATLAB. 3rd ed. Boca Raton, Florida: Chapman & Hall/CRC.