Article
1
Effects of Fluoride on Two Chemical Models of
2
Enamel Demineralization
3
Ollie Yiru Yu 1, May Lei Mei 1, Edward Chin Man Lo 1 and Chun-Hung Chu 1,*
4
1 Faculty of Dentistry, The University of Hong Kong; [email protected] (O.Y.Y.); [email protected] (M.L.M.);
5
[email protected] (E.C.M.L.)
6
* Correspondence: [email protected]; Tel.: +852 2859 0287
7
Abstract: This study evaluated the effects of fluoride on subsurface enamel demineralization
8
induced by two commonly used chemical models. Forty-eight enamel blocks were demineralized
9
at pH=5.0 by an acetate buffer (Group 1), a lactate buffer (Group 2), an acetate buffer with 0.02ppm
10
fluoride (Group 3) and a lactate buffer with 0.02ppm fluoride (Group 4) at 25°C for 3 weeks. The
11
surface destruction percentage (SDP), mineral loss and lesion depth of the blocks were studied using
12
micro-computed tomography. An elemental analysis of the enamel surface was evaluated using an
13
energy-dispersive X-ray spectroscopy. Surface micro-hardness was determined by the Knoop
14
Hardness Test. The mean lesion depth of Groups 1 through 4 were 134.1±27.2μm, 96.1±16.5μm,
15
97.5±22.4μm and 91.1±16.2μm, respectively (p<0.05; group 1>2,3>4). The SDPs of groups 1 through
16
4 were 7.8±8.93%, 0.71±1.6%, 0.36±1.70% and 1.36±2.94% (p<0.01; group 1>2, 3, 4). The fluoride in
17
mean weight percentages of groups 1 through 4 were 1.12±0.24%, 1.10±0.20%, 1.45±0.40% and
18
1.51±0.51%, respectively (p<0.01; group 3,4>1,2). The mean Knoop hardness values of groups 1
19
through 4 were 27.5±13.3, 39.7±19.3, 73.6±44.2 and 91.0±57.2, respectively (p<0.01; group 4>3>2>1).
20
The chemical model using an acetate buffer solution created significantly deeper zones of subsurface
21
demineralization on enamel than the lactate buffer solution. An acetate buffer may damage the
22
enamel surface, but the surface damage can be prevented by adding fluoride.
23
Keywords: demineralization; enamel; fluoride
24
25
1. Introduction
26
Although enamel is the most acid-resistant substance in the human body, it is constantly
27
subjected to the presence of cariogenic plaque along with the presence of fermentable carbohydrates.
28
The demineralization process happens when the environmental acidity (pH) drops below a certain
29
level (critical pH) [1]. The main component of enamel is the hydroxyapatite crystal composition of
30
the enamel prism. The columnar prisms are the basic structures of enamel. The space between the
31
columnar prisms is filled with organic components and water. Saliva and plaque fluid are not
32
saturated with calcium and phosphate when the pH drops. This is when the dissolution of the enamel
33
happens. As the demineralization goes on, the substantial deficiency appears. The construction of the
34
enamel is different from dentine. Mineral components make up 85% of enamel’s volume, while the
35
other 15% consists of organic components and water [2]. This is different from the structure of
36
dentine, in which the matrix is comprised of collagen. The inter-prism substance of enamel is not
37
strong enough to sustain the framework. Therefore, it is easier to find substantial deficiencies in
38
enamel demineralization models. In current cariology research, one important way to observe the
39
effect of remineralization is to evaluate the density of demineralized enamel tissue. However, once
40
the substantial deficiency occurs, the effect of arresting caries and enamel tissue remineralization are
41
difficult to be observed. Thus, when creating carious lesions, it is important to create subsurface
42
lesions, which are lesions with intact surface.
43
A recent review found in vitro studies is the most common the mechanistic studies on cariology
44
[3]. Among these in vitro studies, most studies used simple mineralization chemical models to
45
generate artificial carious lesions [3]. These models employ acidic demineralization agents to generate
46
demineralized lesions. Mild organic acids and acid buffers such as lactic acid and acetate acid are the
47
most commonly used to create demineralized lesions. These acid buffers can create demineralized
48
lesions to mimic caries lesions. Generally, a solution with a stable pH value is used to create artificial
49
caries. The acidity to create a subsurface lesion ranges from pH 4.4 to 5.0 in most studies [3]. They
50
have obvious advantages such as time and cost saving, controllable experimental conditions,
51
reproducibility of the experiment and simplicity of the studies [4]. In in vitro chemical models, the
52
demineralization process is simplified to the interaction between substrates and acid—the metabolic
53
production of biofilm. The properties of the caries-like lesions can be regulated by factors such as pH,
54
time, temperature, mineral concentration and presence of mineral dissolution inhibitors [5]. By
55
modifying these factors, the characteristics of lesions such as lesion depth, mineral loss ratio and
56
distribution of mineral lost can be controlled [6]. A chemical model is a compromise between the
57
reality of the in vivoecosystem and the simplification of the system. Recent studies have compared
58
carious lesions created by in vitro chemical protocol to natural carious lesions. The result show that
59
artificial caries induced by chemical models exhibited several characteristics similar to natural caries
60
[6]. Hence, these lesions were regarded as acceptable and were used in a lot of cariology research to
61
create enamel lesions.
62
Fluoride is commonly used for caries control. The presence of fluoride in saliva make it a natural
63
remineralization solution. Even a low concentration of fluoride is effective in interrupting the
64
demineralization process. When the pH drops below 5.5 but remains higher than 4.5, the
65
hydroxyapatite is dissolved and fluorapatite starts to generate [7]. As the solubility of the fluorapatite
66
is lower than that of hydroxyapatite, the enamel dissolution process will slow down. The enamel’s
67
continuously lost calcium and phosphorus will be recovered as fluorapatite [8]. Hence, to decrease
68
the severity of the destruction to the demineralized tissue, some researchers add fluoride into the
69
demineralization solutions to create subsurface lesions [9, 10]. However, the effect of fluoride on
70
different chemical caries models has not been previously explored. The purpose of the study is to
71
evaluate the effect of low concentrations of fluoride on two commonly used chemical models.
72
2. Results
73
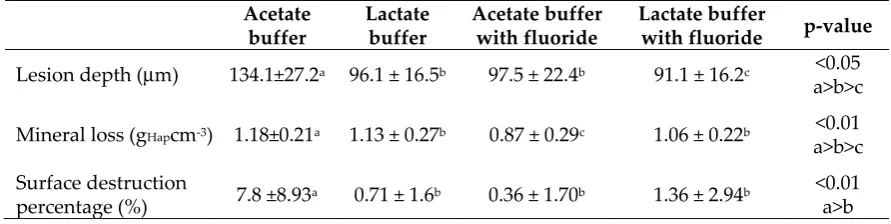
Table 1 shows the mean lesion depth, mineral loss and surface destruction percentages of the
74
four experimental groups. The reconstructed micro-CT images of the four groups were present in
75
Figure 1.
76
Table 1. Mean lesion depth, mineral loss and surface destruction percentage of the four experimental groups.
77
Acetate buffer
Lactate buffer
Acetate buffer with fluoride
Lactate buffer
with fluoride p-value
Lesion depth (μm) 134.1±27.2a 96.1 ± 16.5b 97.5 ± 22.4b 91.1 ± 16.2c <0.05
a>b>c
Mineral loss (gHapcm-3) 1.18±0.21a 1.13 ± 0.27b 0.87 ± 0.29c 1.06 ± 0.22b <0.01
a>b>c
Surface destruction
percentage (%) 7.8 ±8.93a 0.71 ± 1.6b 0.36 ± 1.70b 1.36 ± 2.94b
<0.01 a>b
79
Figure 1. Representative images of reconstructed micro-computed tomography of the four
80
experimental groups.
81
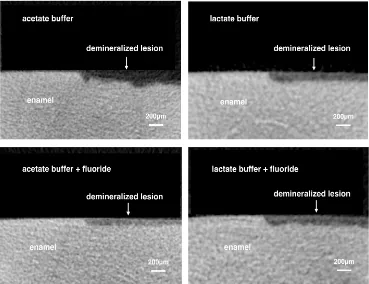
Representative SEM images showing the enamel surface morphology of the four groups are
82
shown in Figure 2. SEM/EDX showed that the fluoride in the mean weight percentage (±SD) of
83
groups 1 through 4 were 1.12±0.24%, 1.10±0.20%, 1.45±0.40% and 1.51±0.51%, respectively.
84
(p<0.01; group 3, 4 >1, 2). The mean Knoop hardness values (±SD) of group 1 to 4 were 27.5±13.3,
85
39.7±19.3, 73.6±44.2, 91.0±57.2, respectively (p<0.01; group 4>3>2>1).
86
87
Figure 2. Surface morphology of enamel of the four experimental groups.
3. Discussion
89
Chemical models simplify the caries formation process to a pure demineralization process,
90
because they use simple demineralization agents of low pH value (usually acid) to demineralize
91
enamel [3]. Acid buffers are commonly used to create artificial caries lesions because they can create
92
demineralized enamel lesions that are more similar to natural caries than inorganic acids. In general,
93
one single solution with a stable pH value is used to create artificial caries. This method was used by
94
many researchers, because they save time and because the experiment operation is straightforward.
95
Another advantage of this method is that the extent of demineralization can be controlled by
96
adjusting the conditions including acidity, temperature and duration of the demineralization [5]. The
97
pH value of the demineralization solutions used mostly ranged from 4.4 to 5.0, according to the study
98
designs. A pH at 5.0 was chosen in this study to prevent the unwarranted demineralization of the
99
enamel surface. Like most chemical models, this model could induce a higher mineral loss ratio than
100
natural caries [6]. Furthermore, the basic design of this chemical model is simple and cannot simulate
101
the complicated process of natural caries development.
102
103
Lactic acid and acetate acid are the common acid-buffer solutions used in chemical models to
104
create demineralized lesions or artificial caries for cariology research [11-13]. Hence, they were
105
chosen in this study. Researchers suggested that lactate acid could dominate in active caries, while
106
acetate acid was often associated with arrested caries lesions [14]. An in vitro study showed that lactic
107
acid was more effective than other organic acids for demineralization and creating carious lesion [15].
108
Lactic acid with an acid dissociation constant (pKa) of 3.86 is lower than that of acetic acid (pKa =
109
4.76) at 25°C. However, this study found that the acetate buffer created deeper lesions than the lactate
110
buffer at the same pH value. This might be because the unionized acid concentration of acetic acid is
111
higher than that of lactic acid [15]. The unionized acid could diffuse and get into the enamel. Then, it
112
could continuously release hydrogen ions (H+) and dissolve the hydroxyapatite crystal. Another
113
reason might be the use of tetraethyl methyl diphosphonate. It is a dissolution inhibitor that prevents
114
the aggressive demineralization of enamel by lactate acid [16, 17].
115
116
The physical and mechanical properties of these artificial carious lesions would influence the
117
subsequent demineralization and remineralization process and even the results of the experiment
118
[18]. In clinical situations, an early carious lesion on the smooth enamel surface of enamel is
119
manifested as a white spot lesion. Histologically, they might be classified into four zones: surface
120
layer, body of lesion, dark zone and translucent zone [19]. The surface layer formation in natural
121
caries lesions might be caused by the presence of demineralization inhibitors such as the fluoride and
122
proteins in saliva [20]. The fluoridation of drinking water and the use of fluoridated anti-caries
123
products such as fluoride toothpaste are the two common sources of fluoride. The fluoride was stored
124
in the oral cavity and released slowly [21]. Fluoride can also be found in saliva, but the concentration
125
is very low and normally at a sub-ppm level. In this study, the enamel blocks were continuously
126
subject to acid challenge. Because of the absence of the remineralization process or a demineralization
127
inhibitor, the subsurface porosity kept developing and resulted in the consolidation of porosities and
128
cavitation [22]. Susceptible enamel became increasingly vulnerable in this process. Finally, the carious
129
enamel tissue collapsed and exposed the irregular surface. However, in the presence of low
130
concentrations of fluoride, the carious formation process slowed down. The demineralization process
131
continued, but remineralization took place on the enamel block’s surface. As a result, a surface layer
132
with a higher mineral density than the lesion body was formed. Thus, adding low concentrations of
133
fluoride to a demineralizing solution of a chemical caries model could generate a caries-like lesion,
134
which simulates natural carious lesions. EDX and Knoop micro-hardness testing were used to
135
compare the surface differences of the specimens in the study’s four experimental groups. The results
136
confirmed that the fluoride content on the enamel surface of the demineralized lesion increased when
137
fluoride was added to the acid buffer solutions.
In this study, the addition of fluoride to the acetate buffer solution had a more profound
140
demineralizing effect than that the lactate buffer. This may have contributed to the higher dissolution
141
rate of acetic acid. While the hydroxyapatite dissolved, the fluorapatite might have formed in the
142
remineralization–demineralization process. In addition, the lactate buffer solution contained
143
TEMPD, which is an enamel demineralization inhibitor and could have slowed down the dissolution
144
rate of hydroxyapatite.
145
146
The results of the lesion depth and surface loss percentages showed that, among the four
147
experimental groups, the acetate buffer solution created the deepest lesions. However, it also created
148
significantly greater surface loss than the other three experimental groups. The results concurred with
149
previous studies, which found that the properties of caries-like lesions could be controlled [6, 18, 23].
150
This study found that fluoride could prevent damage to the enamel surface by the acid challenge.
151
The addition of fluoride and TEMDP would affect the presence of the surface layer and the rate of
152
dissolution. Thus, the extent of demineralization could be manipulated [6, 18, 23].
153
154
4. Materials and Methods
155
4.1 Preparation of enamel blocks
156
Extracted human sound third molars were collected with the patient’s consent. The molars were
157
stored in a 0.5% thymol solution at 4°C before its use (pH 7.0). Enamel slices with 2 mm thickness
158
were prepared from the molars. Using sanding paper of micro-fine 4,000 grid, the enamel surfaces of
159
the slices were polished until smooth. Each slice was sectioned into four enamel blocks, which were
160
allocated into four treatment groups for the experiment. Each set of the four enamel blocks were
161
individually examined with a stereomicroscope (x10). The set of four enamel blocks were excluded if
162
cracks or other defects such as enamel opacity or hypoplasia were found. The proper enamel blocks
163
were half covered with acid-resistant nail polish (Clarins, Paris, France) to create a self-control region
164
as a reference for the evaluation.
165
The four enamel blocks prepared from the same enamel slice were allocated into four treatment
166
groups for demineralization. Blocks allocated into Group 1 were demineralized with an acetate buffer
167
solution (pH 5.0) containing 50 mM acetate buffer, 2.2 mM calcium chloride (CaCl2), 2.2 mM
168
potassium dihydrogen phosphate (KH2PO4) and 0.02% sodium azide (NaN3) [24]. Blocks in Group 2
169
were demineralized with a lactate buffer solution (pH 5.0) containing 50mM lactate buffer, 3 mM
170
CaCl2, 3 mM KH2PO4, 6 µM tetraethyl methyl diphosphonate (TEMDP) and 0.02% NaN3 [16]. Blocks
171
in Group 3 were demineralized with the acetate buffer solution (Group 1) with sodium fluoride (NaF)
172
with a fluoride (F) concentration at 0.02 ppm. The blocks in Group 4 were demineralized with the
173
lactate buffer solution with NaF with 0.02 ppm F. Each enamel block was immersed in 1mL of
174
respective solution at 25°C for 21 days. The demineralizing solution was refreshed regularly every 24
175
hours. Twelve enamel blocks were demineralized in each experimental group for assessment.
176
4.2 Assessment of enamel demineralization
177
4.2.1 Lesion depth, mineral loss and surface destruction
178
Lesion depth, mineral loss and surface integrity of the enamel blocks were evaluated by X-ray
179
micro-computed tomography (Micro-CT) (SkyScan 1172; SkyScan, Antwerp, Belgium). The X-ray
180
source was operated at a source voltage of 80 kV and a current of 100 uA. The pixel size of the image
181
was set as 6 µm. A 0.5 mm aluminium filter was used to cut off the softest X-rays. The scanning results
182
for each specimen were reconstructed using the NRecon reconstruction software (SkyScan, Antwerp,
183
Belgium). The reconstructed three-dimensional images were viewed and processed using the data
184
analysing software, CTAn (SkyScan, Antwerp, Belgium). Approximately 600 cross-sectional images
of each enamel block were obtained from the reconstructed three-dimensional image. Twenty images
186
were randomly selected from these cross-sectional images for assessment. An image area with a
187
grayscale value of more than 95% of the untreated enamel (internal control) was defined as sound
188
enamel [25]. Software (Image J; National Institutes of Health, MD, USA) with a plot profile was used
189
for the image analysis. The areas of demineralized enamel were determined, and the depth of the
190
lesions were measured.
191
The greyscale value was calculated into mineral density value (MDV, gHApcm-3) by CTAn. Two
192
mineral cylindrical phantoms with the MDVs of 0.25 gHApcm-3and 0.75 gHApcm-3were used for the
193
calibration. The mean MDV of the demineralized area of each specimen was evaluated. Mineral loss
194
(ΔZ; gHApcm-3) was calculated by subtracting the MDV of the demineralized area from the MDV
195
obtained from the area of sound enamel before demineralization [26]. A region of interest (ROI) of
196
the Micro-CT image with an area of 720 µm in width and 240 µmin depth was chosen to assess the
197
enamel surface destruction (Figure 3). Five ROIs were selected from each enamel block. The greyscale
198
value of more than 40 % was set as remaining enamel tissue. The surface destruction percentage
199
(SDP), which was the ratio of the surface destruction area and ROI, was calculated by CTAn.
200
201
Figure 3. Illustration of choosing surface destruction area. Surface destruction percentage = area of
202
surface destruction/area of region of interest.
203
4.2.2 Elemental analysis
204
The enamel blocks were ultrasonically washed in distilled water three times, dehydrated in
205
a series of ethanol solutions, dried in a desiccator and finally sputter-coated with carbon. The
206
surface morphology of the enamel blocks were then examined under a scanning electron
207
microscopy (SEM) (Hitachi S-4800 FEG Scanning Electron Microscope, Hitachi Ltd., Tokyo,
208
Japan) at 5 kV in high-vacuum mode. An elemental analysis was then carried out to study the
209
fluoride (F) ions on the enamel lesion surface by an energy-dispersive X-ray spectroscopy (EDS)
210
under SEM. The elemental analysis was performed by measuring three areas (5×5 µm2) on the
211
surface in each enamel block, and the mean weight percentages of F was calculated.
212
4.2.3 Surface micro-hardness
214
Surface micro-hardness of the enamel blocks was tested by a Knoop Hardness Tester (Leitz,
215
Micro-hardness Tester; Ernst Leitz Wetzlar GmbH, Wetzlar, Germany) after 3 weeks of
216
demineralization. The enamel block was placed under the Knoop indenter of the tester. Twenty
217
indentations were made on the intact area of the lesion surface side of each enamel block with a
218
load of 5 gf (49×10-3 N) for 10 s at each test point [27]. The indentations were approximately 100
219
µm from each other. The mean Knoop hardness numbers (KHN) was calculated for reporting
220
and analysis.
221
4.2.4 Statistical analysis
222
Our pilot study found that the mean lesion depth of the test group was approximately 100
223
µm. This study aimed to detect a difference of at least 20 µm. Assuming a common standard
224
deviation of 20 µm and with power at 0.8, the sample size required at least ten enamel blocks in
225
each group. Statistical analyses were conducted using IBM SPSS Statistics 22 software (IBM
226
Corporation, Armonk, New York, USA). All data were assessed using the Shapiro–Wilk test for
227
normality (p>0.05). A one-way ANOVA was performed, and the significance level was set at 5
228
%.
229
5. Conclusions
230
The effect of fluoride on demineralised enamel lesions created by a lactate buffer is not
231
significant. The surface integrity of the demineralised enamel lesion created by an acetate buffer can
232
be preserved in the presence of fluoride. Adding fluoride to chemical models using an acetate buffer
233
is recommended when creating artificial carious lesions.
234
Acknowledgments: This study is supported by HKU Seed Fund for Basic Research 201511159142.
235
Author Contributions: Ollie Yiru Yu, May Lei Mei and Chun-Hung Chu conceived and designed the
236
experiments. Ollie Yiru Yu performed the experiments and analyzed the data. May Lei Mei and Chun-Hung
237
Chu supervised the laboratory work. Ollie Yiru Yu and Chun-Hung Chu wrote the paper. Edward Chin Man
238
reviewed and edited the manuscript. All authors read and approved the final manuscript.
239
Conflicts of Interest: The authors declare no conflict of interest.
240
241
Abbreviations
242
SDP surface destruction percentage CaCl2 calcium chloride
KH2PO4 potassium dihydrogen phosphate NaN3 sodium azide
TEMDP tetraethyl methyl diphosphonate NaF sodium fluoride
F fluoride
Micro-CT micro-computed tomography MDV mineral density value
ROI region of interest
SEM scanning electron microscopy
EDS energy-dispersive X-ray spectroscopy KHN Knoop hardness numbers
References
243
1. West, N. X.; Joiner, A., Enamel mineral loss. Journal of dentistry 2014, 42, S2-S11.
244
2. Buzalaf, M. A.; Pessan, J. P.; Honorio, H. M.; ten Cate, J. M., Mechanisms of action of fluoride for caries
245
control. Monogr Oral Sci 2011, 22, 97-114.
3. Yu, O. Y.; Zhao, I. S.; Mei, M. L.; Lo, E. C.-M.; Chu, C.-H., A Review of the Common Models Used in
247
Mechanistic Studies on Demineralization-Remineralization for Cariology Research. Dentistry Journal 2017,
248
5, (2), 20.
249
4. Xuelian, H.; Qiang, G.; Biao, R.; Yuqing, L.; Xuedong, Z., Models in Caries Research. In Dental Caries,
250
Springer: 2016; pp 157-173.
251
5. Marquezan, M.; Correa, F. N. P.; Sanabe, M. E.; Rodrigues, L. E.; Hebling, J.; Guedes-Pinto, A. C.; Mendes,
252
F. M., Artificial methods of dentine caries induction: A hardness and morphological comparative study.
253
Archives of oral biology 2009, 54, (12), 1111-1117.
254
6. Schwendicke, F.; Eggers, K.; Meyer-Lueckel, H.; Dorfer, C.; Kovalev, A.; Gorb, S.; Paris, S., In vitro
255
Induction of Residual Caries Lesions in Dentin: Comparative Mineral Loss and Nano-Hardness Analysis.
256
Caries Res 2015, 49, (3), 259-265.
257
7. Ten Cate, J.; Larsen, M. J.; Pearce, E.; Fejerskov, O., Chemical interactions between the tooth and oral fluids.
258
In Dental caries. The disease and its clinical management, Blackwell Publishing Ltd: 2008.
259
8. Cury, J.; Tenuta, L., How to maintain a cariostatic fluoride concentration in the oral environment. Advances
260
in dental research 2008, 20, (1), 13-16.
261
9. Hicks, M. J.; Flaitz, C. M., Enamel caries formation and lesion progression with a fluoride dentifrice and a
262
calcium-phosphate containing fluoride dentifrice: a polarized light microscopic study. ASDC J Dent Child
263
2000, 67, (1), 21-8, 8.
264
10. Queiroz, C. S.; Hara, A. T.; Paes Leme, A. F.; Cury, J. A., pH-cycling models to evaluate the effect of low
265
fluoride dentifrice on enamel de- and remineralization. Brazilian dental journal 2008, 19, (1), 21-7.
266
11. Lippert, F.; Juthani, K., Fluoride dose-response of human and bovine enamel artificial caries lesions under
267
pH-cycling conditions. Clinical oral investigations 2015, 19, (8), 1947-1954.
268
12. Yang, Y.; Lv, X. P.; Shi, W.; Li, J. Y.; Li, D. X.; Zhou, X. D.; Zhang, L. L., 8DSS-Promoted Remineralization
269
of Initial Enamel Caries In Vitro. Journal of dental research 2014, 93, (5), 520-524.
270
13. Kiranmayi, M.; Nirmala, S.; Nuvvula, S., Appraisal of the remineralizing potential of child formula
271
dentifrices on primary teeth: An in vitro pH cycling model. Contemporary clinical dentistry 2015, 6, (Suppl
272
1), S81.
273
14. Hojo, S.; Komatsu, M.; Okuda, R.; Takahashi, N.; Yamada, T., Acid Profiles and Ph of Carious Dentin in
274
Active and Arrested Lesions. Journal of dental research 1994, 73, (12), 1853-1857.
275
15. Chien, Y. C.; Burwell, A. K.; Saeki, K.; Fernandez-Martinez, A.; Pugach, M. K.; Nonomura, G.; Habelitz, S.;
276
Ho, S. P.; Rapozo-Hilo, M.; Featherstone, J. D.; Marshall, S. J.; Marshall, G. W., Distinct decalcification
277
process of dentin by different cariogenic organic acids: Kinetics, ultrastructure and mechanical properties.
278
Archives of oral biology 2016, 63, 93-105.
279
16. Buskes, J. A. K. M.; Christoffersen, J.; Arends, J., Lesion Formation and Lesion Remineralization in Enamel
280
under Constant Composition Conditions - a New Technique with Applications. Caries Res 1985, 19, (6),
490-281
496.
282
17. Arends, J.; ten Bosch, J. J., Demineralization and remineralization evaluation techniques. Journal of dental
283
research 1992, 71 Spec No, 924-8.
284
18. Moron, B. M.; Comar, L. P.; Wiegand, A.; Buchalla, W.; Yu, H.; Buzalaf, M. A. R.; Magalhaes, A. C., Different
285
Protocols to Produce Artificial Dentine Carious Lesions in vitro and in situ: Hardness and Mineral Content
286
Correlation. Caries Res 2013, 47, (2), 162-170.
287
19. Buchalla, W., Histological and Clinical Appearance of Caries. In Caries Management - Science and Clinical
288
Practice, 1 ed.; Hendrik, M.-L. P., Sebastian; Effenberger, Susanne; Ekstrand, Kim R., Ed. Thieme: New York,
289
2013; pp 39-63.
290
20. Skucha-Nowak, M.; Gibas, M.; Tanasiewicz, M.; Twardawa, H.; Szklarski, T., Natural and Controlled
291
Demineralization for Study Purposes in Minimally Invasive Dentistry. Advances in Clinical and Experimental
292
Medicine 2015, 24, (5), 891-898.
293
21. ten Cate, J. M., Contemporary perspective on the use of fluoride products in caries prevention. British dental
294
journal 2013, 214, (4), 161-167.
295
22. Banerjee, A., Minimal intervention dentistry: part 7. Minimally invasive operative caries management:
296
rationale and techniques. British dental journal 2013, 214, (3), 107-111.
297
23. Magalhaes, A. C.; Moron, B. M.; Comar, L. P.; Wiegand, A.; Buchalla, W.; Buzalaf, M. A. R., Comparison of
298
Cross-Sectional Hardness and Transverse Microradiography of Artificial Carious Enamel Lesions Induced
299
by Different Demineralising Solutions and Gels. Caries Res 2009, 43, (6), 474-483.
24. ten Cate, J. M.; Duijsters, P. P., Alternating demineralization and remineralization of artificial enamel
301
lesions. Caries Res 1982, 16, (3), 201-10.
302
25. Liu, B. Y.; Lo, E. C. M.; Li, C. M. T., Effect of silver and fluoride ions on enamel demineralization: a
303
quantitative study using micro-computed tomography. Australian dental journal 2012, 57, (1), 65-70.
304
26. Hamba, H.; Nikaido, T.; Sadr, A.; Nakashima, S.; Tagami, J., Enamel Lesion Parameter Correlations
305
between Polychromatic Micro-CT and TMR. Journal of dental research 2012, 91, (6), 586-591.
306
27. Chu, C. H.; Lo, E. C. M., Microhardness of dentine in primary teeth after topical fluoride applications.
307
Journal of dentistry 2008, 36, (6), 387-391.