RESEARCH
The availability of intensive care unit (ICU) resources varies widely among low-, middle- and high-income countries, with demand exceed-ing capacity in many settexceed-ings.[1] The decision to admit patients to ICU
has to take into consideration available resources and the likelihood of a successful outcome.[2] Admission criteria should therefore assess
whether ICU will add value to the patient’s overall management and eventual outcome, and consider that a patient’s health status, diagnosis and severity of illness all influence his/her risk of death.[3]
Social factors determining access to health services include income, location and transport. These all contribute to a delay in presentation, possibly leading to more advanced disease and poorer outcomes. Access to social grants is associated with decreased illness and improved growth monitoring and therefore plays an important role in mitigating these factors.[4]
HIV has placed increased demands on health services in South Africa (SA),[5] with many infected children presenting in early infancy
with life-threatening illnesses. The introduction of antiretroviral (ARV) therapy has improved the outcome of HIV-infected children, leading to a review of paediatric ICU (PICU) admission criteria with greater accommodation of these children.[5]
Globally severe malnutrition affects 13 million children under the age of 5 years, with case fatality rates between 20% and 30%.[6] The
second highest burden is seen in sub-Saharan Africa.[6] A low weight
centile has been shown to be an independent risk factor for mortality in intensive care.[7]
Clinical scoring systems are objective measures that may be used to assess the performance of ICUs.[8] They can thus aid the
optimal use of PICU resources by evaluating the quality of medical care received. [9] The Pediatric Risk of Mortality (PRISM) score uses
clinical, physiological and laboratory variables in the first 24 hours of PICU admission, to attain a score assessing severity of illness. [10]
Although validated for use in the USA,[11] its validity in an SA
population has been questioned.[12] The Paediatric Index of Mortality
(PIM) score is a simpler tool using eight parameters to assess mortality risk on admission.[8] The latest version of PIM, PIM3, has
not been evaluated in an SA setting.
Additionally, organ dysfunction scores can be used to assess the severity of illness at various points during the ICU admission. The Pediatric Logistic Organ Dysfunction (PELOD) score is one such score quantifying organ dysfunction on admission or throughout the clinical course where parameters are collected daily.[13]
An eight-bed PICU was commissioned in Grey’s Hospital in 2003 with facilities to ventilate up to four patients simultaneously. This unit serves the 1.2 million children in the western half of KwaZulu-Natal, admitting patients from both inside and outside the hospital. Externally referred patients include those from hospitals within a 300-km radius of Pietermaritzburg. The decision to admit is made by the intensivist in charge of the unit, who balances multiple factors, including the availability of beds, the possibility of discharging patients and the stability for transfer of the patient.
In this study, demographic factors (age, gender, and source of referral), underlying health status (immunisation, nutritional and HIV status), diagnosis on admission and scoring systems (PRISM, PELOD and PIM3) were reviewed to assess their association with Background. The admission of children to an intensive care unit (ICU) necessitates the selection of children who will benefit most from scarce ICU resources. Decisions should be based on objective data available on outcomes related to particular conditions and resource availability.
Objective. To determine which sociodemographic factors and paediatric scoring systems can be used on admission to identify patients who would derive the most benefit.
Methods. A retrospective review was undertaken of the charts of children admitted to a paediatric ICU (PICU) over a 6-month period. Charts were analysed according to health status, biographical and demographic data, as well as Pediatric Risk of Mortality (PRISM), Pediatric Logistic Organ Dysfunction (PELOD) and Paediatric Index of Mortality 3 (PIM3) scores to determine which factors were associated with an increased mortality risk.
Results. Two hundred and two children were admitted during the study period. Ninety-six children were included in the study, 79 files were not found and 27 children were ineligible. The median age was 14 months and the mortality rate was 15.6%. The significant factor associated with mortality was severe malnutrition. In total 88% of required data were available for the calculation of both the PRISM and PELOD scores and 95% for PIM3 score. The PRISM, PELOD and PIM3 standardised mortality ratios were 2.5, 4.8 and 2.9, respectively. P-values for PRISM, PELOD and PIM3 were <0.05.
Conclusion. Severe malnutrition is a statistically significant factor in predicting mortality. This possibly reflects the social context in which the children live. PRISM, PELOD and PIM3 underpredict mortality in our setting. A larger sample is required to verify these outcomes and to determine whether other factors play a role.
S Afr J Child Health 2016;10(1):57-62. DOI:10.7196/SAJCH.2016.v10i1.1048
Factors present on admission associated with
increased mortality in children admitted to a
paediatric intensive care unit (PICU)
C L Hendricks,
1MB ChB, FC Paed (SA); N H McKerrow,
2MB ChB, BA, DCH (SA), FC Paed (SA), MMed (Paeds),
PG Dip Int Res Ethics; R J Hendricks,
3BComm Hons (Actuarial Science), Fellow of the Institute of Actuaries (FIA)
1 Department of Paediatrics and Child Health, Nelson R Mandela School of Medicine, Faculty of Health Sciences, University of KwaZulu-Natal, Durban, South Africa
2 Department of Paediatrics and Child Health, University of KwaZulu-Natal, Durban, and Department of Health, KwaZulu-Natal, South Africa
3 Independent consultant, Durban, South Africa
RESEARCH
survival in this setting. The purpose of the review was to establish more objective measures to be used in considering PICU admission.
Methods
The PICU admission register at Grey’s Hospital was screened to identify those patients meeting the inclusion criteria during the 6-month period, 1 January - 30 June 2011. A retrospective chart review was undertaken for all these admissions. Patients were identified from their clinical records retrieved from the medical records department. Inclusion criteria were age <13 years, first admission to PICU, and baseline blood investigations done within 3 hours of admission. Exclusion criteria were readmissions for the same condition during a single hospital stay, elective surgical procedures, and children in the home-based tracheotomy programme. Data were collected by the primary author (CLH) and one additional doctor. Data checks were performed in Microsoft Access (USA) by author RJH to identify missing or incorrect values, and these were corrected where possible.
The corrected data were entered into an Excel spreadsheet (Microsoft, USA) and statistical software EpiInfo 7 (Centers for Disease Control, USA) was used for analysis.
The nutritional classification of the study population is presented according to the nutritional classification mentioned in the clinical notes, the Wellcome classification for children older than 10 years and the World Health Organization (WHO) weight-for-age z-score (WAZ score) for those below 10 years of age. Surrogate WAZ scores were allocated to children older than 10 years as follows: weight above the 25th centile equated to a WAZ score >−2, weight between the 5th and 25th centile were classified as a WAZ score between −2 and −3 and those below the 5th centile were given a WAZ score <−3. Weights were documented for 95 patients but the heights were documented for only 18, making it impossible to apply the weight-for-height z-score (WHZ score).
The PRISM, PELOD and PIM3 scores were calculated according to the prescribed calculations.
The PRISM and PELOD data were ~88% complete (i.e. had ~12% missing data) while information for the PIM3 was 95% complete. In order to quantify the possible effect of missing data elements in PRISM and PELOD, normal values were allocated. PIM3 gives instructions on what to do if a data element is missing and this was applied accordingly. The deficiencies in the data were accounted for as accurately as possible.
The analysis assessed the association of biographical factors, health status and disease pattern, as well as PRISM, PELOD and PIM3 scores with outcome. A multivariate analysis analysed the relationship between age, grant
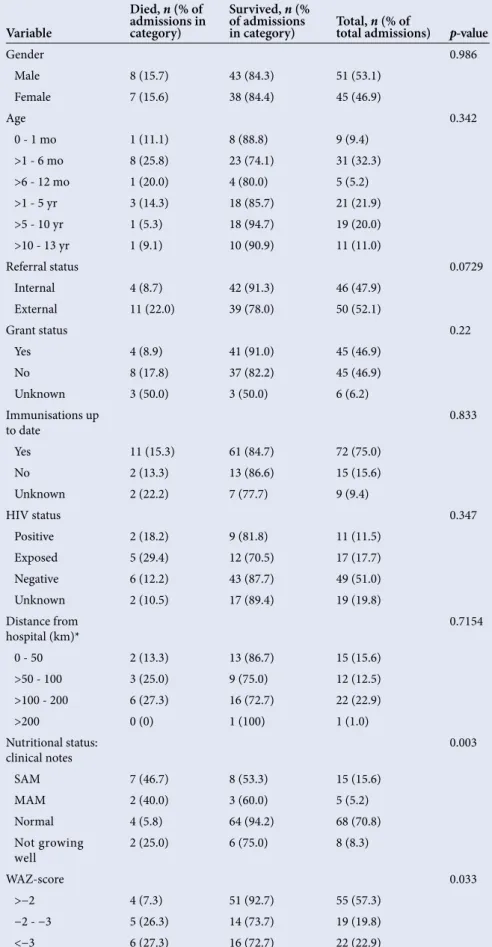
Table 1. Demographic characteristics
Variable
Died, n (% of admissions in category)
Survived, n (% of admissions
in category) Total, total admissions)n (% of p-value
Gender 0.986
Male 8 (15.7) 43 (84.3) 51 (53.1)
Female 7 (15.6) 38 (84.4) 45 (46.9)
Age 0.342
0 - 1 mo 1 (11.1) 8 (88.8) 9 (9.4)
>1 - 6 mo 8 (25.8) 23 (74.1) 31 (32.3) >6 - 12 mo 1 (20.0) 4 (80.0) 5 (5.2) >1 - 5 yr 3 (14.3) 18 (85.7) 21 (21.9) >5 - 10 yr 1 (5.3) 18 (94.7) 19 (20.0) >10 - 13 yr 1 (9.1) 10 (90.9) 11 (11.0)
Referral status 0.0729
Internal 4 (8.7) 42 (91.3) 46 (47.9) External 11 (22.0) 39 (78.0) 50 (52.1)
Grant status 0.22
Yes 4 (8.9) 41 (91.0) 45 (46.9)
No 8 (17.8) 37 (82.2) 45 (46.9)
Unknown 3 (50.0) 3 (50.0) 6 (6.2)
Immunisations up
to date 0.833
Yes 11 (15.3) 61 (84.7) 72 (75.0)
No 2 (13.3) 13 (86.6) 15 (15.6)
Unknown 2 (22.2) 7 (77.7) 9 (9.4)
HIV status 0.347
Positive 2 (18.2) 9 (81.8) 11 (11.5) Exposed 5 (29.4) 12 (70.5) 17 (17.7) Negative 6 (12.2) 43 (87.7) 49 (51.0) Unknown 2 (10.5) 17 (89.4) 19 (19.8) Distance from
hospital (km)* 0.7154
0 - 50 2 (13.3) 13 (86.7) 15 (15.6)
>50 - 100 3 (25.0) 9 (75.0) 12 (12.5) >100 - 200 6 (27.3) 16 (72.7) 22 (22.9)
>200 0 (0) 1 (100) 1 (1.0)
Nutritional status:
clinical notes 0.003
SAM 7 (46.7) 8 (53.3) 15 (15.6)
MAM 2 (40.0) 3 (60.0) 5 (5.2)
Normal 4 (5.8) 64 (94.2) 68 (70.8)
Not growing
well 2 (25.0) 6 (75.0) 8 (8.3)
WAZ-score 0.033
>−2 4 (7.3) 51 (92.7) 55 (57.3)
−2 - −3 5 (26.3) 14 (73.7) 19 (19.8)
<−3 6 (27.3) 16 (72.7) 22 (22.9)
RESEARCH
status and nutritional status. R2 is a number
indicating how well data fit the statistical model.
The Wald χ2 test was used to determine
significance using a 5% significance level. The outcome measures were death or survival. Ethical approval was obtained from the Biomedical Research Ethics Committee, University of KwaZulu-Natal.
Results
During the study period there were 202 ad-missions to Grey’s Hospital PICU. Seventy-nine files were not found and 27 patients were excluded, including 13 readmissions, 4 children older than 13 years and 10 patients admitted following elective surgery. Con-sequently, 96 patients were included in the analysis. Eight male and 7 female patients died, with a total mortality rate of 15.6%.
Table 1 illustrates the demographic data of the study population. Male patients constituted 53%. Ages ranged from 0 to 142 months with a median of 14 months. Forty-three percent were under 1 year of age, including nine neonates who were admitted when the neonatal ICU was full. Of the 15 deaths, 9 were of children under the age of 6 months (60.0%) even though this age group constituted only 22% of the total admissions. Two deaths (13.3%) occurred in children older than 5 years although this age group constituted 30% of admissions.
Forty-eight percent of admissions were internal referrals from within Grey’s Hospital and 52% were referred from outside. The mortality rate among internal referrals was 8.7% compared with 22.0% among those referred from outside the hospital. This difference was not statistically significant however, with a p-value of 0.0729.
The social grant status was known for 90 children, 50% of whom were receiving a grant. Of these, 42 were receiving a child support grant, 2 a care dependency grant and in 1 patient the type of grant was unknown. Those children who were not receiving a grant had a two-fold higher mortality than those who were (17.8% v. 8.9%). This difference was not statistically significant, with a p-value of 0.22.
In 75% of children the vaccination status was up to date, in 16% it was delayed and in 8% it was not documented. In all three of the above groups the mortality rate ranged from 12 to 15% (p=0.833).
Table 2. Multivariate analysis of age, grant status and nutritional status
Model R2
Age 0.13
Age and grant status 0.14 Age and nutritional status 0.32
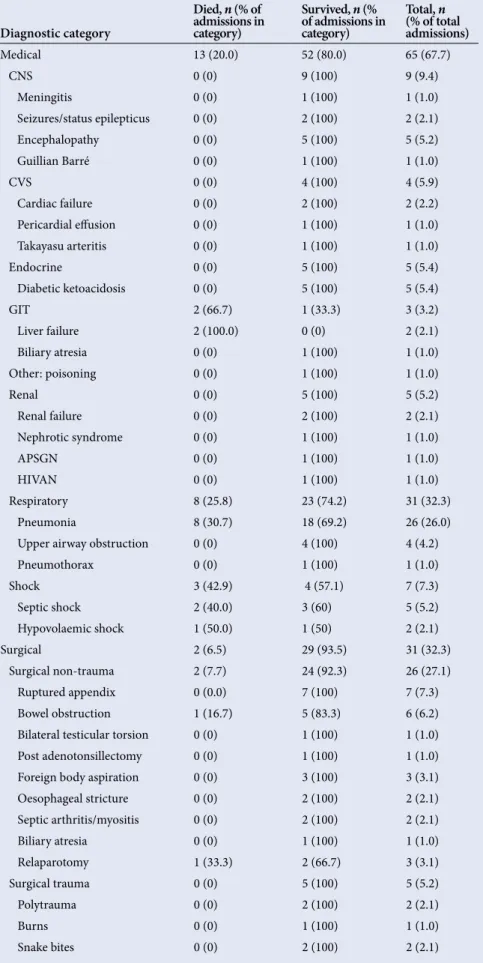
Table 3. Diagnostic categories
Diagnostic category
Died, n (% of admissions in category)
Survived, n (% of admissions in category)
Total, n
(% of total admissions)
Medical 13 (20.0) 52 (80.0) 65 (67.7)
CNS 0 (0) 9 (100) 9 (9.4)
Meningitis 0 (0) 1 (100) 1 (1.0)
Seizures/status epilepticus 0 (0) 2 (100) 2 (2.1)
Encephalopathy 0 (0) 5 (100) 5 (5.2)
Guillian Barré 0 (0) 1 (100) 1 (1.0)
CVS 0 (0) 4 (100) 4 (5.9)
Cardiac failure 0 (0) 2 (100) 2 (2.2)
Pericardial effusion 0 (0) 1 (100) 1 (1.0)
Takayasu arteritis 0 (0) 1 (100) 1 (1.0)
Endocrine 0 (0) 5 (100) 5 (5.4)
Diabetic ketoacidosis 0 (0) 5 (100) 5 (5.4)
GIT 2 (66.7) 1 (33.3) 3 (3.2)
Liver failure 2 (100.0) 0 (0) 2 (2.1)
Biliary atresia 0 (0) 1 (100) 1 (1.0)
Other: poisoning 0 (0) 1 (100) 1 (1.0)
Renal 0 (0) 5 (100) 5 (5.2)
Renal failure 0 (0) 2 (100) 2 (2.1)
Nephrotic syndrome 0 (0) 1 (100) 1 (1.0)
APSGN 0 (0) 1 (100) 1 (1.0)
HIVAN 0 (0) 1 (100) 1 (1.0)
Respiratory 8 (25.8) 23 (74.2) 31 (32.3)
Pneumonia 8 (30.7) 18 (69.2) 26 (26.0)
Upper airway obstruction 0 (0) 4 (100) 4 (4.2)
Pneumothorax 0 (0) 1 (100) 1 (1.0)
Shock 3 (42.9) 4 (57.1) 7 (7.3)
Septic shock 2 (40.0) 3 (60) 5 (5.2)
Hypovolaemic shock 1 (50.0) 1 (50) 2 (2.1)
Surgical 2 (6.5) 29 (93.5) 31 (32.3)
Surgical non-trauma 2 (7.7) 24 (92.3) 26 (27.1)
Ruptured appendix 0 (0.0) 7 (100) 7 (7.3)
Bowel obstruction 1 (16.7) 5 (83.3) 6 (6.2) Bilateral testicular torsion 0 (0) 1 (100) 1 (1.0) Post adenotonsillectomy 0 (0) 1 (100) 1 (1.0) Foreign body aspiration 0 (0) 3 (100) 3 (3.1) Oesophageal stricture 0 (0) 2 (100) 2 (2.1) Septic arthritis/myositis 0 (0) 2 (100) 2 (2.1)
Biliary atresia 0 (0) 1 (100) 1 (1.0)
Relaparotomy 1 (33.3) 2 (66.7) 3 (3.1)
Surgical trauma 0 (0) 5 (100) 5 (5.2)
Polytrauma 0 (0) 2 (100) 2 (2.1)
Burns 0 (0) 1 (100) 1 (1.0)
Snake bites 0 (0) 2 (100) 2 (2.1)
RESEARCH
Eleven patients were HIV-infected (11%), 17 were HIV-exposed (18%), 49 were HIV-negative (51%) and in 19 (20%) the HIV status was unknown. Seventy-two percent of HIV-infected patients were already on ARVs (8/11). HIV status was not found to have a statistically significant effect on survival (p=0.347).
The distance individual children were transferred and their eventual outcome is also demonstrated. Seventy-three percent of the total deaths occurred in children referred from outside Grey’s Hospital, while these children made up 52% of admissions. However, the apparent increased mortality rate with increasing distance from referral facility was not statistically significant (p=0.7154).
There was a significantly increased mortality rate in children who were classified as severely malnourished. Of the 15 children with severe acute malnutrition (SAM), 7 died (46.7%), compared with 4 deaths (5.9%) in those children with a normal nutritional status. This was statistically significant (p=0.003). For the WAZ score, those patients who plotted below −2 z-score made up 73% of the deaths (p=0.033).
In Table 2, a multivariate analysis shows the relationship between grant status, age category and nutritional status. All three variables had a statistically significant correlation with each other. The majority of children who were not receiving a grant (66.7%) were under the age of 12 months, indicating that age is the covariate factor. These children also had a higher rate of malnutrition (64.3%). Seventy-one percent of children who were receiving a grant were older than 12 months.
Table 3 portrays the diagnostic categories of the patient population. Only the primary admission diagnosis was recorded. The majority of children (67.7%) had a medical diagnosis, with respiratory illness comprising 32.3% of all admissions. Over half of all deaths (53.3%) were associated with respiratory illnesses (n=8/15) and both patients with gastrointestinal tract (GIT) problems had liver failure and died. The diagnoses of the two patients who died in the surgical category were bowel obstruction and post relaparotomy for abdominal sepsis.
The average length of stay of patients was 4 days, with a range of 0 - 20 days. A fifth of deaths occurred within 24 hours and almost half (46.7%) within the first 48 hours.
Table 4 indicates the number of parameters available for the calculation of the PRISM, PELOD and PIM3 scores. Twenty-five patients had all the information required to calculate the PRISM score and 23 the PELOD score. In total 88% of data were complete for the calculation of both the PRISM and PELOD scores. The data completion rate for PIM3 was much higher (95%).
The dominant missing parameters included INR (61%) and partial pressure of carbon dioxide (PaCO2) (22%) for the PRISM
calculation and serum glutamic oxaloacetic transaminase (SGOT) (41%) for the PELOD calculation.
As expected, higher scores were associated with a higher mortality. Noteworthy, however, is that all three scores significantly under-predicted the number of deaths.
Fig. 1 illustrates the relationship between the actual and expected deaths for the PRISM, PELOD and PIM3 scores. The standardised mortality ratios (SMRs) for PRISM, PELOD and PIM3 were 2.5, 4.8 and 3.3, respectively.
Table 5 displays the diagnostic categories used to calculate PIM3. Only 20% of the study population were able to be categorised according to this list. Of note is that HIV, nutritional status and other communicable diseases do not form part of this categorisation.
16
14
12
10 8
6 4
2
0
Actual Expected PRISM Expected PELOD Expected PIM3
Dea
ths
,
n
Fig. 1. Actual v. expected deaths as determined by PRISM, PELOD and PIM3.
Table 4. Parameters retrieved (n) to complete the PRISM, PELOD and PIM3 scores
Data quality
percentage PRISM, total admissions)n (% of
PELOD, n
(% of total admissions)
PIM3, n
(% of total admissions)
100 25 (26) 23 (24) 81 (84.3)
>75 - 99 62 (64) 62 (64) 9 (9.4)
>50 - 75 5 (5) 6 (6) 2 (2.1)
>25 - 50 2 (2) 3 (3) 3 (3.2)
≤25 2 (2) 2 (3) 1 (1.0)
Total 96 96 96
Table 5. PIM3 diagnostic categories[3]
Diagnostic category Zero is chosen if not sure Low-risk diagnosis 0. None
1. Asthma is the main reason for ICU admission
2. Bronchiolitis is the main reason for ICU admission
3. Croup is the main reason for ICU admission
4. Obstructive sleep apnoea is the main reason for ICU admission
5. Diabetic ketoacidosis is the main reason for ICU admission
6. Seizure disorder is the main reason for ICU admission
High-risk diagnosis 0. None
1. Spontaneous cerebral haemorrhage 2. Cardiomyopathy or myocarditis 3. Hypoplastic left heart syndrome 4. Neurodegenerative disorder
5. Necrotising enterocolitis is the main reason for ICU admission
Very-high-risk
diagnosis 0. None1. Cardiac arrest preceding ICU admission 2. Severe combined immune deficiency 3. Leukaemia or lymphoma after first induction
RESEARCH
Discussion
Although 8 - 10% of SA’s gross domestic product (GDP) is spent on health,[1] critical care remains a scarce resource.[14] In light of these
resource difficulties one needs to ask ‘Who are the most likely to survive on the best evidence available?’[15] This question highlights
the difficult ethical questions raised in providing these services. Ultimately, the provision of any health service has to take into account basic and preventive medical care[1] to mitigate the need
for critical care. The limitations to this study are the retrospective nature, small sample size and missing data required to calculate PRISM and PELOD scores. It does, however, highlight some important issues.
The overall mortality rate for children in this study was 15.6%, which correlates with the 14.9% reported from Tygerberg Children’s Hospital in Cape Town.[16] This is lower than other middle-income
countries such as Egypt (33.1%)[17] Saudi Arabia (37.4%)[11] and
India (24.3%).[9] In China, however, this figure drops to 2.64%,[18]
which is more in keeping with high-income countries where rates are generally <10%. The Netherlands, USA and Australia have total mortality rates of 6.6%, 4.86% and 4.25%, respectively.[18]
Children <1 year of age comprised only half (46.9%) of all ad missions yet accounted for two-thirds of the deaths, with a mortality rate of 22.2% in the age group. This correlates with experience in Cairo[17] and Saudi Arabia,[11] where the highest
mortality rates (43.95% and 65.6%, respectively) were found in patients <1 year of age. These facts point to increased vulnerability in this age group and probably a need to be more aggressive in their management to improve outcomes.
Malnutrition remains a major public health burden in the developing world. Numa et al.[7] demonstrated that extremes of
weight have a significant impact on survival in ICU.Patients with weights below the 3rd centile had more than double the mortality of those at the 75th centile.[7] Nutritional status was found to be
statistically significant in this study at 5% (p<0.05). Sixty-four percent of infants were malnourished and 68% of malnourished children were not in receipt of a social grant. On multivariate analysis with age and nutritional status, malnutrition remained significant (R2 significant change with malnutrition in the model). As children
with primary malnutrition are not usually accepted into the ICU, the study population consisted of patients with malnutrition secondary to other underlying medical conditions. This probably reflects the severity or chronicity of the underlying condition and should be considered a poor prognostic marker when present and possibly a reason to preclude admission.
Forty-six percent of deaths occurred within 48 hours of admission. This high early mortality may reflect the quality of care in the periphery and during transfer, as well as resource and logistical challenges in the referral system. It was beyond the scope of this study to determine the impact of these factors. In KwaZulu-Natal however, 69% of public hospitals have no high-care or ICU facilities,[14] making
stabilisation and presumably monitoring of patients prior to transfer a challenge.
There was a 50% greater chance of dying among children who were not receiving a grant. On multivariate analysis it was found that a significant proportion of these children (66.7%) were under the age of 1 year and that age, not grant status, was the significant factor (R2
insignificant change with grant status in the model). This illustrates that age, and the vulnerabilities associated with infancy, is the covariate factor in interpreting the difference in mortality between those receiving and not receiving a social grant.
HIV status was not found to affect mortality in this study, although a large proportion of the study population had an unknown HIV status on admission. With the advent of ARV therapy, mortality in HIV-infected children has decreased significantly in both high- and middle-income countries.[5] Ultimately the aim should be to reduce
the need for intensive care in these children and instead focus on improved systems to prevent mother-to-child transmission and the early initiation of ARVs where necessary.[16]
Increasing PRISM, PELOD and PIM3 scores were all associated with increasing mortality rates, as expected (p<0.05). More remarkable, however, is that all three scores significantly under-predicted deaths in this population. The SMRs for PRISM, PELOD and PIM3 were 2.5, 4.8 and 3.3, respectively. These rates are higher than those found in the Netherlands[8] (0.95 with PRISM and 0.88
with PIM) while in India Taori et al.[9] reported an SMR of 1 with
PRISM. Wells et al.[12] suggested that the different demographic
characteristics and disease patterns of SA ICU patients may influence PRISM scoring.[12] PIM and PIM2 showed SMRs of 1.10 and 0.90,
respectively, in an SA study.[19]
The increased SMR in the study population may point towards failure of these scores to include underlying factors unique to our patient population. In PIM3, failure to include diagnoses common to our population (HIV infection, malnutrition, tuberculosis and other communicable diseases) leads to a large proportion of patients being allocated a score of zero. Many of these children would probably qualify for the high- and very-high-risk categories in an SA model. The study population, however, was too small to make accurate analyses in this regard.
The value of using the PRISM, PELOD and PIM3 in our setting may be to use the SMR to monitor the performance of the unit itself over time or to compare different units with the same resource limitations.[9] Solomon et al.[19] commented that PIM and PIM2
should not be used as screening tools as they are not accurate enough.The scores may need to be recalibrated or recalculated for the SA population[11] to more accurately determine disease severity.
Conclusion
This study highlights severe malnutrition as a statistically significant factor associated with mortality regardless of the cause of the malnutrition. This suggests there may be no value in differentiating between primary and secondary malnutrition in PICU admissions as outcomes remain poor.
In addition, children under the age of 1 year had the highest proportion of malnutrition and deaths. This factor points strongly towards the need to practise early aggressive intervention in infants admitted to an ICU to improve outcomes in this age group.
PRISM, PELOD and PIM3 were all found to significantly under-predict death in our setting. It may not be relevant to use these scores to predict death in SA but the SMR can be used by units to compare their individual performance. The authors found the PIM3 to be the score with the most potential for reproducibility in that it has fewer variables and clear instructions on how to use it.
References
1. Fowler RA, Adhikari NK, Bhagwanjee S. Clinical review: Critical care in the global context – disparities in burden of illness, access, and economics. Crit Care 2008;12(5):225. [http://dx.doi.org/10.1186/cc6984]
2. Cowburn C, Hatherill M, Eley B, et al. Short-term mortality and implementation of antiretroviral treatment for critically ill HIV-infected children in a developing country. Arch Dis Child 2007;92(3):234-241. [http://dx.doi.org/10.1136/ adc.2005.074856]
3. Stranley L, Clements A, Parslow RC, et al. Paediatric Index of Mortality 3: An updated model for predicting mortality in pediatric intensive care. Pediatric Critical Care Medicine 2013;14(7):673-681. [http://dx.doi.org/10.1097/ PCC.0b013e31829760cf]
4. DSD, SASSA and UNICEF. Heinrich C, Hoddinott J, Samson M, Mac Queen K, van Niekerk I, Renaud B, eds. The South African Child Support Grant Impact Assessment: Evidence from a Survey of Children, Adolescents and their Households. Pretoria: UNICEF South Africa, 2012. http://www.unicef.org/ southafrica (accessed February 2015).
RESEARCH
6. Collins S. Treating severe acute malnutrition seriously. Arch Dis Child 2007;92(5):453-461. [http://dx.doi.org/10.1136/adc.2006.098327 (accessed 19 July 2015).
7. Numa A, McAweeney J, Williams G, Awad J, Ravindranathan H. Extremes of weight centile are associated with increased mortality in paediatric intensive care. Crit Care 2011;15(2):R106). [http://dx.doi.org/10.1186/cc10127] 8. Gemke RJ, van Vught J. Scoring systems in pediatric intensive care: PRISM
III versus PIM. Intensive Care Med 2002;28(2):204-207. [http://dx.doi.
org/10.1007/s00134-001-1185-2]
9. Taori RN, Lahiri KR, Tullu MS. Performance of PRISM (Pediatric Risk of Mortality) score and PIM (Pediatric Index of Mortality) score in a tertiary care pediatric ICU. Indian J Pediatr 2010;77(3):267-271. [http://dx.doi.org/10.1007/ s12098-010-0031-3]
10. Rady H, Mahomed S, Mohssen N, ElBaz M. Application of different scoring systems and their value in pediatric intensive care unit. Gaz Egypt Paediatr Assoc 2014;62:59-64. http://www.sciencedirect.com/science/article/pii/S1110663814000494 (accessed October 2014).
11. Alsuheel A, Shati A. Factors predicting mortality in pediatric intensive care unit in a tertiary care center Southwest Region, Saudi Arabia. J Med Med Sci 2014;5(5):113-120. [http:/dx.doi.org/10.14303/jmms.2014.085]
12. Wells M, Riera-Fanego JF, Luyt DK, Dance M, Lipman J. Poor discriminatory performance of the Pediatric Risk of Mortality (PRISM) score in a South African intensive care unit. Crit Care Med 1996;24(9):1507-1513. [http:// dx.doi.org/10.1097/00003246-199609000-00013]
13. Leteurtre S, Duhamel A, Grandbastein B, et al. Daily estimation of the
severity of multiple organ dysfunction syndrome in critically ill children.
Can Med Assoc J 2010;182(11):1181-1187. [http://dx.doi.org/10.1503/ cmaj.081715]
14. Bhagwanjee S, Scribante J. National audit of critical care resources in South Africa – unit and bed distribution. S Afr Med J 2007;97(12 Pt 3):1311-1314. 15. Jeena PM, McNally LM, Stobie M, Coovadia HM, Adhikari MA, Petros AJ.
Challenges in the provision of ICU services to HIV infected children in resource
poor settings: A South African case study. J Med Ethics2005;31(4):226-230.
[http://dx.doi.org/10.1136/jme.2003.004010]
16. Rabie H, de Boer A, van den Bos S, Cotton MF, Kling S, Goussard P. Children with human immunodeficiency virus infection admitted to a pediatric intensive care
unit in South Africa. J Trop Pediatr 2007;53(4):270-227. [http://dx.doi.org/10.1093/
tropej/fmm036]
17. Rady H. Profile of patients admitted to pediatric intensive care unit, Cairo University Hospital: 1-year study. Ain-Shams J Anesthesiol 2014;7(4):500-503. [http://dx.doi.org/10.4103/1687-7934.145680]
18. Bilan N, Galehgolab BA, Emadaddin A, Shiva SH. Risk of mortality in paediatric intensive care unit, assessed by PRISM III. Pak J Biol Sci 2009;12(6):480-485. [http://dx.doi.org/10.3923/pjbs.2009.480.485]