Threshold Bloodstain Recognition Method
Based on Hyper-spectral Imaging Technology
Nannan Hu1 ,Yunuan Wang2, Xiaofei Li1, Yonglei Liu1, Jingjing Wang1, Liren Zhang1,Yuefeng Zhao1,* 1. College of Physics and Electronic Science, Shandong Normal University, Jinan, China
2. China Jiaotong University, Beijing, China
* Corresponding author is Yuefeng Zhao, emil:[email protected]
Abstract
:
The identification of bloodstain is one of the most important approaches in obtainingevidence in criminalistics. A threshold method based on spectral co-efficient and interclass variance
is proposed in this paper, it is a non-contact, non-destructive method for quickly identifying
bloodstains. The spectra of bloodstains and other suspected substances were allextracted from their
hyper-spectral image. Then calculate the correlation coefficients of these spectral and interclass
variances, analyze the differences between substances. The best blood recognition threshold was
determined as 0.9. After preprocessing for eliminating systematic errors, experiments with the
threshold 0.9 are carried out to identify bloodstains on the calico and red T-shirt. The method can
remarkably identify the bloodstain from other non-blood substances both quickly and efficiently.
The blood extraction rate can reach to 93.35% and 89.19%, respectively. It is an important step
toward the implementation of bloodstain non-contact and non-destructive identification in forensic
casework.
Keywords: Hyper-spectral imaging system, Spectral characteristics, Image processing, Threshold
method, Bloodstains recognition.
Forensic biochemistry analytical technologies permit a significant amount of genetic information to
be obtained from a biological stain found at a crime scene. Bloodstains are the most common
biological stain in a violence incident. Bloodstains present one of the most useful physical evidences
at the scene of a violent crime. From the crime scene investigation point of view, the age of a
bloodstain can provide important information about the nature of the crime to reconstruct the scene.
Furthermore, DNA or RNA extracted from the bloodstains is also an evidence for the investigator
to identify the suspects or victims in the violence incident. Hence, the age of a blood stain is able to
accurately provide significant forensic information.
Currently, the conventional methods being applied to bloodstain identification include Kastle-Meyer
(KM), Leuco-malachite Green (LMG), and luminol tests [1, 2]. The luminol test is first used for the
identification of bloodstains in [3]. The test is very sensitive and the result is obvious when the blood
is located on fabric and carpet with absorbent substrates. However, this approach has some inherent
defects. For example, it may produce false positives, create problems for the subsequent tests of
DNA [3-5], as well as lead to the dilution of the stain. In addition, the use of such chemical is
hazardous to the health of the investigators. Likewise, the same weakness can be also found in the
KM and LMG [1, 2]. As for alternative approaches, high performance liquid chromatography
(HPLC) [6, 7], Oxygen electrode method [8], electron paramagnetic resonance method [9], Atomic
microscopy [10], and RNA degradation measurement are used for the identification of bloodstains
[11, 12]. Unfortunately, the above-mentioned methods have been used in practical investigations for
a long time and their testing results are somehow inaccurate. The other weakness includes that
these methods require a sample from primitive bloodstains to be collected for the experimental test,
for the criminal investigation. Furthermore, these methods usually involve more complex
biochemical reactions, realty increasing the time needed to obtain results [6].
Since it is a new combination of molecular biology and physics, spectroscopic methodology is
a non-destructive and non-contact bloodstain identification method that is gradually being used in
forensic investigation. Many approaches based on the spectroscopic method have been proposed,
such as the detection of latent fingerprints [13, 15], physical evidence, as well as the identification
of the bloodstain using imaging techniques. Schuler investigates a non-destructive approach for the
identification of bloodstains on black fabrics using near-infrared hyper-spectral imaging [9]. A
hyper-spectral camera records the back-scattered light of many narrow wavelength bands and
generates a data set of monochrome images for each wavelength. The numerical results demonstrate
that the contrast between bloodstains and black fabrics is enhanced by the hyper-spectral images
operating in the wavelength ranging from 650 nm to 1100 nm and from 960nm to 1650 nm [16]. In
[17], Edelman focuses on the visible reflectance of hyper-spectral imaging in the wavelength
ranging from 400 nm to 720 nm. This approach is able to visualize bloodstains on 12 different black
fabrics. Li was successful in the discrimination of bloodstains from nine red substances that were
dropped on the paper based on the Soret γ band absorption in haemoglobin between 400 nm and
500 nm [18, 19]. It can be seen that approaches presented in [16-19] demonstrate that hyper-spectral
imaging technology can be widely used in non-destructive testing of bloodstain in different
wavelength ranges.
This study presents a novel approach for non-contact detection and identification of bloodstains
using visible near infrared wavelength hyper-spectral imaging based on the reflectance of different
imaging in wavelength ranging from 400 nm – 800 nm to the visualization of bloodstain, as well as
other similar blood substances on two different fabrics. The significance of this research is that a
threshold method based on spectral co-efficient and inter-class variance is proposed in this paper,
which can be applied in crime scene for the identification and detection of bloodstain, including the
suspected blood or even the incident scene being washed. It is an efficient, non-destructive
technology for quickly identifying bloodstains. The bloodstain identification approach is based on
a visible near infrared reflectance hyper-spectral imaging system operating in wavelength,
combined with spectral co-efficient and inter-class variance calculate, which finally allows the best
bloodstain recognition threshold to be determined as 0.9. The proposed hyper-spectral image
processing approach is evaluated by two sets of bloodstain samples on the calico and the red T-shirt,
separately. A comparison of the numerical results using the proposed approach and the other
well-known conventional approaches is presented.
Material and methods
Hyper-spectral imaging system
The hyper-spectral imaging system (Gaia Sorter) used by this study consists of spectral camera
(INFINITY-3), light sources for scene illumination, motorized precision translation stage, and a
computer. The spectral camera is capable of operating in a wavelength range from 400 nm to 1000
nm. This system is a 1392 × 1040 pixel complementary metal oxide semiconductor device that is
able to detect elements of Cooled CCD with relative aperture of F/2.4 and the slit size of 30 μm (W)
x 8.98 mm (L). Also, four tungsten halogen light sources are able to provide incident light. In this
study, the radiant output power provided by the light sources is able to cover a range of
approximately 100 cm2; however, the light power within the wavelength ranging from 400 nm to
hyper-spectral image is captured in the range of 400 nm and 1000 nm in wavelength with hyper-spectral
sub-sampling at approximately 1.2 nm intervals in a format of 520 bands for an image cube.
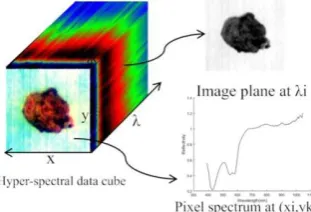
Figure 1 shows the hypercube of a bloodstain on white fabric. Hyper-spectral imaging techniques
are based on the acquisition of spectral data from each pixel of an image rather than a single point,
forming a three-dimensional multivariate array of data with two spatial dimensions (x, y) and one
wave length dimension (λ) [20], which is also known as a hypercube. In comparison with general
imaging technology, it is highlighted with multi-band, narrow spectral range, and a continuous band.
Fig.1. Hypercube of a bloodstain on white fabric, with two spatial (x, y) and one wavelength (λ) dimension. From
the hypercube an image planes shown for one wavelength (λi) and a spectrum is obtained from one pixel (xi,yk ).
The criteria for bloodstain identification
1. The reflectance spectrum of bloodstain in the visible region is dominated by the spectrum of
haemoglobin present in blood [21, 22]. It mainly consists of a strong narrow absorption
center at approximately 415 nm, referred to as the Soret band, with two weaker and broader
absorptions between 500 nm and 600 nm, which are known as the β and α bands, respectively.
Figure 2 shows the reflectance spectrum of a fresh bloodstain. Other red substances absorb in
the region of the visible spectrum between 400 nm and 500 nm, the width of their absorption is
typically much wider rather than a center at 410 nm [19]. Therefore, different types of
can be applied to identify and discriminate bloodstains from other substances having a very
similar color.
Fig.2.The reflectance spectrum of a fresh blood stain
2. The further investigation between bloodstain and other non-blood substances can be processed
by a reflectance spectrum comparison of the suspected bloodstain and references, including both
bloodstains and non-bloodstains using the statistical co-efficiency of determination, denoted as R2.
The reference library of bloodstains includes aged bloodstains from 1 hour to 40 days. The reference
library of non-bloodstains consists of approximately 45 reddish-color substances, which can likely
be real blood. These non-bloodstains include coffee, red neutral pen, cola, chili oil, and soy sauce.
The value of statistical co-efficiency R2 is calculated using the reflectance spectrum for all the
bloodstains and the non-blood stains in the reference libraries. The calculation of R2 is shown as
equation (1).
( )
( ) ( )
( )
2 2( )
( )
2 2( )
2
E XY
E X E Y
R
E X
E
X
E Y
E
Y
−
=
−
−
(1)where E refers to mathematical expectation, X is the standard blood spectrum signal and Y represents the spectral signal of the stain to be identified. It has the same meaning as the Pearson function, describes the degree of linear correlation between the two variables.
The proportion of blood pixels in hyper-spectral images is recorded as
1, and its average gray valueis recorded as
1. The proportion of other stain pixels is recorded as
2, and its average gray valueThe inter-class variance between bloodstain and other stains can be obtained from:
(
)
21 2 1 2
G
=
−
(2)Combined considerations R2 and G, select the co-efficiency R2 that maximizes interclass variance
between bloodstain and other stains as the decisive threshold for distinguishing bloodstain from
other stains.
3. Threshold method is used to distinguish bloodstains from other stains. Pixels in the image of
reflectance spectrum satisfying the conditions in criteria (1) and (2) are marked white, while other
pixels are marked black. Therefore, the bloodstains can be easily identified in the reflectance
spectrum image. Moreover, the blood extraction rate
r
can be calculated by formula (3).100%
ext r act i onbl oodst ai n
N
r
N
=
(3)where
N
extractionthe number of pixels is marked in white color,N
bloodstain is the number ofpixels of blood in the raw image data. Experiment samples
The experiment is approved by School of Physics and Electronics, Shandong Normal University. All subjects gave their informed consent for inclusion before they participated in the study. The study was conducted in accordance with the Declaration of Helsinki, and the protocol was approved by the Ethics Committee and the Health Department.
Two sample sets are prepared in the experiment. The aim of this study is to explain the principle of
using a hyper-spectral imaging system for bloodstain identification, as well as to demonstrate the
significance that can be achieved by the system. The experiment includes two sample sets obtained
from fabrics: calico sample set and red T-shirt sample set. The size of the sample is about 10 cm
× 10 cm. Their parameters are shown in Table1 and Table2, respectively. It should be noted that the
substrate selected as the fabric sample is second-hand clothes, worn, and washed regularly prior to
application of the blood. One drop of blood is deposited directly from the fingertip to each fabric
sugar water were selected as other substances for comparison because their colors are similar to
bloodstains, making sure that there are bloodstains and other no-bloodstains for each sample set.
All of the substances mentioned above were obtained from the supermarket and never opened before
dropping stains.
Two group experiments were conducted in the hyper-spectral imaging laboratory.
1) Undiluted bloodstains, coffee, red ink, cola, chili oil, soy sauce, grape juice, and brown sugar
water were deposited on white color fabric. The amount of these substances deposited on the
substrate was controlled so these stains were visible.
2) A series of blind tests was conducted using the red T-shirt fabric with bloodstains and a mixture
of other non-blood stains.
Pre-processing of Hyper-spectral image
Due to the system factors such as dark current, scattering, and so on, the hyper-spectral images
directly obtained from the hyper-spectral system need a series of pre-processing before it can be
applied to the recognition, statistics, or classification.
First, it is necessary to directly calibrate the image acquired by the Gaia Sorter because the
hyper-spectral imaging system generates a large amount of noise that is simultaneously acquired with the
imaging signal. In this study, the black and white calibration was selected for the correction of the
original image. The key mechanism in the black and white calibration was to calculate the
calibration co-efficiency, that is:
100%
S DW D
I
I
R
I
I
−
=
where
R
refers to the relative spectrum reflectivity of the corrected hyper-spectral image,I
S isthe original hyper-spectral image obtained directly,
I
D indicates a black board calibration imagewith the reflectance of 0%, and
I
W shows a white calibration image of the standard white boardwith a reflectance of 99%. The performance of the black and white calibration can clearly be
represented by the spectral curve, which shown in Fig.3.
Fig.3. Curve a is reflectance spectral of the bloodstain before calibration, curve b is reflectance spectral after calibration.
Then, the Minimum Noise Fraction (MNF) was used to eliminate the noise produced in the
spectral imaging process. The key element is to determine the intrinsic dimension of the
hyper-spectral data, which can effectively filter the noise. It is clear that MNF is able to significantly
reduce the noise and improve computing capacity required in the subsequent processing. The
performance of MNF can clearly be represented by the spectral curve, as shown in Fig.4.
Fig.4. Curve b is reflectance spectral of the bloodstain before MNF curve c is reflectance spectral of the bloodstain
According to the requirement of data analysis in terms of speed and efficiency, the hyper-spectral
image needs to be segmented by regions, so as to extract the useful data areas of interest and to
make the following procedure more succinct, eliminating the adverse effects of unrelated
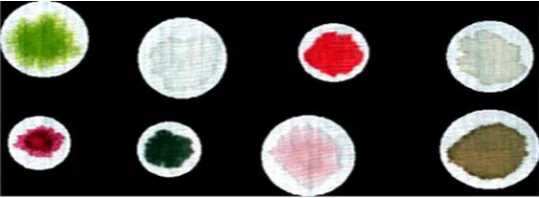
background on blood identification and analysis. Fig.5 shows the image after the selection of ROI.
Bloodstain and blood analog stains are all selected and the background is deducted.
Fig.5. Extracted ROI of samples
On the one hand, the implementation of these pre-processing methods can eliminate a series of
systematic errors caused by filters and dark currents. On the other hand, it is the first filtering of
effective data, which reduces the size of data and makes subsequent analysis faster and more
efficient.
Results and Analysis
The experimental testing of bloodstains on the calico
Figure 6 shows the mean spectral characteristics of bloodstain and other substances. It can be seen
that the mean spectral curve of bloodstain has a strong narrow absorption center at approximately
415 nm, which is referred to as the Soret band, and two distinct peaks between 500 nm to 550 nm
in wavelength. The Soret band has a shift to shorter wavelength severely depending on time, which
is called the blue shift phenomenon [23]. It can be seen that the bloodstain has its unique spectral
band and bands from 500 nm to 550 nm. Considering the blue shift in the Soret band, we take bands
from 500 nm to 550 nm for deeper analyses.
Fig.6 Mean reflection intensity of samples.
Based on the spectral characteristics of bloodstain – especially these distinct peaks between 500nm
to 550 nm in wavelength and criteria (2) testing on samples for an investigation of the optimum
value of R2. When the test sample is a bloodstain, its reflectance spectrum is expected to be similar
to the reflectance spectrum of bloodstains shown in the reference library. This means that the
maximum value of R2 is expected to be close to 1, indicating the better degree of association
between standard bloodstain curves and pending recognition curve. Fig 7 shows the max and min
value of R2. X-axis labeling represents different stains and bloodstains.
Fig.8. a box plot shows the coefficient of determination (R2) for reference blood stains and a library of non-blood
stains. The line inside the box indicates the median value whilst the open square represents the mean value.
Figure 8 shows a box plot exhibiting the co-efficient of determination R2 for bloodstain and other
non-blood substances. It is obvious that the co-efficient of determination R2 for bloodstain is close
to 1. By contrast, the co-efficient of determination R2 for other non- blood substances is far less
than 1.
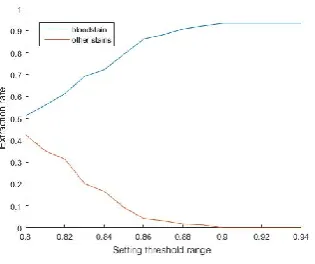
Fig.9. When selects different threshold, the extraction rate of bloodstain and other stains.
We selected a threshold from 0.80 to 0.94 based on spectral coefficient. Figure 9 respectively shows
that the extraction rate of bloodstain and other stains in this threshold. When the threshold is less
than 0.9, other stains would interfere with the identification and extraction of bloodstain.Starting
from 0.9, the extraction rate of other stains become 0, and the extraction rate of bloodstain up to the
successfully identified by a threshold co-efficient of determination R2=0.9. Based on formula (3)
in criteria (3), the blood extraction rate is about 93.35%.
The experimental testing of bloodstains on red color T-shirt
A red color T-shirt is selected as the fabric for bloodstain identification experiments; the
hyper-spectral image after MNF and ROI processing is shown in Fig.10. The reason for selecting the red
T-shirt as the fabric is that the bloodstain on a red color T-shirt may be hardly noticed by the naked
eye. Therefore, such experimental test aims to evaluate the accuracy and efficiency of the proposed
approach. In the experiment, the red T-shirt fabric contains eight stains, including chili oil, coke,
red ink, coffee, bloodstain, sugar water, grape juice, and soy sauce. The experiment is conducted on
blind testing basis, signifying that the nature of all stains on the red color T-shirt is independently
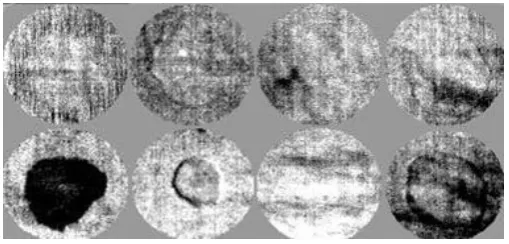
blind to the experimental team. Considering spectral correlation differences, we can obtain the
single band image shown in Fig 11.The stains correspond to the stains in Fig 10. The bloodstains
were clearer than other stains, the same threshold value 0.9 is also applied to the treatment of the
red T-shirt, and the recognition result is presented in Fig.12.
Fig.11 A single band image selected by spectral correlation.
Figure 12 shows the most bloodstain pixels of the reflectance spectral image satisfying the condition
of R2>0.9, and they are all marked in white color by the proposed method. The rest of the pixels
that do not contain blood composition have a co-efficient far less than 1 and are marked in black by
a threshold 0.9. The bloodstain extraction rate is also calculated as the testing on calico, and in the
red T-shirt bloodstain extraction rate can be up to 89.19%.
Fig.12.The result of bloodstain recognition.
Conclusion
Threshold based on spectral co-efficient and inter-class variance are proposed in this paper. It is an
efficient non-destructive technology for quickly identifying bloodstains. The bloodstain
identification approach is based on a visible near infrared reflectance hyper-spectral imaging system
operating in wavelengths ranging from 400 nm to 800 nm, combined with spectral characteristic
co-efficient and inter-class variance calculation. After a number of experimental tests, the extraction
efficiency of bloodstains is compared for different thresholds. Finally, the optimal bloodstain
of directly obtained hyper-spectral images are carried out. Then, a series of experimental
investigations are conducted at a threshold of 0.9 to identify bloodstains on calico and red T-shirt
under blind testing condition. It can be seen that the proposed method is able to remarkably and
efficiently identify the bloodstain from other non-blood substances. The blood extraction rate can
reach up to 93.35% and 89.19%, respectively. The numerical results obtained from experiments on
blind testing basis are able to demonstrate the capability of using reflectance hyper-spectral imaging
system in wavelength to visualize bloodstains on cotton cloth fabric for bloodstain identification
purposes. These results illustrate the flexibility, availability, and convenience of the proposed
recognition method.
Funding
National Natural Science foundation of China under Grant
(
No.81400285
)
; The key
research and development foundation of Shandong Province under Grant
(
No.2016GGX101016
)
;Graduate Research Innovation Foundation of Shandong
normal University in 2018, under Grant SCX201838.
Author Contributions
Data curation, Nannan Hu; Funding acquisition, Yuefeng Zhao; Investigation, Yunuan Wang and Xiaofei Li; Methodology, Jingjing Wang and Liren Zhang; Software, Yonglei Liu; Writing – review & editing, Nannan Hu.
References
1. Barni F , Lewis S. W , Berti A , Miskelly G. M , Lago G. Forensic application of the luminol
reaction as a presumptive test for latent blood detection. TALANTA, 2007; 72(3): 896-913.
2. Tobe S. S, Watson N, Niamh Nic Daéid. Evaluation of six presumptive tests for blood, their
specificity, sensitivity, and effect on high molecular-weight dna, J FORENSIC SCI, 2007; 52(1):
102-109.
3. Lytle L. T, Hedgecock D. G. Chemiluminescence in the visualization of forensic bloodstains, J
4. Nesterenko P N , Jones P . Single-column Method of Chelation Ion Chromatography for the
Analysis of Trace Metals in Complex Samples[J]. J CHROMATOGR A, 1997, 770(1):129-135.
5. Laux D. L. Effects of luminol on the subsequent analysis of bloodstains, J FORENSIC SCI, 1991,
36(5): 1512-1520.
6. Inoue H, Takabe F, Iwasa M, Maeno Y, Seko Y. A new marker for estimation of bloodstain age
by high performance liquid chromatography,Forensic Sci Int,1992; 57(1): 17-27.
7. Andrasko J. The estimation of age of bloodstains by hplc analysis, J FORENSIC SCI,1997; 42(4):
601-607.
8. Matsuoka T, Taguchi T, Okuda J. Estimation of bloodstain age by rapid determinations of
oxyhemoglobin by use of oxygen electrode and total hemoglobin, BIOL PHARM BULL,1995;
18(8): 1031-1035.
9. Fujita Y, Tsuchiya K, Abe S, Takiguchi Y , Kubo S. I. , Sakurai H. Estimation of the age of
human bloodstains by electron paramagnetic resonance spectroscopy: long-term controlled
experiment on the effects of environmental factors, Forensic Sci Int,2005; 152(1): 39-43.
10. Wu Y, Hu Y, Cai J, Ma S, Wang X, Chen Y. Time-dependent surface adhesive force and
morphology of rbc measured by afm. MICRON, 2009; 40(3): 359-364.
11. Alrowaithi M. A Mccallum, N A, Watson N. D. A method for determining the age of a
bloodstain, Forensic Sci Int, 2014; 23(4): 30-31.
12. Li B, Beveridge P, O'Hare W. T, Islam M. The estimation of the age of a blood stain using
reflectance spectroscopy with a microspectro-photometer, spectral pre-processing and linear
13. Camilla Ricci A. Steve Bleay, and Sergei G. Kazarian, Spectroscopic Imaging of Latent
Fingermarks Collected with the Aid of a Gelatin Tape, ANAL CHEM, 2007. 79(15): 5771-5776.
14. Cadd S, Li B, Beveridge P, William T. O’Hare, Campbell A, Islam, M. The non-contact
detection and identification of blood stained fingerprints using visible wavelength reflectance
hyperspectral imaging: part 1, SCI JUSTICE, 2016; 56(3): 181-190.
15. Ricci C. and S.G. Kazarian, Collection and detection of latent fingermarks contaminated with
cosmetics on nonporous and porous surfaces, SURF INTERFACE ANAL, 2010. 42(5): 386-392.
16. Edelman G., Manti V., Ruth S. M. V., Leeuwen T. V., Aalders M. Identification and age
estimation of blood stains on colored backgrounds by near infrared spectroscopy,Forensic Sci Int,
2012; 220(1-3): 239-244.
17. Edelman G. J, Leeuwen T. G. V, Aalders M. C, Visualization of latent blood stains using visible
reflectance hyperspectral imaging and chemometrics, J FORENSIC SCI, 2015; 60(5):188-192.
18. Zhao Y, Hu N, Wang Y, Liu Y, Li X, Wang J. The application of near-infrared reflectance
hyperspectral imaging for the detection and extraction of bloodstains, CLUSTER COMPUT,2018;
1(3):1-9.
19.Li B, Beveridge P, O'Hare W. T, Islam M. The application of visible wavelength reflectance
hyperspectral imaging for the detection and identification of blood stains, SCI JUSTICE, 2014;
54(6): 432-438.
20. Sun H, Dong Y, Zhang P, Meng Y, Wen W, Li N, Accurate age estimation of bloodstains
based on visible reflectance spectroscopy and chemometrics methods, IEEE PHOTONICS J,
21. Schuler R. L, Kish P. E, Plese C. A, Preliminary observations on the ability of hyperspectral
imaging to provide detection and visualization of bloodstain patterns on black fabrics,J
FORENSIC SCI, 2012; 57(6), 1562-1569.
22. Li B, Beveridge P, O'Hare W. T, Islam M. The age estimation of blood stains up to 30 days
old using visible wavelength hyperspectral image analysis and linear discriminant analysis, SCI
JUSTICE, 2013; 53(3), 270-277.
23. Hanson E K, Ballantyne J. A blue spectral shift of the hemoglobin soret band correlates with the
Table.1. List of parameters of the calico
Parameter name Parameter values
Material quality Component content Technology Color Density Shrinkage rate Grain style Elastic force Thickness index Pure cotton 100%
Printing and dyeing
Primary colors/ natural color
Increased density
Less than 5%
Plain
Nonelastic
moderate
Table.2. List of parameters of the red T-shirt
Parameter name Parameter values
Material quality Component content Technology color density shrinkage rate tactile index smoothness index cotton
more than 96%
printing and dyeing
red
increased density
less than 5%
moderate