Volume 5, No. 4, April 2014 (Special Issue)
International Journal of Advanced Research in Computer Science
RESEARCH PAPER
Available Online at www.ijarcs.info
Performance Evaluation of Clustering Methods for Low and High Dimensional Data
Smita Chormunge
Department of Computer Science GITAM University, Hyderabad
Ch. Sanjay
Dept. of Mechanical Engg. GITAM University, Hyderabad [email protected]
Sudarson Jena
Department of Information Technology GITAM University, Hyderabad
Abstract: Various Data Clustering techniques are used for grouping similar data and play an important role in the field of Data Mining. Most of the clustering techniques are work good for clustering low dimensional data.We focus on comparitive study of clustering methods: K-means,Hierarchical and Density based clustering, for performance with low and high dimensional data. Experimental results evaluate the performance of these methods on different datasets by analyzing number of features ,number of clusters and time required for clustering data set.
Keywords: Clustering, K-means, Hierarchical, Density-based, Weka
I. INTRODUCTION
Classification or organizing of data is very important in all scientific disciplines. It is one of the most fundamental mechanisms of understanding and learning [19]. Depending on the problem, classification can be exclusive or overlapping, supervised or unsupervised. Classification and Clustering are two most important concepts of Data Mining .Classification is supervised method and from a machine learning perspective clusters correspond to hidden patterns, the search for clusters is unsupervised learning, and the resulting system represents a data concept. Therefore, clustering is unsupervised learning of a hidden data concept. Clusteranalysis is a task of grouping a set of objects in such a way that objects in the same group (called a cluster) are more similar to each other than to those in other groups (clusters). It is a main task of exploratory data mining, statistical data analysis [1], pattern recognition [2], image analysis [3], information retrieval and bioinformatics. Machine learning clustering algorithms were applied to image segmentation and computer vision [3].Clustering is also widely used for data compression in image processing, which is also known as vector quantization. Data fitting in numerical analysis provides still another venue in data modeling [4]. Clustering in data mining was brought to life by intense developments in text mining [5], spatial database applications, heterogeneous data analysis [6], Web applications [7], DNA analysis in computational biology [8], and many others. They resulted in a large amount of application-specific developments.
Data mining applications find three complications: (a) large databases, (b) many attributes, (c) attributes of different types. This imposes on a data analysis severe computational requirements. They present real challenges to classic clustering algorithms. These challenges led to the emergence of powerful broadly applicable data mining clustering methods developed on the foundation of classic techniques. There are various types of clustering methods such as Hierarchical clustering, partitioning clustering:
K-means and K-Mediods, Density based clustering, Grid– based clustering, Model based clustering, and Constrained based clustering.
This paper emphasis is on comparison of clustering methods based on execution time of High and low dimensional datasets. The main aim of this paper is to evaluate average execution time required to form a clusters for K-means, Hierarchical and Density-based clustering methods on different datasets. The rest of this brief contribution is organized as follows. Section II provides basic knowledge of different clustering methods. Section III of this paper presents performance evaluation of different clustering methods. Results are discussed in section IV .Finally section V of this paper presents concluding remark.
II. CLUSTERING METHODS
In this section we provides a basic knowledge of three clustering methods i.e. K-means, Hierarchical and Density-based. The issues related to cluster the data includes:
a. Scalability to large datasets
b. Ability to work with high dimensional data c. Ability to find clusters of irregular shape d. Handling outliers
e. Time complexity (we frequently simply use the Term complexity)
f. Data order dependency
g. Labeling or assignment (hard or strict vs. soft or Fuzzy)
h. Reliance on a priori knowledge and user defined Parameters
i. Interpretability of results.
A. K-Means Clustering:
observations without any prior knowledge of those relationships. The k-means algorithm is one of the simplest clustering techniques for implementation.
a. The k-means Algorithm:
First it clusters observations into k groups [15], where k is provided as an input parameter. It then assigns each observation to clusters based upon the observation’s proximity to the mean of the cluster. The cluster’s mean is then recomputed and the process begins again. Here are steps how the algorithm works:
a) The algorithm arbitrarily selects k points as the initial cluster centers (“means”).
b) Each point in the dataset is assigned to the closed cluster, based upon the Euclidean distance between each point and each cluster center.
c) Each cluster center is recomputed as the average of the points in that cluster.
d) Steps 2 and 3 repeat until the clusters converge. Convergence may be defined differently depending upon the implementation, but it normally means that either no observations change clusters when steps 2 and 3 are repeated or that the changes do not make a material difference in the definition of the clusters.
The sum of the squares of errors between the points and the corresponding centroids, is equal to the total intra-cluster variance
E(C) =Σj=1:kΣxi ∈ Cj||xi − cj||2
[image:2.595.41.278.480.632.2]Fig1 is example of K-means clustering method where Center is denoted by + sign. One of the main disadvantages to k-means is the fact that you must specify the number of clusters as an input to the algorithm. The algorithm is not capable of determining the appropriate number of clusters and depends upon the user to identify this in advance. For this reason, it’s often a good idea to experiment with different values of k to identify the value that best suits your data.
Figure.1: Example of K-means clustering
This method does not work well with categorical attributes; it has a good geometric and statistical sense for numerical attributes.
B. Hierarchical Clustering:
Hierarchical clustering is a method of cluster analysis which seeks to build a hierarchy of clusters in Data Mining. Hierarchical clustering generally divided into two types [15]:
a. Agglomerative: This is also called as "bottom up" approach: It initiates with each object forming its own group. For every pair of cluster, some value of
dissimilarity is computed, then clusters are merged until termination condition reached. Merging of clusters are based on Euclidean distance between any two objects from different clusters.
b. Divisive: This is also called as a "top down" approach: It initiates first all objects in one cluster then this cluster is splits with smaller cluster until termination condition reached, which is usually set by user.
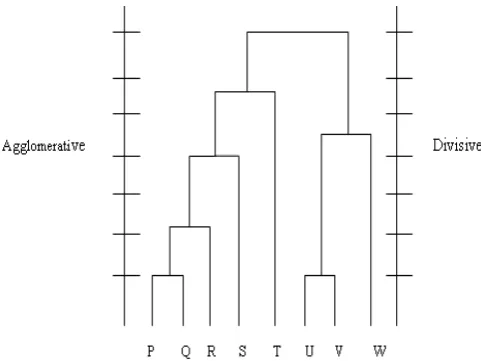
In general, the Hierarchical clustering builds a cluster hierarchy or a tree of clusters, also known as a dendrogram shown in fig.2. Every cluster node contains child clusters; sibling clusters partition the points covered by their common parent. Such an approach allows exploring data on different levels of granularity. This method easily handling similarity or distance of objects and it applicable to any attributes types. Drawback of this algorithm is it does not revisit (Intermediate) clusters once constructed.
(a). Simple Agglomerative Clustering Algorithm:
a) Initialize the cluster set assuming each data point is a distinct cluster.
b) Compute the similarity between all pairs of clusters, i.e. calculate the similarity between the ith and jth clusters.
c) Merge the most similar(closest) two clusters. d) Update the similarity matrix to reflect the pair-wise
similarity between the new cluster and the original clusters.
e) Repeat steps 3 and 4 until only a single cluster remains.
The hierarchical clustering methods could be further divided as per the similarity measure is calculated [16]:
Single-link clustering (also called the connectedness, the minimum method or the nearest neighbor method) - methods that consider the distance between two clusters to be equal to the shortest distance from any member of one cluster to any member of the other cluster. If the data consist of similarities, the similarity between a pair of clusters is considered to be equal to the greatest similarity from any member of one cluster to any member of the other cluster.
Complete-link clustering (also known as diameter, the maximum method or the furthest neighbor method) - methods that consider the distance between two clusters to be equal to the longest distance from any member of one cluster to any member of the other cluster.
[image:2.595.317.558.577.757.2]Average-link clustering (also known as minimum variance method) methods that consider the distance between two clusters to be equal to the average distance from any member of one cluster to any member of the other cluster [9, 10].
C. Density-Based Clustering Method:
Density-based approaches apply a local cluster criterion. Clusters are regarded as regions in the data space in which the objects are dense, and which are separated by regions of low object density (noise). These regions may have an arbitrary shape and the points inside a region may be arbitrarily distributed. A cluster, defined as a connected dense component, grows in any direction that density leads. Therefore, density-based algorithms are capable of discovering clusters of arbitrary shapes. Also this provides a natural protection against outliers. Density-based algorithms are scalable. These outstanding properties are tempered with certain inconveniences. One inconvenience is that a single dense cluster consisting of two adjacent areas with significantly different densities (both higher than a threshold) is not very informative. Another drawback is a lack of interpretability [15].
There are two major approaches for density-based method. The first approach pins density to a training data point, Density-Based Connectivity. Representative algorithms include DBSCAN, GDBSCAN, OPTICS, and DBCLASD.
[image:3.595.37.277.417.695.2]The second approach pins density to a point in the attribute space and is represented by the algorithm DENCLUE that is lesser affected by data dimensionality.
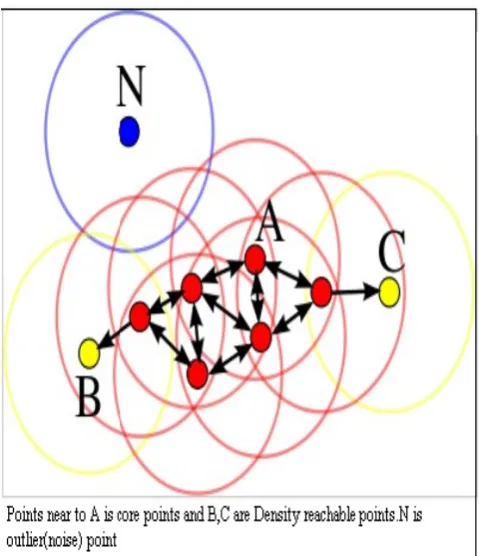
Figure.3: Example of Density-based clustering Method
The algorithm DBSCAN (Density Based Spatial Clustering of Applications with Noise) [14] targeting low-dimensional spatial data is the major representative in this category. Two input parameters ∈ and MinPts are used to introduce:
a. An ∈-neighborhood N∈(x) = {y ∈X | dist(x, y) ≤∈} of the point x,
b. A core object, a point with a |N∈(x)| ≥ MinPts. c. A notion of a point y density-reachable from a core
object x (a sequence of core objects between x and y exists such that each next belongs to an ∈ -neighborhood of its predecessor).
d. A definition of density-connectivity between two points x, y (they should be density-reachable from a common core object).
Density-connectivity is an equivalence relation. All the points reachable from core objects can be factorized into maximal connected components serving as clusters. The points not connected to any core point are declared to be outliers (they are not covered by any cluster) as shown in fig.3. The non-core points inside a cluster represent its boundary. Finally, core objects are internal points. DBSCAN processing is independent of data ordering. Obviously, an effective computing of ∈-neighborhoods presents a problem.
III. PERFORMANCE EVALUATION OF CLUSTERING METHODS
In this section, we first discuss the datasets used for empirical study. Next, we briefly discuss about the software used for experiment.
A. Datasets:
[image:3.595.330.547.508.591.2]We have collected publicly available Datasets from internet for empirical study .Among collected datasets some are low dimensional and some are high dimensional. Publicly available datasets IRIS[18], ANNEAL[18], SRBCT[17] and LYMPHOMA[17] downloaded from internet. Iris dataset has 5 features, 150 instances and Anneal has 39 features, 898 instances. SRBCT has 2309 features, 83 instances and Lymphoma dataset has 4027 features and 66 instances as shown in Table I.
Table I: Datasets for empirical study
Datasets Features Instances
IRIS 5 150
ANNEAL 39 898
SRBCT 2309 83
LYMPHOMA 4027 66
For showing experimental results, we used WEKA software; it is Data Mining tool [13]. Weka is open source software under the GNU General Public License. “Weka” stands for the Waikato Environment for knowledge Analysis. System is developed at the University of Waikato in New Zealand. The software is freely available on website with different versions http://www.cs.waikato.ac.nz/ml/weka. We chooses weka version 3.7.10 for implementation. The system is written using object oriented language Java. Weka provides implementations of state-of-art data mining and machine learning algorithms. Weka contains modules for data preprocessing, classification, clustering and association rule extraction. Weka use only ARFF and CSV extension files.
time required to execute the dataset with K-means, then Hierarchical and Density-based clustering methods. Same procedure follows for remaining datasets. We performed comparison based on time required to compute the dataset by keeping clusters size fixed. Here we Performed operation for K-means, Hierarchical and Density-based clustering methods for two clusters.
IV. EXPERIMENTAL RESULTS AND DISCUSSION
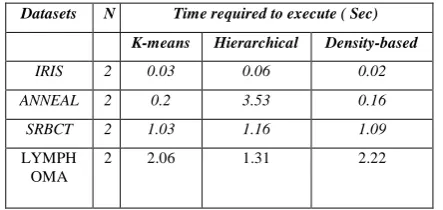
[image:4.595.317.562.53.210.2]Here we present the experimental work and results about our proposed work. First we calculated average time required forming cluster for K-means, Hierarchical and Density-based for chosen datasets as shown in table II, N denotes a number of clusters for each clustering method, which we have fixed as two clusters. IRIS dataset has very less attributes so time required to execute this dataset is noted as 0.03 sec for K-means, 0.06 sec for Hierarchical and 0.02 sec for Density-based clustering method. Through observation we found that Hierarchical clustering takes more time for evaluating IRIS dataset than other two methods.
Table 2: Average execution Time required for clustering methods for each dataset
Datasets N Time required to execute ( Sec)
K-means Hierarchical Density-based
IRIS 2 0.03 0.06 0.02
ANNEAL 2 0.2 3.53 0.16
SRBCT 2 1.03 1.16 1.09
LYMPH OMA
2 2.06 1.31 2.22
Executing time of Anneal dataset for k-means is 0.02 sec, Hierarchical takes 3.53 sec and Density-based takes 0.16 sec. Here we can observe that Hierarchical takes much time than k-means and density-based methods. IRIS dataset execution time for Hierarchical clustering method is not much varies, but for Anneal dataset it is more difference in time comparatively other two methods. Here Anneal dataset have 39 attributes and 898 instances. We have observed that for hierarchical method, execution time depends not only on number of attributes but also on number of its instances for that dataset. Execution time of K-means and density-based not affected for number of instances. Time noted for these two methods are less even though the large number of instances for anneal dataset.
For SRBCT dataset have large features set and fewer instances so time required for k-means is 1.03 sec, Hierarchical 1.16 sec and Density-based is 1.09 sec .K-means take less time for large features as comparatively others. Lymphoma dataset have large features 4027 and less instances so building model time for k-means is 2.06 sec, Hierarchical takes 1.31 sec and density-based is 2.22 sec. Here we observed that Hierarchical clustering take less time than other two methods even though the features are large in number but here instances are very few.
[image:4.595.48.270.333.438.2]By this observation we plotted a graph which shows comparisons of three clustering methods based on average time for forming cluster for different dataset shown in figure 4.
Figure .4: Comparison graph of clustering methods on different Datasets
We observed that K-means clustering takes less time for executing dataset as compared to Density-based. Hierarchical time vary based on number of features and instances of dataset. In fig .4 we found that time required for 39 features in hierarchical method is suddenly increase because the number of instances are more in number. Density-based time is in-between K-means and hierarchical clustering methods. For high dimensional data density-based method takes more time than hierarchical method only in case of less instances of dataset. In fig.4 we found that for density –based method takes more time for executing Lymphoma dataset than other two methods.
V. CONCLUSION
In this paper we have shown comparison of three Clustering methods K-means, Hierarchical and Density-based. We evaluated average time required for forming clusters for these clustering methods on different datasets. We fixed the number of cluster size for each method as two clusters. By experimental observations we found that K-means method takes less time for evaluating each dataset as compares to other two clustering methods.
Hierarchical method takes more time for executing datasets which have large number of instances as compare to other two clustering methods. While Density-based clustering method execution time is in between k-means and Hierarchical method. Only in case of high dimensional dataset some times (depends on dataset) density-based takes more time compare to other two methods.
Here we formed only two clusters for each clustering method. Changing the number of cluster size and depend on dataset used results may vary.
VI. REFERENCES
[1] P. Arabie and L.J. Hubert. An overview of combinatorial data analysis. In P. Arabie, L.J. Hubert, and G.D. Soete, editors, Clustering and Classification, pages 5–63. World Scientific Publishing Co., 1996.
[2] R. O. Duda and P. E. Hart. Pattern Classification and Scene Analysis. Wiley, 1973.
[4] C. Daniel and F.C. Wood. Fitting Equations To Data: Computer Analysis of Multifactor Data. John Wiley and Sons, New York, NY, USA, 1980.
[5] D. R. Cutting, D. R. Karger, J. O. Pedersen, and J. W. Tukey. Scatter/gather: A cluster-based approach to browsing large document collections. In ACMSIGIR, 1992.
[6] I. Cadez, P. Smyth, and H. Mannila. Probabilistic modeling of transactional data with applications to profiling, visualization, and prediction. In Proceedings of the 7th ACM SIGKDD, pages 37–46, San Francisco, CA, USA, 2001.
[7] R. Cooley, B. Mobasher, and J. Srivastava. Data preparation for mining world wide web browsing. Journal of Knowledge Information Systems, 1(1):5–32, 1999.
[8] A. Ben-Dor and Z Yakhini. Clustering gene expression patterns. In Proceedings of the 3rd Annual International Conference on Computational Molecular Biology (RECOMB 99), pages 11–14, Lyon, France, 1999.
[9] F. Murtagh. Multidimensional Clustering Algorithms. Physica-Verlag, Vienna,Austria, 1985.
[10] C. Olson. Parallel algorithms for hierarchical clustering. Parallel Computing,21:1313–1325, 1995.
[11] J. A. Hartigan. Clustering Algorithms. Wiley, 1975.
[12] J. Hartigan and M. Wong. Algorithm as136: A k-means clustering algorithm. Applied Statistics, 28:100–108, 1979.
[13] Remco R. Bouckaert,Eibe Frank,Mark Hall,Richard Kirkby,Peter Reutemann,Alex Seewald,David Scuse, WEKA Manual for Version 3-7-10,July 31, 2013.
[14] M. Ester, H-P. Kriegel, J. Sander, and X. Xu. A density-based algorithm for discovering clusters in large spatial databases with noise. In Proceedings of the 2nd ACM.
[15] Pavel Berkhin,A Survey of Clustering Data Mining,TechniquesYahoo!,2002 Inc.
[16] Lior Rokach, Oded Maimon,Clustering Methods Data Mining and Knowledge Discovery Handbook.
[17] http://csse.szu.edu.cn/staff/zhuzx/Datasets.html.
[18] http://repository.seasr.org/Datasets/UCI/arff/