DOI: http://dx.doi.org/10.26483/ijarcs.v8i7.4290
Volume 8, No. 7, July – August 2017
International Journal of Advanced Research in Computer Science
RESEARCH PAPER
Available Online at www.ijarcs.info
ISSN No. 0976-5697
MAMMOGRAM IMAGES DETECTION USING SUPPORT VECTOR MACHINES
Dr.M.Rajasekar
Computer Science & Engineering VNRVJIET
Hyderabad, India
Dr.N.Sandhya
Computer Science & Engineering VNRVJIET
Hyderabad, India
Abstract: Breast cancer begins when an abnormal growth of cells takes place in the breast. We formulated a procedure which explains identification of cancer cells in breast cancer X-ray images. This study is useful for doctors to discover abnormal tissues in given set of X-ray images. The initial phase of this procedure intended to enhance the mammogram image sequence. Initial phase is data cleaning phase in which noise is removed and emphasizing the inner structure of the mammogram image. In the second phase CNNs are used to segment the regions which consists of cancer cells. These regions may have various shapes like circular density, eccentricity, density, circularity and circular disproportion. Shape descriptors are used to asses the shapes of the regions of interest. Textures are analyzed with the help of geostatistic functions like Geary’s index and Moran’s index. SVMs are used to categorize the brain image into two regions such as non-masses and masses, with 0.3 false negative value per mammogram image, 0.86 false positive value per mammogram image, sensitivity 79% and ROC value 90%.
Keywords:SVMs, geostatistic functions, breast cancer images, cellular non linear networks(CNN)
INTRODUCTION
From the past few years, various researchers have been published articles to identify breast cancer textures in mammograms images. These researchers developed an automated system with help of computers to detect breast cancer tissues. Developed automated systems are useful to the doctors as a reliable source of information and also saves the precious time. The accuracy of implemented system relies on the attribute extraction and segmentation of the regions of interest. Our study offers a computer aided procedure to assist an expert to identify abnormal growth in breast cancer images. In this method we used cellular non linear networks for segmenting mammogram image regions and which are useful to obtain the attributes from mammogram images. Gray’s index, Moran’s index and Ripley’s k functions are used to understand the texture in breast cancer images. In the final phase of this procedure, supervised SVMs are used to categorize obtained sample areas of the brain images into masses or non masses. There are three possible forms mass in the extracted region namely benign, neoplasm and malignant. The significant role of this study is explaining the importance of CNN to divide the doubtful regions in the breast cancer images. This study also describes about the usage of geostatistical functions in the identification mass present in mammograms. The results of this study are useful to an expert in assessing the intensity of breast cancer when visualization is very hard.
In this study, section 2 explains about brief description of literature survey. Section 3 explains the methods for identification, categorization, authentication of features which are extracted from mammograms and recommended procedure and its assessment. Section 4 explains the results of this study and purpose of methods which are used. Section 5 describes conclusion of this study.
LITERATURESURVEY
Several procedures are formulated that can helpful to identify breast cancer in mammogram images. Various algorithms were suggested for identifying masses in mammogram images ([1-5]). These algorithms accomplished sensitivity ranging from 77% to 88%, and false positive is 0.43 to 5.1 per an image. In this study we used publicly available breast cancer image database like DDSM [6-10] and MIAS [11-13]. CNNs are exclusively used in various applications to process mammogram images [14-15]. Rekeczky et al.[16] formulated methods for the categorization of medical images especially mammogram images. Medical images may be MRI images, CT images and ultrasonic images. Chua et al. [17-19] used CNNs to verify the features of mammograms.
The accuracy of Support vector machines and Linear Discriminant analysis are compared by Costa et al. [20- 22], categorized 200 regions into 100 normal tissues, 50 malignant issues and 50 benign tissues and these images are collected from MIAS and DDSM database which consists of huge set of mammogram images. The accuracy of the results in the case of MIAS database is 85% for LDA and 97% for Support vector machines respectively. The accuracy of the results in the case of DDSM database is 89.2% for LDA and 99.6% for Support vector machines respectively. Hence SVMs shows superior performance compare to Linear Discriminant Analysis.
There are methods which are based on SOM (Self Organizing Maps) to detect mammogram images [20]. Oliveira et al. [14] formulated a method based on GNG (Growing Neural Gas) to divide the mass sample regions and Ripley’s values associated with support vector machines to identify textures in breast cancer images. They worked extensively on DDSM image databases and obtained remarkable accuracy in classifying breast cancer images.
regions. The formulated procedure was examined with 650 breast cancer images collected from the DDSM database and obtained 83% of classification accuracy.
Wang et al. [11] formulated a methodology for identification of masses in breast cancer images by applying pixel based approach. In this approach measurements like gradient, standard deviation, average, invariant momentum and gradient related boundary calculations are used. Attributes like sphericity, density, circularity and Fourier descriptors are also used in the assessment of masses present in mammogram images. They used 192 mammograms used for training and 150 mammograms for testing. This algorithm accomplished 78.6% of accuracy rate and the value of 3.6 false positive per image. Pereira et al. [12] examines the identification of masses using ridgelet transforms, oblique views and craniocaudal methods. They used DDSM mammogram database from which 300 images were selected for training 154 mammogram images for testing. This procedure accomplished an accuracy of 79%. From this related work, we can realize the significance of identifying masses in the mammogram images. Various methods of machine learning are used to enhance the classification of texture in the brain image into masses and normal. Hence, it appears to be very useful to use cellular networks to classify breast cancer related images by extracting different features from mammograms.
PROPOSEDALGORITHMAND DISCUSSION
This section explains the procedure to identify masses in breast cancer images. There are various phases in the proposed methodology like attainment, cleaning, dividing the texture regions, attribute acquisition, selection of attribute and categorization of textures in mammograms into non masses and masses.
The first phase of this proposed procedure is obtaining mammogram image and subsequent phases are cleaning, dividing the regions in to segments and obtaining attributes. In the phase of cleaning, noise data is eliminated by clustering algorithms, Hough’s transform, histograms, operators related to erosion and Cranny’s filter. CNNs are used to identify mammograms with textures, hence subsequent phases operate within the desired region.
The attributes are obtained with help of shapes like circular density, circularity, eccentricity, compactness, circular disproportion and methods like Geary’s, Ripley and Moran’s index. Conclusively, the support vector machines are used to remove the non masses from given set of breast cancer images.
A. Acquirement Of Mammogram Images
This study is carried out by making use of publicly available database DDSM (Digital database for screening mammography). This database is built by Washington University, Massachusetts General Hospital, Washington University, Wake Forest University and St. Louis school of medicine. This database contains huge set of freely available of mammogram images. MLO view and CC view of breast cancer images are collected by considering the parameters like number of difficulties, pathological variations, person age and time of study. The design of DDSM also consider the number of bits per pixel, sequence, kind of film, digitalization time and types
of digitizer. Logical and physical design and implementation of DDSM is based on the information supplied by specialists. In our study we have been used 898 mammogram images from this database. These mammogram images are chosen arbitrarily from DDSM. While choosing the mammogram images from DDSM, criteria followed was that each mammogram must have only one mass.
B. Preprocessing
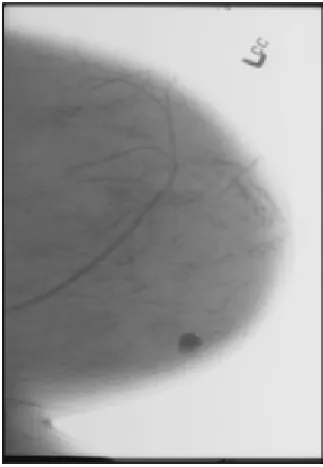
[image:2.595.351.513.304.538.2]Preprocessing is a phase in which an inconsistent mammogram images are transformed into consistent mammogram images collected from DDSM. In this stage noise data, invalid data and incomplete data is removed. Noise may be in the form of background of mammogram, defects in the image, problems in digitalization and difficulties in individual breast identification. The internal structure of breast is enhanced by eliminating the unnecessary stuff from mammogram which leads to obtain the significant and useful information. This can be seen in the Fig. 2. In the preprocessing, initially mammogram image size is reduced to the size of 1000x1000, which can be seen in Figure 3(a).
[image:2.595.316.552.565.709.2]Fig 1 Image is with noise elements
Reduction of mammogram is needed to speed up the preprocessing time. As a second phase of the preprocessing, boundaries of the mammogram images are eliminated. As a consequence of this phase quality of mammogram images are enhanced.
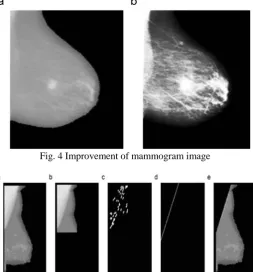
[image:3.595.310.564.58.331.2]Background of the mammogram is removed with well known K-means clustering algorithm by using pixel intensity information. As a consequence of this phase, all gray level intensity pixels which are closely associated with block color are eliminated which can be seen in Figure 3(b). This K-means clustering algorithms separates regions of mammogram into two groups in which one group consists of pixels with less intensity and another group with high intensity. Pixels with high intensity represents identification marks of the mammogram and whereas pixel with low intensity represents noise and background. Lower intensity pixels (background and noise related pixels) are removed by changing their values to zero which is shown in Fig. 3(c). After this preprocessing step also there are few more noise and back ground pixels exists in the mammogram images which can be eliminated by using region growing algorithms [12]. These regions growing algorithms are used to select appropriate breast are by separating mutually exclusively regions which can be seen in Fig. 4.
Fig. 3 Segmentation process of mammogram image
Visualization and structure of the mammograms are significantly improved by histogram equalization algorithms which is shown in Fig. 5. Chest muscles in MLO viewed mammograms removed in the final phase of the preprocessing methodology. Chest muscles are identified by calculating average intensity values of the divided mammogram image as shown in Fig. 5. Mammogram image boundaries are identified by Cany’s filter [22] and removed all these detected boundaries with the help of morphological operators. Hough transform is used to remove the noise in the borders of mammogram images as shown in Fig.4.
C.
S
egmentationThis phase is useful to detect mammogram images with masses with cellular non linear networks [20]. In this
[image:3.595.36.289.342.522.2]Fig. 4 Improvement of mammogram image
Fig. 5 Algorithm generated image
CNNs are constructed by Cartesian coordinate system with the help of rectangular matrix of order mxn using the following formula
In the above formula u indicates number of steps in particular iteration and s is the radius of the identified cell which is useful CNNs. The parameters y, z, v and a are treated as state, input mammogram image, out put mammogram image and threshold value of cell c(j, k) respectively. In equation1, B denotes feedback involution operator and C denotes syntactic weighted input. Mammogram image pixel intensity values are calculated by vlm which is to be normalized between -1 and +1.
There are two types of templates which are used in this study in which first one is Textudier[18] to separate masses from mammogram image and second one is Blur[19] to enhance the processing speed.Empirical calculation of these mammogram images.Blur and Textudi are used to remove duplication with help of logical operator. Region growing methods are used to remove the candidate mammograms which are not satisfying size criteria as shown in Fig.5.
D. Feature Extraction
this phase uses shape information of the mammogram images instead of pixels’ intensity information. Concentric rings [22] are formed with the help of Replay’s mapping to identify texture of the mammogram images. ROIs in the mammogram images are calculated using Grey index and Moran’s index.
Formula for Replay’s mapping is
here L represents Replay’s mapping, s is the radius of the concentric ring, B represents are of the concentric ring, j is the sample pixel, e is the distance function, j, k represents pixel position with respect to origin.
Equation 4 represents Greary’s index and e quation 5 represents Moran’s index in which o represents number of mammogram imags, X represents weight of the mammogram images.These indexes are calculated with the angles 0, 45, 90 and 135 degrees.In this study we used 450 vectors representing mass classes and 3000 vectors representing mammogram images with non masses.
CLASSIFICATIONOFMAMMOGRAMIMAGES
In the phase of classification, mammogram images are classified into two groups in which first one is training mammogram images and second one testing mammogram images. Support vector machines are used to classify mammogram images into two groups one with masses and another with non masses.
Here k is biased parameter, v is the weight and h is the linear combination of variables.
This can be represented in the form Wolf programming with conditions.
Here v and delta are part of objective function. Conditions which are represented in equation 7 are known as Kuntucker conditions.
Equation 8 is another form of equation 6 which is useful to formulating hyper plane in support vector machines.
Equation 9 and 10 are useful for finding optimal hyper plane which optimally separates the given set of mammogram image into two sets one with masses and another with non masses.
Equation 11 and 12 are useful to build desired kernel in the support vector machine algorithm. In this study, the support vector machines are used with different kernels which are formed with help of equation 6 to equation 12.
RESULTSANDDISCUSSION
Methodology which is presented in this paper is evaluated by performing various tests with different test cases. In this phase results of several procedures are discussed.
The 623 mammogram images are correctly divided into segments with the accuracy 92%. The results proven that mammogram image segmentation phase significantly improved the efficiency of accuracy. Classification of mammogram images are performed in two stages in which first stage analysis is done without reducing the attributes and in second stage performed with reducing the attributes. In our work total set of mammogram images are classified into 10 major groups. Bias in the image classification is avoided by training and testing all the groups under consideration. Training data forms the basis to identify support vectors which are useful for constructing decision surface. Number of vectors for non-mass and masses are identified as 1600 and 200 respectively.
In our study, we used two procedures in which first one uses texture and shape information of mammogram image to classify as non-masses and masses. Such results indicate that the combination of shape descriptors, Ripley’s K function, and Moran’s and Geary’s indexes provides a good tool to characterize regions suspect of containing masses. Another important remark is the performance of the analysis involving only the texture descriptors (Ripley’s K function and Moran’s and Geary’s indexes), which achieved an accuracy of 81.66%, sensitivity of 81.75% and specificity of 81.86%, with average rates of false positives and false negatives per image of 1.06 and 0.18, respectively, and an area under the ROC curve of 0.861 as shown in Table3 and Table4.
Despite the good results obtained, several aspects of the methodology can be improved, allowing for even better results. One of these aspects is the performance of the segmentation stage, where nearly 9.15% of the original masses were lost. We also observed that the objects classified as masses have areas smaller than the area informed by the DDSM (overlay index below 0.4, on average). This did not constitute a problem, but it indicates that larger masses can be divided into smaller ones, which might impact texture analysis, causing the mass to be classified as a false negative. Additional studies must be carried out to determine to what extent and how often this happens.
Another problem found in segmentation is the large number of regions of interest selected (566 regions containing masses and 3305 with healthy tissue). This numerical disproportion between the two classes ends up influencing the classifier, since much more information is available about one class in relation to the other. This has led to the need to use different weights for SVM training, in order to reach a balance between sensitivity and specificity. A solution can be obtained through parameter optimization algorithms (genetic algorithms, fuzzy systems) to find a single template that can reduce the amount of false candidates and increase the proportion of masses found.
Table 1:Results without attribute identification
Se Sp Ac Fri AU
C
Geary 52 65 55 2.0 0.58
Moran 74 66 52 2.61 0.65
Happy 71 56 55 1.9 0.67
Moran +
Geary 68 73 76 1.3 0.79
Shape 78 63 67 1.1 0.80
[image:5.595.305.566.85.231.2]Reply 89 58 70 1.1 0.74
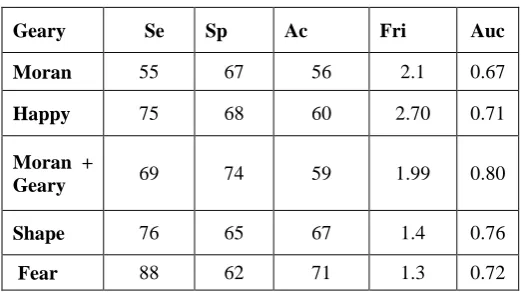
Table 2:Results with attribute identification
Geary Se Sp Ac Fri Auc
Moran 55 67 56 2.1 0.67
Happy 75 68 60 2.70 0.71
Moran +
Geary 69 74 59 1.99 0.80
Shape 76 65 67 1.4 0.76
[image:5.595.315.566.262.579.2]Fear 88 62 71 1.3 0.72
Table 3:Results of mammograms classification with SVMs
D-SVM
Geary Moran Shape Reply
SVM-1 0.73 0.45 0.654
SVM-2 0.540 0.513 0.6256
D-SVM
SVM-1 Happy Anger Surprise
SVM-2 0.415 0.538 0.5317
NNH 0.335 0.3223 0.473
CD-SVM Geary Moran Shape Reply
SA+SVM
Linear 0.425 0.654 0.482
SA+SVM
RBF 0.337 0.542 0.461
DV-SVM
SA+SVM
Poly 0.456 0.543 0.432
DC-SVM
Geary Moran Shape Reply
Frequency
Count 0.5285 0.538 0.531
TF-IDF 0.4509 0.4737 0.588
V-SVM
Geary Moran Shape Reply Frequency
Count 0.527 0.5376 0.5337
TF-IDF 0.475 0.473 0.5872
C-SVM
Geary Moran Shape Reply
NCRA 0.405 0.876 0.442
TF-IDF 0.343 0.543 0.432
Table 4:Results with different database
Methods/
Data base DDSM
MAGIC-5 Propriety MIA BEA
Nunes et al 65 71 65 66 67
Martins et
al 76 65 62 62 71
KOM et al 75 71 70 64 76
Norbert 82 70 62 59 67
Our
CONCLUSION
The algorithm discussed in the previous section shows significant performance in the context of mammogram image classification with respect to regions of interest. In the sample of 1020 mammogram images 980 mammogram images regions are divided accurately and achieved accuracy of 96.07%. The categorization of mammogram images achieved precision of 87%, sensitivity of 89%, false negative 0.4 and 0.85 false positive per image.
These results prove that the use of descriptors like Geary’s descriptor, Moran’s indicator and Ripley’s function gives significant performance in the classification masses of mammogram images. There are few limitations in this study like segmentation phase in which original masses were not properly classified, handling false negative images, handling large number of regions, identifying different weights for training the support vector machine. These problems can handle with the help of the algorithms like fuzzy algorithm and genetic algorithms.
REFERENCES
[1] Abdel-Mottaleb,M., Elgammal, A., “Face Detection in complex environments from color images,’’ IEEE ICIP, pp. 622- 626, Oct. 2016.
[2] Aizerman, M., Braverman, E., Rozonoer, L.. "Theoretical foundations of the potential function method in pattern recognition learning". Automation and Remote Control25: 821–837, 2014.
[3] Antonio J. Colmenarez and Thomas S. Huang. Face detection with information-based maximum discrimination. In Computer Vision and Pattern Recognition, pp 782–787, 2015.
[4] Bellaire, G., Schluns, K., Oppermann, K., Schimke, W., "Matching Using Object Models Generated from Photometric Stereo Images", Proc. Machine Vision Applications in Industrial Inspection IV, SPIE Vol. 2665, San Jose, Califomia, pp. 70-81, 2015.
[5] M.Raja Sekar, “Region classification using SVMs”, Journal of Geomatics, pp 87-89, 2007.
[6] M.Raja Sekar, “Automatic Vehicle Identification” Journal of Advanced Research in Computer Engineering, pp 0974-4320, 2015.
[7] M.Raja Sekar “FER from Image sequence using SVMs “, Journal of Data Engineering and computer science, pp 80-89, 2016.
[8] Burges, C. J. C., A tutorial on support vector machines for pattern recognition. Data Mining and Knowledge Discovery, 2(2):pp 121–167, 2015.
[9] Behrooz Kamgar-Parsi, Behzad Kamgar-Parsi, Jain, A., Dayhoff, J., “Aircraft Detection: A Case Study in Using Human Similarity Measure”, IEEE Trans. Pattern Analysis and Machine Intelligence, Vol. 23, No. 12, 2001, pp. 1404-1414,2016.
[10] Beymer, D. J., Face recognition under varying pose. AI Memo 1461, Center for Biological and Computational Learning, M.I.T., Cambridge, MA, 2016.
[11] Brunelli, R., Poggio, T., Face recognition: Features versus templates. IEEE Transactions on Pattern Analysis and Machine Intelligence, 15(10):1042–1052, 2015.
[12] CHAPELLE, O., HAFFNE,R, P., AND VAPNIK, V. N. Support vector machines for histogram-based image classification. IEEE Transactions on Neural Networks 10, 5, 1055–1064, 2016.
[13] Cohen, I., Sebe, N., Garg, A., Lew, M.S., Huang, T.S., Facial Expression Recogni- tion From Video Sequences. In IEEE Intl Conf. on Multimedia and Expo (ICME), volume 2, pages 121 – 124, 2014.
[14] DORK ´O, G., AND SCHMID, C. Selection of scale-invariant parts for object class recognition. In IEEE International Conference on Computer Vision, vol. 1, pp. 634–639,2016.
[15] Daugman, J.G., “Uncertainty Relation for Resolution in Space, Spatial Frequency, and Orientation Optimized by Two-Dimensional Visual Cortical Filters”, Journal of Optical Society America A, Vol. 2, No. 7, 1985, pp. 1160 – 1169, 2016.
[16] FONSECA, E. S., R. C. GUIDO, A. C. S., AND PEREIRA, J. C., Discrete wavelet transform and support vector machine applied to pathological voice signals identifiction. In IEEE International Symposium on Multimedia ,2017.
[17] M.Raja Sekar, “ Image Authentication using SVMs”, Journal of Advanced Research in computer Engineering, p367-p374, 2015.
[18] M.Raja Sekar, “Classification of images using SVMs”, International Journal of Mathematics, Computer Sciences and Information Technology, p25-29,2014. [19] M.Raja Sekar, “Analysis of Images Using SVMS”
International Journal of Mathematics, Computer Sciences and Information, p 197-201,2015.
[20] M.Raja Sekar, “Implementation of recursive construction for building effective compression strategy”, JRRECS, P23-28, 2013.
[21] M.Raja Sekar, “An Effective Atlas-guided Brain image identification using X-rays”, IJSER, P23-29,2016. [22] J.Dugelay, J.,-C. Junqua, C., Kotropoulos, R., Kuhn, F.,