Human Evaluation of Machine Translation Through Binary System
Comparisons
David Vilar, Gregor Leusch and Hermann Ney Lehrstuhl f¨ur Informatik 6 RWTH Aachen University D-52056 Aachen, Germany
{vilar,leusch,ney}@cs.rwth-aachen.de
Rafael E. Banchs
D. of Signal Theory and Communications Universitat Polit`ecnica de Catalunya
08034 Barcelona, Spain [email protected]
Abstract
We introduce a novel evaluation scheme for the human evaluation of different machine translation systems. Our method is based on direct comparison of two sentences at a time by human judges. These binary judg-ments are then used to decide between all possible rankings of the systems. The ad-vantages of this new method are the lower dependency on extensive evaluation guide-lines, and a tighter focus on a typical eval-uation task, namely the ranking of systems. Furthermore we argue that machine transla-tion evaluatransla-tions should be regarded as sta-tistical processes, both for human and au-tomatic evaluation. We show how confi-dence ranges for state-of-the-art evaluation measures such as WER and TER can be computed accurately and efficiently without having to resort to Monte Carlo estimates. We give an example of our new evaluation scheme, as well as a comparison with classi-cal automatic and human evaluation on data from a recent international evaluation cam-paign.
1 Introduction
Evaluation of machine translation (MT) output is a difficult and still open problem. As in other natu-ral language processing tasks, automatic measures which try to asses the quality of the translation can be computed. The most widely known are the Word Error Rate (WER), the Position independent word Error Rate (PER), the NIST score (Dodding-ton, 2002) and, especially in recent years, the BLEU score (Papineni et al., 2002) and the Translation
Er-ror Rate (TER) (Snover et al., 2005). All of the-ses measures compare the system output with one or more gold standard references and produce a nu-merical value (score or error rate) which measures the similarity between the machine translation and a human produced one. Once such reference transla-tions are available, the evaluation can be carried out in a quick, efficient and reproducible manner.
However, automatic measures also have big dis-advantages; (Callison-Burch et al., 2006) describes some of them. A major problem is that a given sen-tence in one language can have several correct trans-lations in another language and thus, the measure of similarity with one or even a small amount of ref-erence translations will never be flexible enough to truly reflect the wide range of correct possibilities of a translation.1 This holds in particular for long sen-tences and wide- or open-domain tasks like the ones dealt with in current MT projects and evaluations.
If the actual quality of a translation in terms of usefulness for human users is to be evaluated, human evaluation needs to be carried out. This is however a costly and very time-consuming process. In this work we present a novel approach to human evalu-ation that simplifies the task for human judges. In-stead of having to assign numerical scores to each sentence to be evaluated, as is done in current evalu-ation procedures, human judges choose the best one out of two candidate translations. We show how this method can be used to rank an arbitrary number of systems and present a detailed analysis of the statis-tical significance of the method.
1
Compare this with speech recognition, where apart from orthographic variance there is only one correct reference.
2 State-of-the-art
The standard procedure for carrying out a human evaluation of machine translation output is based on the manual scoring of each sentence with two nu-merical values between 1 and 5. The first one mea-sures thefluencyof the sentence, that is its readabil-ity and understandabilreadabil-ity. This is a monolingual fea-ture which does not take the source sentence into account. The second one reflects theadequacy, that is whether the translated sentence is a correct trans-lation of the original sentence in the sense that the meaning is transferred. Since humans will be the end users of the generated output,2 it can be ex-pected that these human-produced measures will re-flect the usability and appropriateness of MT output better than any automatic measure.
This kind of human evaluation has however addi-tional problems. It is much more time consuming than the automatic evaluation, and because it is sub-jective, results are not reproducible, even from the same group of evaluators. Furthermore, there can be biases among the human judges. Large amounts of sentences must therefore be evaluated and proce-dures like evaluation normalization must be carried out before significant conclusions from the evalua-tion can be drawn. Another important drawback, which is also one of the causes of the aforemen-tioned problems, is that it is very difficult to define the meaning of the numerical scores precisely. Even if human judges have explicit evaluation guidelines at hand, they still find it difficult to assign a numeri-cal value which represents the quality of the transla-tion for many sentences (Koehn and Monz, 2006).
In this paper we present an alternative to this eval-uation scheme. Our method starts from the obser-vation that normally the final objective of a human evaluation is to find a “ranking” of different systems, and the absolute score for each system is not relevant (and it can even not be comparable between differ-ent evaluations). We focus on a method that aims to simplify the task of the judges and allows to rank the systems according to their translation quality.
3 Binary System Comparisons
The main idea of our method relies in the fact that a human evaluator, when presented two differ-ent translations of the same sdiffer-entence, can normally choose the best one out of them in a more or less
2
With the exception of cross-language information retrieval and similar tasks.
definite way. In social sciences, a similar method has been proposed by (Thurstone, 1927).
3.1 Comparison of Two Systems
For the comparison of two MT systems, a set of translated sentence pairs is selected. Each of these pairs consists of the translations of a particular source sentence from the two systems. The human judge is then asked to select the “best” translation of these two, or to mark the translations to be equally good. We are aware that the definition of “best” here is fuzzy. In our experiments, we made a point of not giving the evaluators explicit guidelines on how to decide between both translations. As a consequence, the judges were not to make a distinction between fluency and adequacy of the translation. This has a two-fold purpose: on the one hand it simplifies the decision procedure for the judges, as in most of the cases the decision is quite natural and they do not need to think explicitly in terms of fluency and ade-quacy. On the other hand, one should keep in mind that the final goal of an MT system is its usefulness for a human user, which is why we do not want to impose artificial constraints on the evaluation proce-dure. If only certain quality aspects of the systems are relevant for the ranking, for example if we want to focus on the fluency of the translations, explicit guidelines can be given to the judges. If the evalua-tors are bilingual they can use the original sentences to judge whether the information was preserved in the translation.
After our experiment, the human judges provided feedback on the evaluation process. We learned that the evaluators normally selected the translation which preserved most of the information from the original sentence. Thus, we expect to have a slight preference for adequacy over fluency in this evalu-ation process. Note however that adequacy and flu-ency have shown a high correlation3in previous ex-periments. This can be explained by noting that a low fluency renders the text incomprehensible and thus the adequacy score will also be low.
The difference in the amount of selected sen-tences of each system is an indicator of the differ-ence in quality between the systems. Statistics can be carried out in order to decide whether this differ-ence is statistically significant; we will describe this in more detail in Section 3.4.
3
3.2 Evaluation of Multiple Systems
We can generalize our method to find a ranking of several systems as follows: In this setting, we have a set ofnsystems. Furthermore, we have defined an order relationship “is better than” between pairs of these systems. Our goal now is to find an ordering of the systems, such that each system is better than its predecessor. In other words, this is just a sorting problem – as widely known in computer science.
Several efficient sorting algorithms can be found in the literature. Generally, the efficiency of sort-ing algorithms is measured in terms of the number of comparisons carried out. State-of-the-art sort-ing algorithms have a worst-case runnsort-ing time of O(nlogn), where n is the number of elements to sort. In our case, because such binary comparisons are very time consuming, we want to minimize the absolute number of comparisons needed. This mini-mization should be carried out in the strict sense, not just in an asymptotic manner.
(Knuth, 1973) discusses this issue in detail. It is relatively straightforward to show that, in the worst case, the minimum number of comparisons to be carried out to sort n elements is at least dlogn!e (for which nlogn is an approximation). It is not always possible to reach this minimum, however, as was proven e.g. for the casen= 12in (Wells, 1971) and forn = 13in (Peczarski, 2002). (Ford Jr and Johnson, 1959) propose an algorithm called merge
insertionwhich comes very close to the theoretical
limit. This algorithm is sketched in Figure 1. There are also algorithms with a better asymptotic runtime (Bui and Thanh, 1985), but they only take effect for values of n too large for our purposes (e.g., more than 100). Thus, using the algorithm from Figure 1 we can obtain the ordering of the systems with a (nearly) optimal number of comparisons.
3.3 Further Considerations
In Section 3.1 we described how to carry out the comparison between two systems when there is only one human judge carrying out this comparison. The comparison of systems is a very time consuming task. Therefore it is hardly possible for one judge to carry out the evaluation on a whole test corpus. Usually, subsets of these test corpora are selected for human evaluations instead. In order to obtain a better coverage of the test corpus, but also to try to alleviate the possible bias of a single evaluator, it is advantageous to have several evaluators carrying out the comparison between two systems. However,
there are two points that must be considered. The first one is the selection of sentences each hu-man judge should evaluate. Assume that we have al-ready decided the amount of sentencesmeach eval-uator has to work with (in our casem= 100). One possibility is that all human judges evaluate the same set of sentences, which presumably will cancel pos-sible biases of the evaluators. A second possibility is to give each judge a disjunct set of sentences. In this way we benefit from a higher coverage of the corpus, but do not have an explicit bias compensation.
In our experiments, we decided for a middle course: Each evaluator receives a randomly selected set of sentences. There are no restrictions on the se-lection process. This implicitly produces some over-lap while at the same time allowing for a larger set of sentences to be evaluated. To maintain the same conditions for each comparison, we also decided that each human judge should evaluate the same set of sentences for each system pair.
The other point to consider is how the evaluation results of each of the human judges should be com-bined into a decision for the whole system. One possibility would be to take only a “majority vote” among the evaluators to decide which system is the best. By doing this, however, possible quantitative information on the quality difference of the systems is not taken into account. Consequently, the output is strongly influenced by statistical fluctuations of the data and/or of the selected set of sentences to eval-uate. Thus, in order to combine the evaluations we just summed over all decisions to get a total count of sentences for each system.
3.4 Statistical Significance
The evaluation of MT systems by evaluating trans-lations of test sentences – be it automatic evaluation or human evaluation – must always be regarded as a statistical process: Whereas the outcome, or score
1. Make pairwise comparisons ofbn/2cdisjoint pairs of elements. (Ifnis odd, leave one element out). 2. Sort thebn/2clarger elements found in step 1, recursively by merge insertion.
3. Name thebn/2celements found in step 2a1, a2, . . . , abn/2c and the restb1, b2, . . . , bdn/2e, such that
a1 ≤a2 ≤ · · · ≤abn/2candbi≤aifor1≤i≤ bn/2c. Callb1 and thea’s the “main chain”.
4. Insert the remainingb’s into the main chain, using binary insertion, in the following order (ignore the
bjsuch thatj >dn/2e): b3, b2;b5, b4;b11, . . . , b6;. . .;btk, . . . , btk−1+1;. . . withtk=
2k+1+(−1)k
3 .
Figure 1: The merge insertion algorithm as presented in (Knuth, 1973).
distribution, and each evaluation result we achieve must be considered as a sample from that distribu-tion. Consequently, both human and automatic eval-uation results must undergo statistical analysis be-fore conclusions can be drawn from them.
A typical application of MT evaluation – for ex-ample in the method described in this paper – is to decide whether a given MT systemX, represented by a set of translated sentences, issignificantly better than another systemY with respect to a given eval-uation measure. This outcome is traditionally called
the alternative hypothesis. The opposite outcome,
namely that the two systems are equal, is known as the null hypothesis. We say that certain values ofRX, RY confirm thealternative hypothesisif the
null hypothesis can be rejected with a given level
of certainty, e.g. 95%. In the case of comparing two MT systems, the null hypothesis would be “both systems are equal with regard to the evaluation mea-sure; that is, both evaluation scoresR,R0come from the same distributionR0”.
As R is randomly distributed, it has an expecta-tion E[R]and a standard error se[R]. Assuming a normal distribution forR, we can reject the null hy-pothesis with a confidence of 95% if the sampled scoreR is more than1.96times the standard error away from the null hypothesis expectation:
Rsignificant ⇔ |E[R0]−R|>1.96se[R0] (1)
The question we have to solve is: How can we es-timateE[R0]andse[R0]? The first step is that we considerRandR0to share the same standard error
se[R0] = se[R]. This value can then be estimated from the test data. In a second step, we give an es-timate for E[R0], either inherent in the evaluation measure (see below), or from the estimate for the comparison systemR0.
A universal estimation method is the bootstrap estimate: The core idea is to create replications of
R by random sampling from the data set (Bisani and Ney, 2004). Bootstrapping is generally possi-ble for all evaluation measures. With a high number of replicates,se[R]andE[R0]can be estimated with satisfactory precision.
For a certain class of evaluation measures, these parameters can be estimated more accurately and ef-ficiently from the evaluation data without resorting to Monte Carlo estimates. This is the class of er-rors based on the arithmetic mean over a sentence-wise score: In our binary comparison experiments, each judge was given hypothesis translationsei,X,
ei,Y. She could then judge ei,X to be better than, equal to, or worse than ei,Y. All these judgments were counted over the systems. We define a sentence scoreri,X,Y for this evaluation method as follows:
ri,X,Y :=
+1 ei,X is better thanei,Y
0 ei,X is equal toei,Y −1 ei,X is worse thanei,Y
. (2)
Then, the total evaluation score for a binary com-parison of systemsXandY is
RX,Y :=
1
m
m X
i=1
ri,X,Y , (3)
withmthe number of evaluated sentences.
For this case, namelyRbeing an arithmetic mean, (Efron and Tibshirani, 1993) gives an explicit for-mula for the estimated standard error of the score
RX,Y. To simplify the notation, we will use R in-stead ofRX,Y from now on, andriinstead ofri,X,Y.
se[R] = 1
m−1
v u u t
m X
i=1
(ri−R)2. (4)
With x denoting the number of sentences where
whereri =−1,
R= x−y
m (5)
and with basic algebra
se[R] = 1
m−1
r
x+y−(x−y) 2
m . (6)
Moreover, we can explicitly give an estimate for
E[R0]: The null hypothesis is that both systems are “equally good”. Then, we should expect as many sentences where X is better than Y as vice versa, i.e.x=y. Thus,E[R0] = 0.
Using Equation 4, we calculate se[R]and thus a significance range for adequacy and fluency judg-ments. When comparing two systems X and Y, we assume for the null hypothesis that se[R0] =
se[RX]andE[R0] =E[RY](or vice versa). A very useful (and to our knowledge new) result for MT evaluation is that se[R]can also be explic-itly estimated for weighted means – such as WER, PER, and TER. These measures are defined as fol-lows: Letdi,i= 1, . . . , mdenote the number of “er-rors” (edit operations) of the translation candidateei with regard to a reference translation with lengthli. Then, the total error rate will be computed as
R:= 1
L
m X
i=1
di (7)
where
L:=
m X i=1
li (8)
As a result, each sentenceeiaffects the overall score with weight li – the effect of leaving out a sen-tence with length 40 is four times higher than that of leaving out one with length 10. Consequently, these weights must be considered when estimating the standard error ofR:
se[R] =
v u u t
1 (m−1)(L−1)
m X
i=1
di
li −R
2 ·li
(9) With this Equation, Monte-Carlo-estimates are no longer necessary for examining the significance of WER, PER, TER, etc. Unfortunately, we do not ex-pect such a short explicit formula to exist for the standard BLEU score. Still, a confidence range for BLEU can be estimated by bootstrapping (Och, 2003; Zhang and Vogel, 2004).
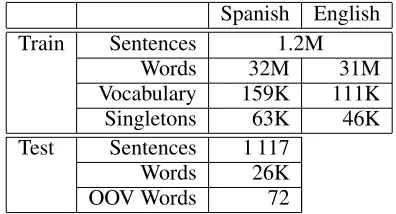
Spanish English
Train Sentences 1.2M
Words 32M 31M
Vocabulary 159K 111K
Singletons 63K 46K
Test Sentences 1 117
Words 26K
[image:5.612.327.525.54.161.2]OOV Words 72
Table 1: Statistics of the EPPS Corpus.
4 Evaluation Setup
The evaluation procedure was carried out on the data generated in the second evaluation campaign of the TC-STAR project4. The goal of this project is to build a speech-to-speech translation system that can deal with real life data. Three translation directions are dealt with in the project: Spanish to English, En-glish to Spanish and Chinese to EnEn-glish. For the sys-tem comparison we concentrated only in the English to Spanish direction.
The corpus for the Spanish–English language pair consists of the official version of the speeches held in the European Parliament Plenary Sessions (EPPS), as available on the web page of the European Parlia-ment. A more detailed description of the EPPS data can be found in (Vilar et al., 2005). Table 1 shows the statistics of the corpus.
A total of 9 different MT systems participated in this condition in the evaluation campaign that took place in February 2006. We selected five representa-tive systems for our study. Henceforth we shall refer to these systems as System A through System E. We restricted the number of systems in order to keep the evaluation effort manageable for a first experimental setup to test the feasibility of our method. The rank-ing of 5 systems can be carried out with as few as 7 comparisons, but the ranking of 9 systems requires 19 comparisons.
5 Evaluation Results
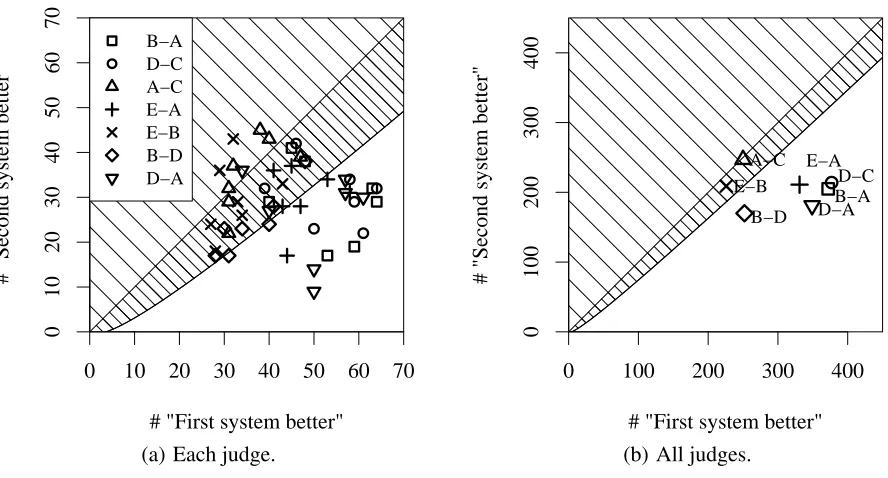
Seven human bilingual evaluators (6 native speakers and one near-native speaker of Spanish) carried out the evaluation. 100 sentences were randomly cho-sen and assigned to each of the evaluators for every system comparison, as discussed in Section 3.3. The results can be seen in Table 2 and Figure 2. Counts
0 10 20 30 40 50 60 70
0
10
20
30
40
50
60
70
●
● ● ●
● ● ●
# "First system better"
# "Second system better"
● B−A D−C A−C E−A E−B B−D D−A
(a) Each judge.
0 100 200 300 400
0
100
200
300
400
# "First system better"
# "Second system better"
● B−A
D−C
A−C E−A
E−B
B−D D−A
[image:6.612.82.526.65.304.2](b) All judges.
Figure 2: Results of the binary comparisons. Number of times the winning system was really judged “better” vs. number of times it was judged “worse”. Results in hatched area can not reject null hypothesis, i.e. would be considered insignificant.
missing to 100 and 700 respectively denote “same quality” decisions.
As can be seen from the results, in most of the cases the judges clearly favor one of the systems. The most notable exception is found when compar-ing systems A and C, where a difference of only 3 sentences is clearly not enough to decide between the two. Thus, the two bottom positions in the final ranking could be swapped.
Figure 2(a) shows the outcome for the binary comparisons separately for each judge, together with an analysis of the statistical significance of the re-sults. As can be seen, the number of samples (100) would have been too low to show significant re-sults in many experiments (data points in the hatched area). In some cases, the evaluator even judged bet-ter the system which was scored to be worse by the majority of the other evaluators (data points above the bisector). As Figure 2(b) shows, “the only thing better than data is more data”: When we summarize
R over all judges, we see a significant difference (with a confidence of 95%) at all comparisons but two (A vs. C, and E vs. B). It is interesting to note that exactly these two pairs do not show a significant difference when using a majority vote strategy.
Table 3 shows also the standard evaluation
met-rics. Three BLEU scores are given in this table, the one computed on the whole corpus, the one com-puted on the set used for standard adequacy and flu-ency computations and the ones on the set we se-lected for this task5. It can be seen that the BLEU scores are consistent across all data subsets. In this case the ranking according to this automatic measure matches exactly the ranking found by our method. When comparing with the adequacy and fluency scores, however, the ranking of the systems changes considerably: B D E C A. However, the difference between the three top systems is quite small. This can be seen in Figure 3, which shows some auto-matic and human scores for the five systems in our experiments, along with the estimated 95% confi-dence range. The bigger difference is found when comparing the bottom systems, namely System A and System C. While our method produces nearly no difference the adequacy and fluency scores indi-cate System C as clearly superior to System A. It is worth noting that the both groups use quite different translation approaches (statistical vs. rule-based).
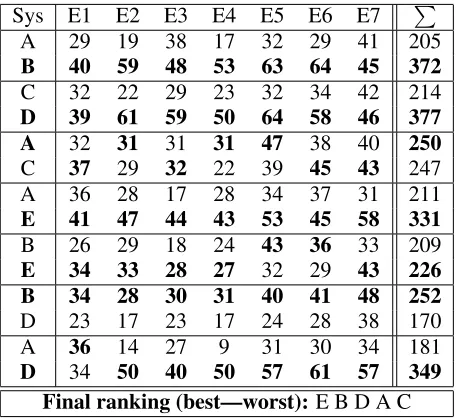
5
Sys E1 E2 E3 E4 E5 E6 E7 P
A 29 19 38 17 32 29 41 205
B 40 59 48 53 63 64 45 372
C 32 22 29 23 32 34 42 214
D 39 61 59 50 64 58 46 377
A 32 31 31 31 47 38 40 250
C 37 29 32 22 39 45 43 247
A 36 28 17 28 34 37 31 211
E 41 47 44 43 53 45 58 331
B 26 29 18 24 43 36 33 209
E 34 33 28 27 32 29 43 226
B 34 28 30 31 40 41 48 252
D 23 17 23 17 24 28 38 170
A 36 14 27 9 31 30 34 181
D 34 50 40 50 57 61 57 349
[image:7.612.312.528.40.242.2]Final ranking (best—worst):E B D A C
Table 2: Result of the binary system comparison. Numbers of sentences for which each system was judged better by each evaluator (E1-E7).
Subset: Whole A+F Binary
Sys BLEU BLEU A F BLEU
A 36.3 36.2 2.93 2.46 36.3
B 49.4 49.3 3.74 3.58 49.2
C 36.3 36.2 3.53 3.31 36.1
D 48.2 46.8 3.68 3.48 47.7
E 49.8 49.6 3.67 3.46 49.4
Table 3: BLEU scores and Adequacy and Fluency scores for the different systems and subsets of the whole test set. BLEU values in %, Adequacy (A) and Fluency (F) from 1 (worst) to 5 (best).
6 Discussion
In this section we will review the main drawbacks of the human evaluation listed in Section 2 and analyze how our approach deals with them. The first one was the use of explicit numerical scores, which are difficult to define exactly. Our system was mainly designed for the elimination of this issue.
Our evaluation continues to be time consuming. Even more, the number of individual comparisons needed is in the order oflog(n!), in contrast with the standard adequacy-fluency evaluation which needs
2nindividual evaluations (two evaluations per sys-tem, one for fluency, another one for adequacy). For
nin the range of 1 up to20 (a realistic number of systems for current evaluation campaigns) these two quantities are comparable. And actually each of our
C A D B E C A D B E C A D B E C A D B E
● ●
● ●
● ●
● ●
● ●
● ●
● ● ● ● ●
● ● ● Fluency
Adequacy
1−WER
BLEU
0.3 0.4 0.5 0.6 0.7 worse <− normalized score −> better
[image:7.612.72.300.53.262.2]Measure & System
Figure 3: Normalized evaluation scores. Higher scores are better. Solid lines show the 95% con-fidence range. Automatic scores calculated on the whole test set, human scores on the A+F subset.
evaluations should be simpler than the standard ad-equacy and fluency ones. Therefore the time needed for both evaluation procedures is probably similar.
Reproducibility of the evaluation is also an impor-tant concern. We computed the number of “errors” in the evaluation process, i.e. the number of sen-tences evaluated by two or more evaluators where the evaluators’ judgement was different. Only in 10% of the cases the evaluation was contradictory, in the sense that one evaluator chose one sentence as better than the other, while the other evaluator chose the other one. In 30% of the cases, however, one evaluator estimated both sentences to be of the same quality while the other judged one sentence as supe-rior to the other one. As comparison, for the fluency-adequacy judgement nearly one third of the com-mon evaluations have a difference in score greater or equal than two (where the maximum would be four), and another third a score difference of one point6.
With respect to biases, we feel that it is almost im-possible to eliminate them if humans are involved. If one of the judges prefers one kind of structure, there will a bias for a system producing such output, in-dependently of the evaluation procedure. However, the suppression of explicit numerical scores elimi-nates an additional bias of evaluators. It has been observed that human judges often give scores within
6
[image:7.612.72.303.323.415.2]a certain range (e.g. in the mid-range or only ex-treme values), which constitute an additional diffi-culty when carrying out the evaluation (Leusch et al., 2005). Our method suppresses this kind of bias.
Another advantage of our method is the possibil-ity of assessing improvements within one system. With one evaluation we can decide if some modi-fications actually improve performance. This eval-uation even gives us a confidence interval to weight the significance of an improvement. Carrying out a full adequacy-fluency analysis would require a lot more effort, without giving more useful results.
7 Conclusion
We presented a novel human evaluation technique that simplifies the task of the evaluators. Our method relies on two basic observations. The first one is that in most evaluations the final goal is to find a ranking of different systems, the absolute scores are usually not so relevant. Especially when considering human evaluation, the scores are not even comparable be-tween two evaluation campaigns. The second one is the fact that a human judge can normally choose the best one out of two translations, and this is a much easier process than the assessment of numeri-cal scores whose definition is not at all clear. Taking this into consideration we suggested a method that aims at finding a ranking of different MT systems based on the comparison of pairs of translation can-didates for a set of sentences to be evaluated.
A detailed analysis of the statistical significance of the method is presented and also applied to some wide-spread automatic measures. The evaluation methodology was applied for the ranking of 5 sys-tems that participated in the second evaluation cam-paign of the TC-STARproject and comparison with standard evaluation measures was performed.
8 Acknowledgements
We would like to thank the human judges who par-ticipated in the evaluation. This work has been funded by the integrated project TC-STAR– Tech-nology and Corpora for Speech-to-Speech Transla-tion – (IST-2002-FP6-506738).
References
M. Bisani and H. Ney. 2004. Bootstrap estimates for confidence intervals in ASR performance evaluationx. IEEE ICASSP, pages 409–412, Montreal, Canada, May.
T. Bui and M. Thanh. 1985. Significant improvements to the Ford-Johnson algorithm for sorting. BIT Numeri-cal Mathematics, 25(1):70–75.
C. Callison-Burch, M. Osborne, and P. Koehn. 2006. Re-evaluating the role of BLEUin machine translation re-search. Proceeding of the 11th Conference of the Eu-ropean Chapter of the ACL: EACL 2006, pages 249– 256, Trento, Italy, Apr.
G. Doddington. 2002. Automatic evaluation of ma-chine translation quality using n-gram co-occurrence statistics. Proc. ARPA Workshop on Human Language Technology.
B. Efron and R. J. Tibshirani. 1993. An Introduction to the Bootstrap. Chapman & Hall, New York and London.
L. Ford Jr and S. Johnson. 1959. A Tournament Problem. The American Mathematical Monthly, 66(5):387–389. D. E. Knuth. 1973. The Art of Computer Programming, volume 3. Addison-Wesley, 1st edition. Sorting and Searching.
P. Koehn and C. Monz. 2006. Manual and automatic evaluation of machine translation between european languages. Proceedings of the Workshop on Statisti-cal Machine Translation, pages 102–121, New York City, Jun.
G. Leusch, N. Ueffing, D. Vilar, and H. Ney. 2005. Preprocessing and normalization for automatic evalu-ation of machine translevalu-ation. 43rd ACL: Proc. Work-shop on Intrinsic and Extrinsic Evaluation Measures for MT and/or Summarization, pages 17–24, Ann Ar-bor, Michigan, Jun.
F. J. Och. 2003. Minimum error rate training in statisti-cal machine translation. Proc. of the 41st ACL, pages 160–167, Sapporo, Japan, Jul.
K. Papineni, S. Roukos, T. Ward, and W.-J. Zhu. 2002. Bleu: a method for automatic evaluation of machine translation. Proc. of the 40th ACL, pages 311–318, Philadelphia, PA, Jul.
M. Peczarski. 2002. Sorting 13 elements requires 34 comparisons. LNCS, 2461/2002:785–794, Sep. M. Snover, B. J. Dorr, R. Schwartz, J. Makhoul, L.
Micci-ulla, and R. Weischedel. 2005. A study of translation error rate with targeted human annotation. Technical Report LAMP-TR-126, CS-TR-4755, UMIACS-TR-2005-58, University of Maryland, College Park, MD. L. Thurstone. 1927. The method of paired comparisons
for social values.Journal of Abnormal and Social Psy-chology, 21:384–400.
D. Vilar, E. Matusov, S. Hasan, R. Zens, and H. Ney. 2005. Statistical Machine Translation of European Parliamentary Speeches. Proceedings of MT Summit X, pages 259–266, Phuket, Thailand, Sep.
M. Wells. 1971. Elements of combinatorial computing. Pergamon Press.