Investigation and Analysis of Metal Casting
Defect by Using Quality Control Tools on
Trumpet Housing of a Tractor
Prateek Bhatt 1, Rohit Singla2
P.G. Student, Department of Mechanical Engineering, Amity University, Noida, Uttar Pradesh, India 1
Assistant Professor, Department of Mechanical Engineering, Amity University, Noida, Uttar Pradesh, India 2
ABSTRACT: Casting is very versatile process used in a number of engineering applications. One of the applications is in the production of Trumpet Housing used in a tractor for supporting its rear axle shafts. But due to poor quality of the foundry industryit has become difficult to meet defect free and strict delivery schedule in the production process. Hence to eradicate this situation, Quality Control Tools are being introduced for getting the best results from the production process. Total Quality Management is used in this paper for reducing the various casting defects and get the desired result. Casting defects generally occurs due to improper sand properties, improper gating system and labour skills. Due to such high rejection rates the confidence of the customer on the product is lost. Hence Quality Control Tools like Pareto Chart, Cause and Effect Diagram are used to identify and classify the reasons for defect in the production system and reduce them by using various remedial measures.
KEYWORDS: Casting Defects, Cause and Effect Diagram, Pareto Chart, Total Quality Management, Trumpet housing
I. INTRODUCTION
The trumpet housing used in tractors is used for supporting the right and left hand axle shafts. A normal duty trumpet housing is used for analysis of its defects. The housing is made of grey cast iron (FG250) [12]. With a total production of 8017 trumpet housings in a year, 953 were found defective due to different casting defects [10]. By learning Quality Control Tools [1] fromFábio A. Fernandes“On the use of quality tools: a case study” and Total Quality Management [3] from “Scrap reduction by using total quality management tools” the type of defects are being studied and ranked according to their severity i.e. the defect that caused maximum impact on the production process is treated before other defects. This gives a total idea of the major defects that are reducing the efficiency of the production system.
The casting process used in production is known as Sand Casting [8]. It accounts for 80% of the cast product and is used for both ferrous and non-ferrous metals. Silica sand is used for the production of molds and can be found near beaches or extracted by crushing sandstone.All materials used for manufacturing of sand mold and cores are termed as molding materials. The right choice of the composition of a molding mixture is of prime importance.Molds that are made from sand are very economical. A suitable bonding agent(usually clay) is mixed with the sand. This mixture is then moistened with water to gain the strength and plasticity of the clay, to make the mixture suitable for molding purposes.
II. LITERATURE REVIEW
skilled workers as compared to other industries [8]. The major rejected Trumpet Housing castings are analyzed by using “Defect Diagnostic Approach” [15]. At first all the defects are studied. [11] Paper on defects and remedies of casting process is used for the study of different defects and their remedies. This detailed study is later used in the manufacturing industry of trumpet housing where defects in the casting process were reaching skies and needed to be improved. For this purpose [4] paper on Reduction of Rejected Components in an Automobile Industry is studied which gives detailed about the variousprocesses going in the industry and the root causes of the defects. The major defects are identified by using Quality Control Tools. [2] Paper on Implementation of Quality Control Tools in an Automobile Organization to reduce rejections of Casting Components is studied. This paper has detailed information of how to use the SQC(Statistical Quality Control) tools are applied and also the use of software Minitab 17 for making the process more accurate and efficient [6]. Next Root Cause Analysis is applied in the process by using Brainstorming sessions and accumulating every data to a defined conclusion to solve the problem.
Identifying the defect correctly is the most important step in the casting defect analysis. Then the identification of the sources of the defect is to be made. By taking the necessary corrective remedial actions defects can be controlled. If wrong remedial actions are implied it can make the problem complicated and severe.
III. CASTING DEFECTS
Various casting defects such as Shrinkage defect, Blowholes, Cold Shut, Misrun, Gas Porosity, Mismatch, Cracks, Sand Burning, Fin, Sand Drop makes the production of molds inefficient and leads to higher rejection rates in the products. Hence to reduce these defects various remedies are used. Hence to identify the remedial measures for analyzed defects various Quality Control Tools are used.
IV. PRODUCTION PROCESS
The Trumpet Housing is produced by the following production processes:-
Raw Material Procurement
Melting
Metal Inspection
Knock out
Shot Blasting
Fettling
Inspection
Casting Inspection Report
Re-Shot Blasting
Painting
4.1). Properties of sand used in this foundry
The grain size of foundry sand is very uniform with approximately 85-95% of the material between 0.6mm and 0.15mm sieve sizes. The particle is sub-angular to round. This foundry sand is non-plastic and has low absorption properties. The specific gravity of foundry sand varies between 3.39 to 4.55 and foundry sand has a moisture content of 6.0-8.1%. This foundry sand consists of silica sand coated with a thin film of residual binder, dust and burnt carbon. Silica sand is hydrophilic, hence attracts water to its surface.
4.2). Analysis of rejections of all defects over a year
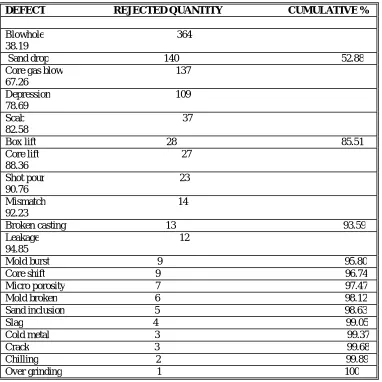
Table 1.Rejections of Trumpet Housing due to different defects
DEFECT REJECTED QUANTITY CUMULATIVE %
Blowhole 364 38.19
Sand drop 140 52.88 Core gas blow 137 67.26
Depression 109 78.69
Scab 37 82.58
Box lift 28 85.51 Core lift 27 88.36
Shot pour 23 90.76
Mismatch 14 92.23
Broken casting 13 93.59 Leakage 12 94.85
Mold burst 9 95.80 Core shift 9 96.74 Micro porosity 7 97.47 Mold broken 6 98.12 Sand inclusion 5 98.63 Slag 4 99.05 Cold metal 3 99.37 Crack 3 99.68 Chilling 2 99.89 Over grinding 1 100
When the total rejected quantity of a particular defect is divided by the total number of defects, it gives us the cumulative % of that particular defect.
For e.g. - the rejected quantity due to the defect blowhole = 364 Total number of defective pieces = 953
So, Cumulative percentage = 364/953 = 38.19% Total rejection percentage = 953/8017 = 11.887%
These values are fed into Minitab 17 Software through which the cumulative percentage is obtained. It can also be calculated by dividing rejected quantity due to particular defect with the total number of defects. Encrypting these values on the Minitab 17 sheet, then selecting the Pareto option gives a diagram showing the frequency of occurrence of all the defects. The one with the highest frequency is placed first and with least frequency at the last.
the evolution of gases. They are also known as Gas Holes. Blow holes are spherical, smooth walled cavities. It is of two types, Pin hole and Sub-surface hole. The evolved gases are trapped on the surface of the casting that results in a cavity. By providing venting channels, reducing the amount of gases, reducing moisture content of sand, improving the gas permeability, by reducing bentonite content, the blowholes can be reduced drastically.
(a) (b)
Fig. 1 Pareto charts for the defects (a) Pareto Chart for overall rejections due to various defects (b) Pareto Chart for defects due to Blowholes
Fig. 2-Cause and Effect Diagram for Blowhole Defect
This diagram is also known as Ishikawa Diagram. It is used to collect different opinions of people working in different departments (Quality Manager, Supervisor, Workers) collecting their data after brainstorming various causes of the
Rejected Quantity 364 140 137 109 37 28 27 23 14 13 12 9 40
Percent 38 15 14 11 4 3 3 2 1 1 1 1 4
Cum % 38 53 67 79 83 86 88 91 92 94 95 96 100
Defect Oth er Core Shi ft Leak
a ge
B rok en C
astin g Mism atch Shot Pou r Core Lift Box Lift Scab De p
ress ion
Core ga s
blow Sand drop Blow hole 1000 800 600 400 200 0 100 80 60 40 20 0 R e je c te d Q u a n ti ty P e rc e n t
Pareto Chart of Defect
REJECTION QUANTITY 85 67 58 34 33 20 16 16 12 11 6 6
Percent 23.4 18.4 15.9 9.3 9.1 5.5 4.4 4.4 3.3 3.0 1.6 1.6 Cum % 23.4 41.8 57.7 67.0 76.1 81.6 86.0 90.493.7 96.7 98.4 100.0 DEFECT May April Dec em ber Febr uary Octo ber June Jan u
ary July Mar ch Sept em ber Nove mbe r Augu st 350 300 250 200 150 100 50 0 90 80 70 60 50 40 30 20 10 0 R E JE C T IO N Q U A N T IT Y P e rc e n t
PARETO CHART FOR REJECTIONS DUE TO BLOWHOLES
BLOWHOLE MELTING PROCESS POURING MOULDING DESIGN MATERIAL Condition Metal Tempera ture Metal Composition
Insufficient Venting Binder
High Urea C ontent of sufficient Sand permeability not Wet Sand
Pouring Too C old
Pouring Too Slow ly Content of Charge
High Nitrogen
defects and representing it in a diagram. To analyze which problem is more severe, a Cause Effect Analysis for Blowholes is made.
V. FACTORS RESPONSIBLE FOR BLOWHOLES IN TRUMPET HOUSING CASTING:-
Wet sand
Sand permeability not sufficient
Too much binder
Insufficient venting
5.1). Solution implemented for wet sand
The sand that is being used contains a higher value of moisture content ranging between 6%-10%. Due to this the amount of vapor formed due to evaporation is more leading to more blowhole defect. For reducing this high moisture content, molding sand is dried at temperatures of 105 – 110 degree Celsius. Due to this the moisture content reduces to a level of 4.3 – 4.6%. This type of sand has optimum working range with an affective green compressible strength and permeability.Although the moisture content must not be too low. It will decrease the strength of the mold.
5.2). Solution implied towards escape of gases
The internal cavities should be designed such that the gases evolving from the cores of molten metal could easily escape. Sand burned into core holes and fins are difficult to remove because of small and long size of internal cores. Hence providing access holes will help to vent core gases as well as core sand to be removed out of the system. Another way of solving this problem is by changing the position of casting with reference to parting plane. By bringing the casting into the drag the core gases are properly vented.
VI. ANALYSIS OF SAND DROP DEFECT
Sand drop or sand crush is an irregularly shaped projection on the cope surface of a casting. This defect is studied on a monthly basis and is diagrammatically shown on a Pareto chart followed with Cause and Effect analysis.
Fig. 3- Pareto Diagram for Monthly Rejections due to Sand Drop Defect
Month 45 21 16 12 10 8 7 6 5 5 5
Percent 32.1 15.0 11.4 8.6 7.1 5.7 5.0 4.3 3.6 3.6 3.6
Cum % 32.1 47.1 58.6 67.1 74.3 80.0 85.0 89.3 92.9 96.4 100.0
Rejection Quantity
Othe
r
Oct
ober
Mar
ch
July
Janu
ary
April
Dece
mbe
r
Augu
st
June
May
Nov
em
ber
140
120
100
80
60
40
20
0
100
80
60
40
20
0
M
o
n
th
P
e
rc
e
n
t
Total rejections in a year due to sand drop = 140 Total production in a year = 8017
Hence rejection percentage = 1.75%
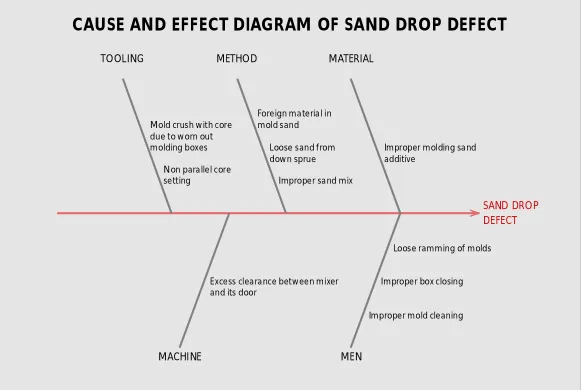
We also performed brainstorming session with the Lab Incharge, Quality Manager, Supervisor and discussed different reasons for the sand drop defect which were collected in a Cause and Effect Diagram.
Fig. 4- Cause and Effect Diagram for Sand Drop Defect
6.1). Factors responsible for sand drop in trumpet housing casting
Loose sand from down sprue passes with the metal
Improper molding sand properties
Foreign material in molding sand
Improper mold cleaning
Improper mixing of sand
Excess clearance between mixer and mixer door
6.2). Solutions implemented
For excess mixer door clearance
Mixer door adjustment to reduce excess clearance Mixer design modification to increase the overlap
For improper sealed runner bar ends by operator
Plugging and sealing of runner bar open ends by cold box core piece
Molding the line expansion to increase number of molding boxes to give sufficient cooling time
DEFECT SAND DROP TOOLING
MACHINE METHOD
MEN MATERIAL
additive Improper molding sand
Loose ramming of molds
Improper box closing
Improper mold cleaning Improper sand mix
down sprue Loose sand from mold sand Foreign material in
and its door
Excess clearance between mixer setting
Non parallel core molding boxes due to worn out Mold crush with core
Table2.Rejection Data After Successful Implementation of Solutions (for Blowholes Defect)
Month Rejection Production per month Rejection %
January 9 480 0.11
February 5 514 0.06
March 15 249 0.19
April 3 508 0.04
May 2 578 0.02
June 7 833 0.09
July 16 1129 0.20
August 31 865 0.39
September 25 835 0.31
October 5 476 0.06
November 31 1432 0.39
December 5 118 0.06
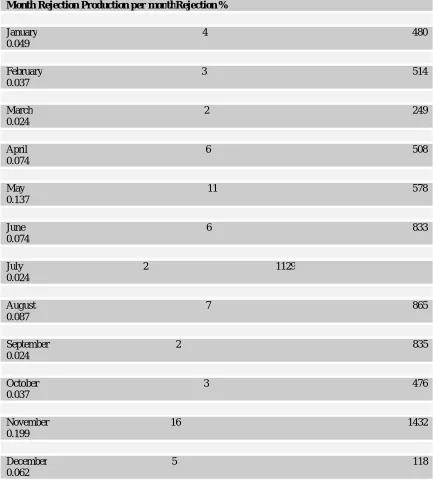
Table 3. Rejection data after successful implementation of solutions (for Sand Drop Defect)
Month Rejection Production per monthRejection %
January 4 480 0.049
February 3 514 0.037
March 2 249 0.024
April 6 508 0.074
May 11 578 0.137
June 6 833 0.074
July 2 1129 0.024
August 7 865 0.087
September 2 835 0.024
October 3 476 0.037
November 16 1432 0.199
December 5 118 0.062
Total production = 8017
VII. FINAL COST REDUCTION AFTER THE DROP IN PERCENTAGE REJECTION:-
Total revenue loss due to blowhole before implementation of quality control tools was Rs.5,38,720 and the revised revenue cost has been reduced to Rs.2,27,920
Total revenue loss due to Sand drop defect before the implementation of quality control tools was Rs.2,07,200 and revised revenue cost has been reduced to Rs.96,200
Hence total reduction in cost = Rs.1,11,000
VIII. CONCLUSION
As shown in Table 2 and 3 the total major defects i.e. blowholes and sand drop respectively are analyzed during the whole production process. As these defects are major cause of the rejections in the castings thus eliminating them will solve more than 50% of the problems. By applying the Quality Control Tools we studied the defects which include their monthly analysis and using brainstorming sessions with the staff members at the same time. Combining both these solutions a final solution is made for eliminating the defects which after being applied to the production process lead to significant reduction in the percentage rejection thus reducing costs and making profit for the industry.
Pareto diagram for defects have been drawn and the major rejections are due to Blowholes and Sand drop and it was noted to be higher in the months of August and November and lower during April and May.
Blowholes rejection rate has been reduced to 1.92% from 4.54% with a total savings of Rs.3,10,800
Rejection rate due to Sand drop has been reduced to 0.81% from 1.74% with a total savings of Rs.1,11,000
IX. ACKNOWLEDGEMENT
This paper has been developed after studying multiple papers, attending lectures and having practical experience of a big manufacturing industry. I want to thank the Manager of the manufacturing unit, the supervisor, the staff members who from the first day were helping me out to understand the industry better and know their system as well made me familiar with the mistakes they had done in the past during their manufacturing process of Trumpet Housing. I want to thank my mentor Dr. RohitSingla who was always there to help me when I was stuck in some situation. Other faculties from mechanical department who gave their precious time to me in explaining the Quality Control Tools which are being used by modern industries today.
My friends were constantly advising me about this field of research and giving me a new direction of study which is best suited for me. I would like to show my gratitude to Amity University, Noida who gave me an opportunity to express my views to world, gave me the key for communicating to the world and apply my knowledge in the industrial sector. I am proud to represent my thoughts and share my amazing experience of manufacturing industries with the world.
REFERENCES
[1]. Fábio A. Fernandes, Sérgio D. Sousa, Iaengand Isabel Lopes, On the use of quality tools : a case study, International Association of Engineers,
World Congress on Engineering 2013 Vol I
[2]. Pal J (2012), “Implementation of Quality Control Tools in an Automobile Organization to Reduce the rejection of Casting Components,”
International Conference on Research and Innovations in Mechanical Engineering, pp.613-622
[3]. Kumar S, Mantha S.S. and Kumar A(2003), “Scrap reduction by using total quality management tools”, International Journal of industrial Engineering, Vol. 16, No. 4, pp. 364-369
[4]. Jha M, Tyagi R.K., Gupta G (2013), “Reduction of rejected components in an automobile assembly line using quality tools,” European Journal of Applied Engineering and Scientific Research and Technology, Vol. 2, No. 3, pp. 13-17
[5]. Surange V.G., Teli S.N., Adak D.D. and Rane S.S. (2013),” Effective Utilization of Quality Cost Reducing Tools in Automobile Industry,”
International Journal of Advanced Technology and Engineering Research,” Vol. 2, No.2, pp. 44-53
[6]. Bhosale D.S, Shilwant S.C. and Patil S.R. (2013), “Quality improvement in manufacturing processes using SQC tools,” International Journal of Engineering Research,Vol. 3, No.3, pp. 832-837
[8]. P.N Rao, “Manufacturing Technology Foundry, Forming and Welding”, Metal Casting Processes, Volume 1, pp. 2-16
[9]. John Campbell Complete Casting Handbook Metal Casting Process Metallurgy Techniques and Design
[10]. Rajesh Rajkolhe J.G Khan (2014), “Defects Causes and Their Remedies in Casting Process”, International Journal of Research in Advent Technology, pp. 62-69
[11]. Achamyeleh A. Kassie Samuel B. Assfaw (2013), “Minimization of Casting Defects”, IOSR Journal of Engineering(IOSRJEN) PP 31-38
[12]. Iron Stores Engineering Works Trumpet Housing of Swaraz Tractor Handbook, Naiabadi, Khatauli
[13]. Mr. Siddalingswami.S.Hiremath, Dr. S.R. Dulange (2015) International Journal of Innovations in Engineering Research and Technology(IJIERT) Vol. 2, pp.8-15
[14]. Sushil Kumar, P.S. Satsangi, D.R. Prajapati, (2013) "Improvement of Sigma level of a foundry: a case study", The TQM Journal, Vol. 25 Issue: 1, pp.29-43